Mar 4, 2014 - Amy Griffin, Ph.D, University of New South Wales, Cambria; Jason Jurjevich, Ph.D., Portland State University; Meg Merrick, Ph.D., Portland ...
Visualizing Uncertainty: A User Study of Techniques for Geovisualizing Uncertainty in Survey Data for Urban Planning Adult Educational Attainment: Percent Graduate & Professional Degrees, ACS 2007-2011 Num:0 MOE: 0
Num:180 MOE: 86
Num:68 MOE: 66
90
Seth Spielman, Ph.D., University of Colorado, Boulder; Nicholas Nagle,, Ph.D., University of Tennessee, Knoxville; Amy Griffin, Ph.D, University of New South Wales, Cambria; Jason Jurjevich, Ph.D., Portland State University; Meg Merrick, Ph.D., Portland State University
Num:212 MOE: 222
Num:458 MOE: 179
Num:235 MOE: 116
80 Num:580 MOE: 333
70 60
Percent
30 10 0
Num:108 MOE: 62
Approaches to Mapping Uncertainty ANYOTHER
40
1 - 300
Num:448 MOE: 211
2005-2009 ACS Renter Household Paying Contract Rent (Cash Rent) by Census Tracts
597 - 1039
Num:144 MOE: 80 Num:685 MOE: 211
1750 - 3338
Num:1259 MOE: 557
DP02LanguagesSpokenHome
Num:755 MOE: 194
Num:766 MOE: 398
0.00 - 12.00
Num:1782 MOE: 556
Num:1894 MOE: 569
Num:712 MOE: 331
40.01 - 91.19
Num:333 MOE: 160
Num:776 MOE: 260 Num:1328 MOE: 308
12.01 - 40.00
Num:3245 MOE: 483
Num:927 MOE: 579
Num:2768 MOE: 453
Num:1363 MOE: 400
Num:1324 MOE: 340
Num:1146 MOE: 278
Num:1198 MOE: 324
Num:1882 MOE: 518
Num:680 MOE: 296 Num:862 MOE: 280
����������������� Based on prior interviews and surveys with urban planners (see baseline survey results included in the right panel of this poster), we have designed several decision-making ��
Num:2095 MOE: 309
Num:1416 MOE: 433 Num:1512 MOE: 375
Num:1827 MOE: 543
Num:1106 MOE: 367
Num:1503 MOE: 356
ACS RHHs Paying Contract Rent by Census Tracts
scenarios that could be expected to occur in a planner’s professional practice, and for which a consideration of the uncertainty, in statistical data the decisions are� based Hence, for our work, when presenting information like totals or frequencies, or summary upon, is likely to be important. Made with Esri Business Analyst www.esri.com/ba 800-447-9778 Try it Now!
Num:1159 MOE: 291
Num:669 MOE: 179
Num:748 MOE: 166
Num:519 MOE: 172
Num:776 MOE: 274
Num:192 MOE: 78
Num:2287 MOE: 541
Num:1639 MOE: 450
Num:1039 Num:1115 MOE: 339 MOE: 300
Num:2390 MOE: 739
Num:849 MOE: 341
Num:907 MOE: 356
March 04, 2014
Num:1824 MOE: 520
Num:1422 MOE: 346
Num:754 MOE: 502
Num:2072 MOE: 433
Num:880 MOE: 315
Num:343 MOE: 136
Num:1620 MOE: 458
Num:1264 MOE: 499
Num:1842 MOE: 529
Num:692 MOE: 404
Num:668 MOE: 296
Num:1426 MOE: 450
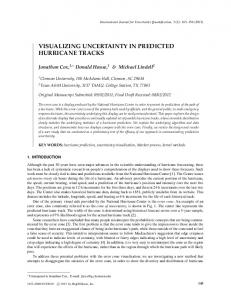
statistics like medians and mean averages, then we prefer to use relative measures of error like ����������������� Figure 1. Side-by-Side Approach: and Coefficients Variation (CVs)Sun and Wong’ Figure 2. Single Map Approach: Choropleth map of classified values labeled This research will use these scenarios to investigate the effectiveness of different the coefficient of variation (CV). See FigureValues 3, where the firstofmap reflects ANYOTHER �� (traffic signal color-coding) (ESRI Business Analyst). with the estimates and margins of error (MOE) (IMS/PRC). visualization techniques to communicate uncertainty to planners and will focus on cross-hatching approach with data driven 3 category legends, and the second is one showing our 1 - 300 � addressing the following research question: exploratory work at PAD on developing legends more meaningful to researchers and policy folk. ����������������� ©2014 Esri
Page 1 of 1
©2014 Esri
Page 1 of 1
Num:738 MOE: 294
Num:1128 MOE: 396
Num:816 MOE: 303
Num:0 MOE: 0
Num:0 MOE: 0
How, and to what extent, do various mapping visualizations support users � working with uncertainty in ACS data?
301 - 596
��
597 - 1039
1040 - 1749
Figure 20
Num:0 MOE: 0 Num:0 MOE: 0
Figure 20
Num:0 MOE: 0 Num:0 Num:0 MOE: 0 MOE: 0
1750 - 3338
To accomplish this, we will be running a two-stage experimental study to compare different methods. All associated surveys, scenarios, data visualizations, and questionnaires will be delivered via a webpage designed for this purpose.
Num:0 MOE: 0
Num:1438 MOE: 449
Num:612 MOE: 244
Num:906 MOE: 432
Num:1385 MOE: 466
Num:1291 MOE: 397
Num:648 MOE: 257
Num:0 Num:0 MOE: 0 MOE: 0
Num:169 MOE: 140
Num:305 MOE: 154
Participant Demographics (N=194) Num:295 MOE: 264
Num:337 MOE: 185
Num:323 MOE: 214
Num:704 MOE: 238
Num:1070 MOE: 263
Num:486 MOE: 291
Num:571 MOE: 268
Num:59350 MOE: 174
80
40
Num:396 MOE: 145
Num:1395 MOE: 320
Num:497 MOE: 226 Num:596 MOE: 281
Num:348 MOE: 154
Num:371 MOE: 140
Num:712 MOE: 225 Num:287 MOE: 130
Num:772 MOE: 324
Num:390 MOE: 202
Num:54 MOE: 59
Num:928 MOE: 362
60
Num:717 MOE: 219
40 20
Any demographic data
Num:917 10 MOE: 262
Number of GIS courses completed
Number of Courses Completed
of planning TypeType of Planning Number of years working in planning
Type of organization
MOE: 113
30 Num:629 MOE: 249
Num:460 MOE: 223
Num:843 MOE: 350
20
Num:163 MOE: 105
Num:977
In a university course
Num:242 MOE: 123
40
Num:373 MOE: 260
In a Census MOE: 326 From the Bureau Census training Bureau's program website
From a professional magazine
10
Other
Num:246 MOE: 208
Num:464 MOE: 288
Num:105 MOE: 61
Num:157 MOE: 153
Num:626 MOE: 275
Num:561 MOE: 420
Num:365
0
MapsMOE: 206 Bar chart Maps
Table
Textual description
Pie chart
Other statistical graph
Num:490 MOE: 282
Num:100 MOE: 74
Num:558 MOE: 301 Num:331 MOE: 145
Participant Attitudes Related to the American Community Survey and Margins of Error
Num:714 MOE: 502
Num:63 MOE: 67
Num:236 MOE: 160
Num:236 MOE: 160
Num:193 MOE: 160
Mean=3.86 St Dev=.944 N=194
Mean=2.68 St Dev=.983 N=194
0 0
2
1
3
5
4
I should be more careful when using American Community 1 = strongly agree, 5 = strongly disagree Survey data for small geographies (census tracts) than for large geographies (counties).
� Figure 4. Single Map Approach: Choropleth map ‑ color indicates values; X’s and O’s indicate uncertainty (Francis et al., 2012).
Num:622 MOE: 417
1 = strongly agree, 5 = strongly disagree
Mean=1.54 St Dev=.71 N=194
0
2
1
5
4
3
6
I feel like the Census Bureau does an adequate job of explaining the 1 = strongly agree, 5 = strongly disagree American Community Survey. 1=strongly agree, 5=strongly disagree
1
2
3
4
5
6
The reliability of data from the American Community Survey (5year estimates) is the same for all places.
1 = strongly agree, 5 = strongly disagree
1=strongly agree, 5=strongly disagree
1=strongly agree, 5=strongly disagree
� 1 = increases, 3 = decreases 1 = strongly agree, 5 = strongly disagree
2
1
4
3
5
0
6
When I use American Community Survey data, I don’t pay much 1 = strongly agree, 5 = strongly disagree attention to the margins of error. 1=strongly agree, 5=strongly disagree
1
2
3
4
5
6
Based on my professional experience, agencies evaluating grant applications do not want to 1 = strongly agree, 5 = strongly disagree know about the margins of error on American Community Survey data or other demographic data. 1=strongly agree, 5=strongly disagree
Mean=1.68 St Dev=.769 N=194
Figure 21 ������������Ǥ� ǡ�ʹͲͳʹǡ�
ǡ������� ��ͺ� Figure 6. Single Map Approach: Choropleth map ‑ color indicates values; degrees of � “sketchiness” indicate uncertainty (Griffin).
��ʹͷ�
Mean=2.52 St Dev=.978 N=194
1 = strongly agree, 5 = strongly disagree
1 = strongly agree, 5 = strongly disagree
0
Mean=2.59 St Dev=.90 N=194
Mean=3.58 St Dev=1.15 N=194
Impact on Future Research
�����������Ǥ� ǡ�ʹͲͳʹǡ�
ǡ������� �
Line graph
do you communicate withdemographic demographic data? How How do you communicate with data?
learned aboutthe the ACS ACS How How you you learned about
Num:0 MOE: 0
Num:475 MOE: 184
20
Num:216
0MOE: 115 On the job
50
30
10
Num:0 MOE: 0
This research combines expertise in statistics, traditional and web cartography, and information science to provide direct contributions to our understanding of how users conceptualize and acquire knowledge about uncertainty in mapped statistical data, and Figure 3 how this knowledge is incorporated into decisions they make based on the effectiveness of the visualization techniques to convey the uncertainty. The broader impacts of this �����������Ǥ� ǡ�ʹͲͳʹǡ�
ǡ������� research include the development of techniques that better communicate uncertainty Figure Figure 5. Single Map Approach: Choropleth map 21 ‑ color indicates values; color� U.S. in statistical data, and provide tools promoting the responsible use of data by coded crosshatching indicates uncertainty (Francis et al., 2012). Census Bureau users, as well as other agencies.
Num:42 MOE: 38
Why other demographic data sources were used Number of courses completed
Num:296 MOE: 102
40.01 - 91.19
Figure 3. Single Map Approach: Choropleth map ‑ color indicates values; dots and lines indicate uncertainty (Francis et al., 2012).
Num:475 MOE: 263
Num:16 MOE: 21
Num:363 MOE: 209
30
25
Num:144 MOE: 112
MOE: 226
Num:793 MOE: 262
50
30
20
MOE: 215
70
35
Num:286 MOE: 135
HowNum:1098 do you use demographic data? Num:503
90
45
Num:304 MOE: 105
Num:633 MOE: 230
Num:832 MOE: 402
Num:138 Num:331 MOE: 131 Num:394 Num:476 MOE: 180 ACS data Num:1084 0 15 Num:506 Num:316 MOE: 190 MOE: 241 Num:1647 MOE: 354 MOE: 218 MOE: 151 MOE: 542 Num:352 Num:297 Num:271 Num:249 Num:1415 10 MOE: 226 Num:311 MOE: 145 MOE: 138 Num:349 MOE: 252 5 Num:728 MOE: 107 MOE: 250 Num:1023 MOE: 197 MOE: 371 MOE: 299 Num:310 Num:1250 Num:613 Num:162 Num:233 5 MOE: 126 Num:394 MOE: 412 MOE: 189 MOE: 81 MOE: 95 Num:1081 Num:402 Num:1021 MOE: 184 Num:368 Num:139 MOE: 154 MOE: 347 Num:519 MOE: 303 0 MOE: 271 0 Num:1343 Num:341 MOE: 75 MOE: 223 Num:367 regional Num:328 non-profit notNum:156 state university other planning county city federal Num:343 MOE: 320 Num:371 Num:305 Num:227 MOE: 145 None 1 2 3 to 5 Num:5696 or more MOE:Not 173 answered MOE: 67 Num:159 government organization answered government consultancy government government government MOE: 141 MOE: Num:1772 129 MOE: 228 MOE: 103 Num:1433 MOE: 83 MOE: 300 MOE: 564 organization Num:337 MOE: 74 agency agency MOE: 313 Num:1999 Num:320 Num:952 Num:2288 Num:1261 Num:533 MOE: 130 Num:542 Num:483 MOE: 485 MOE: 260 MOE: 596 Num:2237 MOE: 342 Num:2069 MOE: 242 Num:225 MOE: 175 MOE: 157 MOE: 200 Num:1005 Num:720 Num:809 MOE: 810 Num:510 Num:278 Num:623 MOE: 578 Num:2435 MOE: 119 Num:194 Num:551 MOE: 551 MOE: MOE: 403 MOE: 230 MOE: 105 MOE: 143 297 MOE: 560 MOE: 114 MOE: 178 Num:2949 Num:514 Num:320 Num:410 Num:416Num:42325 MOE: 752 MOE: 198 MOE: 236 MOE: 148 Num:1359 Num:2856 Num:1859 Num:862 MOE: 175MOE: 145 Num:459 MOE: 339 Num:812 Num:117 MOE: 777 MOE: 370 Num:2050 MOE: 292 Num:1332 Num:869 Num:30 Num:322 Num:243 MOE: 185 Num:152 Num:1336 50 MOE: 60 Num:515 MOE: 312 MOE: 595 MOE: 488 MOE: 414 MOE: 35 MOE: 126 MOE: 80 45 MOE: 78 MOE: 452 Num:1705 6025 Num:254 MOE: 191 MOE: 413 MOE: 133 Num:523 Num:1161 40 Num:380 45 Num:971 Num:1286 20 MOE: 344 Num:1948 Num:379 MOE: 168 MOE: 173 Num:400 Num:739 Num:795 MOE: 285 MOE: 398 35 50 MOE: 388 Num:1803 Num:1514 Num:1906 MOE: 169 MOE: 279 Num:942 MOE: MOE: Num:282 40 Num:1023 Num:2599 Num:722 Num:1127 MOE: MOE: 430 MOE: 417 MOE: 381 448 196 MOE: 144 Num:304 20 MOE: 453 Num:182 MOE: 826 30 MOE: 315 MOE: 320 463 MOE: 126 Num:105 Num:2660 MOE: 88 35 MOE: 77 40 Num:1834 MOE: 787 25 Num:189 Num:361 Num:492 Num:638 Num:952 Num:444 MOE: 605 Num:205 Num:1643 Num:398 15 MOE: Num:201 MOE: 322 MOE: 86 30 MOE: 228 MOE: 177 MOE: 278 Num:1363 MOE: 105 Num:443 MOE: 435 20 MOE: 246 Num:336 159 MOE: 102 Num:871 MOE: 252 Num:774 Num:526 MOE: 208 MOE: 200 3015 MOE: 353 Num:137 MOE: 301 MOE: 201 15 25 Num:1916 Num:161 MOE: 80 Num:401 Num:958 MOE: 551 MOE: 75 Num:665 10MOE: 222 Num:392 Num:1300 MOE: 197 Num:2087 20 MOE: 281 Num:1461 10 20 Num:1108 Num:400 MOE: 148 Num:196 MOE: 356 Num:453 MOE: 438 MOE: 407 5 Num:455 MOE: 408 MOE: 294 MOE: 95 10 MOE: 254 Num:303 15 MOE: 190 MOE:0171 Num:721 10 MOE: 246 10 Num:180 Num:255 Num:661 MOE: 99 5 MOE: 127 Num:300 Num:303 MOE: 336 5 Num:1263 Num:1323 05 MOE: 149 MOE: 96 Num:1275 MOE: 696 MOE: 355 State requires Grants program Need population Num:283 Num:1974 MOE: 473 Geographic scaleAs corroboration Data frequency Data reliability is Census data 0 fits my needs for census is better better doesn't provide their use mandates their projections MOE: 214 MOE: 563 Num:170 Num:491 better statistics needed use MOE: 113 Num:1136 None 1 2 3 to 5 6 or more Not answered Num:227 MOE: 178 variables 0 MOE: 500 0 Num:759 MOE: 125 regional non-profit not state university other planning county city fede Num:955 MOE: Less than 5 5 to 9 10 to 14 15 to 19 20 to 24 25 to 29 30 or 283 more Not MOE: 286 government organization answered government consultancy government government govern answered Num:467 Num:414 Num:862 Num:774 organization agency agen MOE: 333 MOE: 234 MOE: 321 MOE: 214 Num:565 Num:705 GIS Statistics Num:305 MOE: 307 MOE: 390 Num:466 MOE: 172 MOE: 337 Num:1018 Num:591 Num:1209 Num:257 MOE: 265 MOE: 261 Num:623 MOE: 330 MOE: 150 70 MOE: 254 90 Num:736 Num:313 MOE: 248 MOE: 165 Num:120 Num:184 Num:390 MOE: 80 Num:854 Num:258 MOE: 96 60 80 Num:878 Num:290 MOE: 200 MOE: 292 MOE: 288 MOE: 393 MOE: 185 Num:595 MOE: 251 70 Num:384 50 Num:172 MOE: 193 Num:416 MOE: 140 Num:535 MOE: 228 Num:364 60 MOE: 217 MOE: 258 40 Num:151
Num:0 MOE: 0
0.00 - 12.00
Num:776 MOE: 361
Num:526 MOE: 173
Num:163 MOE: 216
Num:122 MOE: 66
Num:769 MOE: 253
Num:0 MOE: 0
12.01 - 40.00
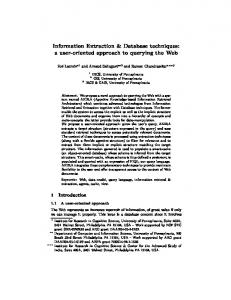
Stage 2 [Mid 2014]. Similar to Stage 1, we rely on a secure webpage to first collect demographic information, and then proceed by asking professional planners in the Portland metropolitan area to select the most qualified areas based on an established set of criteria specific to a policy-specific decision-making scenario. Unlike Stage 1, however, this phase of the experiment introduces infrared eye tracking (neither harmful to nor visible by human eyes) to better understand cognitive interaction (i.e. where on the map a participant is looking); the location of each gaze (x and y) and time spent with various data visualizations of uncertainty; and, whether an individual looks at particular map features. Data gathered from the eye tracking software will not only provide additional information about how planners are reading the maps, but help us to better understand how, and to what extent, planners use uncertainty information from various Eye tracker experiment. visualizations to make policy-specific decisions.
Num:160 MOE: 117
Num:343 MOE: 179
Num:920 MOE: 355
Num:0 MOE: 0
CV3
Stage 1 [Early 2014]. Delivered using a secure webpage, the first stage of the experiment asks Portland planning students to complete a short demographic questionnaire and next, asks participants to read/interpret maps to select the most qualified areas based on an established set of criteria related to a policy-specific decision-making scenario (e.g. high levels of poverty and targeted funding for education). In addition to recording answers specific to the policy-specific scenario, this phase of the experiment will record individual response time to the particular question as well as interactions with the map (e.g., mouse-clicks, turning map layers on and off, etc.). Data collected from the map interactions will allow us to refine the design of the visualizations and focus on the experiment parameters for Stage 2 of the experiment.
Num:409 MOE: 238
Num:671 MOE: 286
Num:942 MOE: 297
DP02LanguagesSpokenHome
Methods
Num:1342 MOE: 386
Num:917 MOE: 434
Num:1607 MOE: 412
Num:0 MOE: 0
Num:1611 MOE: 458
Num:549 MOE: 243
Num:364 MOE: 202
Num:543 MOE: 182
Num:386 MOE: 220
Num:0 MOE: 92
10
Num:297 MOE: 198
Typeof of Organization organization Type
Num:718 MOE: 308
Num:658 MOE: 198
Num:1937 MOE: 496
Num:1209 MOE: 356
Num:622 MOE: 276
Num:2173 MOE: 382
Num:725 MOE: 227
Num:391 MOE: 214
Unavailable data
March 04, 2014
Num:907 MOE: 242
Num:672 MOE: 380
ACS estimate is considered reliable Caution using ACS estimate Low confidence in ACS estimate
300 - 537 0 - 299
Num:1404 MOE: 359
Num:245 MOE: 89
Num:1653 MOE: 428
Num:1807 MOE: 346
0
Num:701 MOE: 457
Scale of organization
Num:967 MOE: 320 Num:1901 MOE: 449
Num:3338 MOE: 421
Num:413 MOE: 158
Num:1331 MOE: 362
Num:1749 MOE: 495
Num:182 MOE: 163
Made with Esri Business Analyst www.esri.com/ba 800-447-9778 Try it Now!
Num:693 MOE: 241
Num:372 MOE: 291
CV3
1,130 - 3,697 756 - 1,129 538 - 755
Num:1587 MOE: 395
Num:1419 MOE: 334
5
Num:693 MOE: 380
Num:464 MOE: 228
20
10 Num:571 MOE:15 183
Num:172 MOE: 102
ACS RHHs Paying Contract Rent by Census Tracts
Num:1279 MOE: 454
25
15 Num:1526 20 MOE: 373
Num:575 MOE: 316
Num:457 MOE: 210
Percent Percent Percent
Num:190 MOE: 102
Num:972 MOE: 598
Num:498 MOE: 301
Percent
1040 - 1749
Num:295 MOE: 123
25
Num:268 MOE: 106
Baseline Planner Survey Results
Percent
2005-2009 ACS Renter Household Paying Contract Rent (Cash Rent) by Census Tracts
Percent
Num:1995 MOE: 572
Num:485 MOE: 199
Num:1068 MOE: 446
Num:1230 Num:1286 MOE: 399 MOE: 370
Num:659 MOE: 274
35
Num:948 MOE: 526
Num:1129 MOE: 344
Num:1115 MOE: 478
Any demographic data Num:633 Num:518 MOE: 184 Num:622 MOE: 217 ACS data MOE: 237
Num:691 MOE: 382
30
301 - 596 Custom Map
Custom Map
Num:226 MOE: 94
Num:135 MOE: 91
Percent
Surveys such as the American Community Survey (ACS), undertaken by the U.S. Census Bureau, produce statistics that are often mapped. A key characteristic of these statistics is that they are estimates of a quantity rather than actual, true counts. This means that there is some uncertainty in how well the estimate reflects the true value of the statistic. Although the Census Bureau publishes information about the uncertainty in the statistics, not everyone consults these tables. This research works towards developing methods for including uncertainty information directly in maps of statistics from surveys like the ACS. This way, users of these statistics can easily see the uncertainty in the statistics and consider how it affects decisions they make based upon the mapped statistics. It is our goal that this research will provide tools to help promote the responsible use of data by users of U.S. Census Bureau data, as well as other agencies within the Federal Statistical System.
Num:68 MOE: 59
Num:529 MOE: 229
Num:230 MOE: 114
Num:737 MOE: 308
Num:144 MOE: 92 Num:1305 MOE: 519
Num:997 MOE: 399
Num:283 MOE: 162
Num:16 Num:268 MOE: 24 Num:523 MOE: 243 MOE: 130
Percent
Introduction
Num:172 MOE: 113
Num:179 MOE: 121
Num:1525 MOE: 428
Num:209 MOE: 119
Num:282 MOE: 164
Num:158 MOE: 77
20
Num:89 MOE: 71
Num:1359 MOE: 484
Num:629 MOE: 281
40
Num:671 MOE: 539
Num:866 MOE: 343
Num:218 MOE: 131
50
Num:418 MOE: 156
Num:539 MOE: 346
Num:515 MOE: 179 Num:341 MOE: 149
Num:232 MOE: 106
Num:254 MOE: 160
Percent
Research funded by the National Science Foundation (NSF)
Num:586 MOE: 320
Num:70 MOE: 73
Num:418 MOE: 220
Num:408 MOE: 139
Num:183 MOE: 196
Num:270 MOE: 157
Num:376 MOE: 212
Percent Percent
Num:0 Num:0 Num:0 Num:0 Num:0 MOE: 0 Num:0 Num:0 MOE: MOE: 0 MOE: 0 0MOE: MOE:00 MOE: 0
0
1
2
3
4
5
6
Demographic and economic estimates from the American Survey are only suitable 1 Community = strongly agree, 5 = strongly disagree for making comparisons between places if margins or error are considered. 1=strongly agree, 5=strongly disagree
Selected References Francis, J., Vink, J. Tontisirin, N., Anantsuksomsri, S. and Zhong, V. (2012). http//pad.human.cornell.edu/maps2010/atlacs.cfm De Cola, L. (2002). “Spatial Forecasting of Disease Risk and Uncertainty.” Cartography and Geographic Information Science, 29:363-380.
�
��ʹͷ�
1
2
3
The inclusion of margins of error with Amercian Community Survey data______ my level 1 = increases, 3 = decreases of trust in the data. 1=increases 3=decreases
MacEachren, A.M., Robinson, A., Hopper, S., Gardner, S., Murray, R., Gahegan, M., and Hetzler, E. (2005). “Visualizing Geospatial Information Uncertainty: What We Know and What We Need to Know.” Cartography and Geographic Information Science, 32:139-160. Sun, M. and Wong, D.S. (2010). “Incorporating Data Quality Information in Mapping the American Community Survey Data.” Cartography and Geographic Information Science, Vol. 37, Number 4:285-300.