806
IEEE TRANSACTIONS ON AUDIO, SPEECH, AND LANGUAGE PROCESSING, VOL. 20, NO. 3, MARCH 2012
Voice Conversion Using Dynamic Kernel Partial Least Squares Regression Elina Helander, Hanna Silén, Tuomas Virtanen, Member, IEEE, and Moncef Gabbouj, Fellow, IEEE
Abstract—A drawback of many voice conversion algorithms is that they rely on linear models and/or require a lot of tuning. In addition, many of them ignore the inherent time-dependency between speech features. To address these issues, we propose to use dynamic kernel partial least squares (DKPLS) technique to model nonlinearities as well as to capture the dynamics in the data. The method is based on a kernel transformation of the source features to allow non-linear modeling and concatenation of previous and next frames to model the dynamics. Partial least squares regression is used to find a conversion function that does not overfit to the data. The resulting DKPLS algorithm is a simple and efficient algorithm and does not require massive tuning. Existing statistical methods proposed for voice conversion are able to produce good similarity between the original and the converted target voices but the quality is usually degraded. The experiments conducted on a variety of conversion pairs show that DKPLS, being a statistical method, enables successful identity conversion while achieving a major improvement in the quality scores compared to the state-of-the-art Gaussian mixture-based model. In addition to enabling better spectral feature transformation, quality is further improved when aperiodicity and binary voicing values are converted using DKPLS with auxiliary information from spectral features. Index Terms—Kernel methods, partial least squares regression, voice conversion.
I. INTRODUCTION
T
HE aim of voice conversion is to modify speech spoken by one speaker (source speaker) to give an impression that it was spoken by another specific speaker (target speaker). The features to be transformed in voice conversion can be any parameters which describe the speech and the speaker identity, e.g., spectral envelope, excitation, fundamental frequency , and phone durations. The relationship between the source and target features is learned from training data. A fundamental challenge in voice conversion is to take advantage of a limited amount of training data. A wide variety of approaches have been proposed for forming the conversion functions in voice conversion. One of the earliest approaches has been a mapping codebook [1], but its ability to model new Manuscript received September 22, 2010; revised May 30, 2011; accepted August 07, 2011. Date of publication August 22, 2011; date of current version January 18, 2012. This work was supported in part by the Academy of Finland (application number 129657, Finnish Programme for Centres of Excellence in Research 2006–2011, and project 123431). The work of E. Helander and H. Silén was supported by the graduate school of Tampere University of Technology. The associate editor coordinating the review of this manuscript and approving it for publication was Prof. Keiichi Tokuda. The authors are with the Department of Signal Processing, Tampere University of Technology, 33720 Tampere, Finland (e-mail:
[email protected];
[email protected];
[email protected];
[email protected]). Digital Object Identifier 10.1109/TASL.2011.2165944
data is limited. Hence, statistical methods have become popular during the last two decades. Many of the statistical methods for voice conversion are limited to linear conversion functions, and do not usually take the temporal continuity of speech features into account. Neural networks [2] offer a nonlinear solution but their problem is the requirement of sometimes massive tuning in order to avoid overtraining. The use of local conversion functions [3]–[5] allows the individual transformation functions to be rather simple. A major concern in local methods is the discontinuities that may occur at the boundaries of a conversion function change. The most widely used approach, Gaussian mixture model (GMM)based conversion [6], [7] tries to solve the problem by modeling the data using a Gaussian mixture model, and using a conversion function that is a weighted sum of local regression functions. If the number of mixtures in the GMM is set high, this can result in overfitting the training data. In order to obtain an efficient global conversion function and avoid overtraining, a GMM can be used to get the initial division of data and the optimal mapping function can be extracted using partial least squares regression [8]. Each frame of speech is typically transformed independently from the neighboring frames, which causes temporal discontinuities to the converted speech. In GMM-based approaches there is usually only a single mixture component that dominates in each frame [8]. This makes GMM-based approach shift from a global model towards the use of local conversion functions and thus susceptible to discontinuities. Solving the time-independency problem of GMM-based conversion was proposed in [9] through the introduction of maximum likelihood estimation of a spectral parameter trajectory based on a GMM similarly to hidden Markov model (HMM)-based speech synthesis [10]. A recent approach [5] bears some similarity to [11] by using the relationship between the static and dynamic features to obtain the optimal speech sequence but does not use the transformed mean and (co)variance from a GMM transformation. In [12], the converted features were low-pass filtered after conducting the GMM-based transformation. Alternatively, the GMM posterior probabilities can be smoothed before making the conversion [8]. The methods used to improve continuity in [8] and [12] are more like ad hoc solutions and can be considered as temporal post-filtering approaches. There is usually a tradeoff between the speech quality and the success of voice identity transformation. Statistical methods are efficient for converting the identity but the quality is degraded. The combination of GMM-based conversion and frequency warping aids in maintaining the speech quality [13] but to a certain extent, it suffers from degraded identity conversion performance.
1558-7916/$31.00 © 2011 IEEE
HELANDER et al.: VOICE CONVERSION USING DKPLS REGRESSION
807
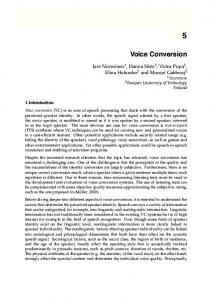
Fig. 1. Overview of the training procedure using dynamic kernel partial least squares regression of speech features.
In this paper, we propose a voice conversion system based on dynamic kernel partial least squares (DKPLS). The method allows nonlinear conversion based on a kernel transformation as a pre-processing step [14], which is a novel technique in the context of voice conversion. We also propose a novel method for modeling the dependencies between frames in the source data by augmenting the kernel transformed source data with the kernel data from consecutive frames. Dynamic modeling and the use of kernel matrices introduce collinearity which is problematic for the standard linear regression methods. We estimate a linear transform for the kernel transformed features using partial least squares (PLS) regression. PLS is able to handle collinear data and a large number of features without manual tuning even when the amount of training data is limited. The proposed methods is shown to achieve good speech quality while retaining the identity transformation efficiency of statistical methods. The parameterization and the flexibility of the analysis/synthesis framework play an important role in the resulting quality of converted speech. The essential questions are, what features should be modified and how. In this paper, speech is decomposed into spectral envelope and excitation with fundamental frequency and aperiodicity envelope using STRAIGHT analysis/synthesis system [15]. Most of the voice conversion approaches focus on predicting the spectral envelope, but in this paper all of these features are converted with DKPLS for making a complete voice conversion system. Conventionally, a binary voicing value is copied from the source but in this paper it is predicted for the target. The prediction is done using source voicing as well as spectral and aperiodicity features. In addition, we consider aperiodicity modeling that uses auxiliary information from the spectrum. The use of auxiliary information in prediction allows the features to be in line with each other and enables improving the quality of the converted speech. How to do cross-validation for determining the rank of PLS regression matrix for speech features is also addressed. This paper is organized as follows. Section II describes the dynamic kernel partial least squares method for nonlinearly mapping the parameters, together with temporal dynamics modeling. Section III describes the analysis/synthesis framework and the features that are mapped in the experiments. Practical experiments and the results are described in Section IV. Finally, Section VI concludes the paper.
II. DYNAMIC KERNEL PARTIAL LEAST SQUARES REGRESSION OF SPEECH FEATURES A. System Overview The voice conversion process usually consists of two parts: training and conversion. In training, the transformation function from source speech features to target speech features is formed based on training data. In the conversion, the function is used to transform source speech into target speech. In this paper, we concentrate on the conventional problem formulation that involves one source speaker whose speech characteristics are to be transformed to mimic the speaker characteristics of a certain target speaker. The model is learned from parallel data. Examples of systems where nonparallel data is used are, e.g., the eigenvoice approach [11] or speaker adaptation in HMM-based speech synthesis [16]. In training, the conversion function is found by minimizing the sum of squared conversion errors (1) where is a source feature vector, is the corresponding target feature vector, is the index of a pair of source and target data vectors, and is the total number of training vector pairs. Fig. 1 gives an overview of the training parts of the proposed system. Before finding the conversion function, the source and target data are temporally aligned. The alignment enables processing of source and target utterances of different length and it can be done for instance using dynamic time warping (DTW) [17] as is done in the experiments of Section IV. An illustration of aligned features is also provided in Section IV-A. After the alignment k-means clustering is applied on the source data to find a set of reference vectors, and then the source data is nonlinearly transformed by a kernel transform, as explained in Section II-B. The proposed kernel regression requires that the data is zero-mean, and therefore the resulting kernel is centered, as explained in Section II-C. We model the temporal continuity of speech features by concatenating the kernels from adjacent frames, as explained in Section II-D. The conversion model parameters are found by applying partial least squares regression that is able to tackle the problem of data multicollinearity and avoid overtraining, as explained in Section II-E.
808
IEEE TRANSACTIONS ON AUDIO, SPEECH, AND LANGUAGE PROCESSING, VOL. 20, NO. 3, MARCH 2012
C. Kernel Centering
Fig. 2. Overview of the test procedure using dynamic kernel partial least squares regression of speech features.
Parameters obtained in the training phase are further used in the test phase that consists of kernel matrix forming and kernel centering as well as regression-based prediction of the target features of all the source frames , which is illustrated in Fig. 2.
B. Kernel Transformation The kernel transform is done by calculating the similarity between each source vector , and reference vector , where is the number of reference vectors. There are many alternatives for kernel functions like polynomial kernel, Gaussian kernel or sigmoid kernel. A Gaussian kernel is defined as (2) where is the width of a Parzen window for the kernel. The selection of is not highly crucial, usually it is enough to find a decent range for [14]. In this paper, we use the Gaussian kernel since it is simple and efficient. The resulting kernel matrix is rectangular and has the following form:
To force the bias term of the conversion model to zero, kernel centering is used. Centering in the kernel space is not as obvious as in the original feature space, since the mean cannot be computed directly. A similar strategy is used for kernel centering as with kernel PCA [19]. A more computationally efficient way is described in [20] and it is used in this paper. For training kernel obtained from the training data and reference vectors we apply the following steps [20]. 1) Calculate the average of each row in the kernel matrix and subtract the values from . The averages of the rows are stored into vector . 2) Calculate the average of each column and subtract them from resulting from Step 1. The resulting column and row-wise centered kernel matrix is denoted with . For the test data, the testing kernel is formed using the testing data and the reference vectors, and the following centering operations are applied. 1) Subtract the values from each column entry of . 2) Calculate the average of each column and subtract the values from resulting from Step 1. The centered kernel matrix is denoted with . D. Dynamic Modeling A major question in voice conversion has been how to take into account the continuity of the speech features in time. In [9], source and target feature vectors were augmented with their first-order delta features and converted parameter trajectories were estimated at sentence-level using maximum-likelihood estimation. One approach to incorporate dynamic information is simply to concatenate the kernel vectors for the adjacent frames to obtain a vector as
(3)
(5)
We obtain the reference vectors by k-means clustering the source vectors of the training data. Alternative methods could also be used, for example the reference vectors can be all the samples from the training data (i.e., a standard square kernel matrix, ), or a set of samples can be selected from the data. According to our experiments presented in more detail in Section IV, the number of reference vectors can be very low compared to the number of observations. Note that k-means is mainly used for data quantization purposes whereas in data classification tasks, the selection is likely to be more critical. K-means could also be carried out in the kernel transformed space [18], but this would require that initially the whole square kernel matrix is formed. On the other hand, k-means in the original feature domain is easy to carry out and we can either use the cluster centers as reference vectors or choose the samples that are closest to the center to act as reference vectors. In this paper, we use the averages of each cluster as the reference vectors. After the kernel transform, the kernel vector corresponding to source vector is
where denotes the centered kernel vector for feature vector and and the centered kernel vectors for the frames preceding and following , respectively. The augmentation of dynamic information employing DTW-aligned data is illustrated later in Section IV-A. The use of data in subsequent frames (5) poses a one-frame delay in conversion. Naturally longer delays could be used as well. Concatenating the features allows the regression to make use of the correlation between adjacent frames. Furthermore, the kernel vector for frame is used as a part of vectors , and which is likely to introduce correlation between consecutive converted frames. Note that in conversion all frames are transformed and thus frames and are the preceding and succeeding frame of the frame .
(4)
(6)
E. Kernel Partial Least Squares After the kernel transformation, we use a linear regression model
HELANDER et al.: VOICE CONVERSION USING DKPLS REGRESSION
where and denote the source and target observation vectors, respectively; denotes the regression residual, and is the regression matrix. In our case, is the kernel vector augmented with the kernel vectors of the previous and next frame (5) when the dynamic model is used, or simply the kernel vector , when the dynamic model is omitted. The vector is the unprocessed target vector. The entries in become linearly dependent due to the use of kernels. Furthermore, the dynamic model, i.e., using the kernel vectors of the previous and next frames introduces collinearity. PLS is a regression method of modeling relationships between predictor matrix and response matrix . It is different from the standard multivariate linear regression in a way that it can cope with collinear data and in cases where the number of observations is less than the number of explanatory variables. PLS works similarly to principal component analysis (PCA), but in PCA, the principal components are determined by only whereas in PLS, both and are used for extracting the latent components. The aim of PLS is to extract components that capture most of the information in the variables that is also useful for predicting . To perform the regression task, PLS constructs new explanatory variables, called latent variables or components, where each component is a linear combination of . Then standard regression methods are used to determine the latent variables in . If the number of variables is set to the number of predictors, PLS becomes equivalent to the standard linear multivariate regression. Usually, the optimal number of latent variables is lower. The optimal number of latent variables can be chosen by cross-validation. There exist many variants for solving the PLS regression problem. We use the SIMPLS (simple partial least squares) algorithm proposed by de Jong [21] to find the regression matrix . The SIMPLS algorithm is computationally efficient and avoids the demanding computation of matrix inverses. In the Appendix, there is a brief description of the processing steps of the algorithm. Using kernel matrix as input for PLS was presented, e.g., in [20] where it was called as direct kernel PLS. Another alternative to combine kernels with PLS was proposed in [22], but the method requires the kernel matrix to be square. In this paper, we simply use the term kernel PLS (KPLS) to denote that kernel matrix is used as the input for the standard PLS algorithm as in [20]. Furthermore, if the dynamics are incorporated as explained in Section II-D, the term dynamic kernel PLS (DKPLS) is used. Tuning KPLS and DKPLS is straightforward: except for the selections made for the kernel, the only thing that needs to be chosen is the number of latent variables. The cross-validation procedure for determining the optimal number of latent variables designed for speech features is explained in the next section. F. Cross-Validation Using Speech Data The optimal number of latent components in PLS is usually chosen by cross-validation. In cross-validation, the training data is divided into training and validation sets. Based on how the validation data is predicted from the models built from the training data, we select the optimal number of PLS components.
809
When estimating the optimal number of latent components by cross-validation for speech features, one must note that the features are continuous in time. Random division can give too optimistic error estimates due to temporal continuity and result in a too large estimate of the number of latent components. It is easier to predict if and have been included in the training data. In order to obtain realistic error estimates and an optimal number of latent components, we suggest that the data should be divided in temporally consecutive training and validation sets. This means that for example in five-fold cross-validation, the first validation set consists of samples , and the next one of samples from , etc. If there is enough training data, we can also use sentence-wise division, say for training data of 20 sentences we first use sentences 1–2 as validation data and 3–20 as training data. In the next round sentences 3–4 serve as validation data and the models are trained from sentences 1–2 and 5–20, etc. The importance of cross-validation order is depicted in Section IV-C1. III. ANALYSIS/SYNTHESIS FRAMEWORK The analysis/synthesis framework plays an essential role in a voice conversion system. In this paper, speech parameterization and resynthesis was done using STRAIGHT analysis/synthesis framework [15]. STRAIGHT is widely used especially in HMM-based speech synthesis (e.g., [23]) but also in voice conversion (e.g., [9], [24]). Speech is decomposed into contour and spectrum with no periodic interferences from . To generate mixed excitations instead of being limited only to purely voiced and unvoiced signals, an aperiodicity index is estimated for each spectrum component. A. Spectral Envelope The spectral envelope was modeled using mel-cepstral coefficients (MCCs) [25] of order 24. Other possibilities for the spectral envelope parameterization include mel-frequency cepstral coefficients (MFCCs) (e.g., [6]), line spectral frequencies (LSFs) (e.g., [13], [26]). MCCs and LSFs have a favorable property that they can be easily transformed into filter coefficients and thus enable straightforward re-synthesis. In addition, MCCs are approximately independent from each other except for the zeroth and the first MCC that represent the energy and the tilt of the spectrum, respectively. We do not convert the energy term, but copy it directly from the source. B. Excitation and The accurate conversion of the residual is challenging since it includes detailed information about the speaker. Due to the complexity of a pure excitation, a parameterization of the residual is often used. The excitation can be formed using either impulses or white noise, the first one referring to a voiced excitation with a certain and the latter to an unvoiced excitation with no . Mixed excitations are formed as a combination of both aperiodic and periodic components. The weights of the components at each frequency can be estimated from the residual. In this paper, mixed excitation was employed similarly to HMM-
810
IEEE TRANSACTIONS ON AUDIO, SPEECH, AND LANGUAGE PROCESSING, VOL. 20, NO. 3, MARCH 2012
based speech synthesis [27]. Instead of the full aperiodicity map, the mean band aperiodicity (BAP) of the five frequency bands (0–1 kHz, 1–2 kHz, 2–4 kHz, 4–6 kHz, 6–8 kHz) [27] was used. In [24], the BAP values were converted with a separate GMM. Although the excitation and spectral envelope are assumed to be independent, this is not completely true in practise. Indeed, we propose to use both the source spectral envelope and BAP values to predict the target’s BAP values. Like spectral features, band aperiodicity values are continuous. A binary feature indicates whether the excitation of a frame is voiced (voicing value 1) or unvoiced (voicing value 0). In voice conversion, voicing decisions are typically copied directly from the source to the target, which can limit the conversion quality. An example of voicing prediction is the use of multispace probability distribution GMMs and HMMs [28], where spectral features were used together with . In this paper, we predict the target voicing decisions based on the source aperiodicity, spectrum, and voicing decision values using the proposed DKPLS approach. By voicing prediction we can prevent random voicing errors in the source speech from taking place in the converted speech as well as keep different speech features better in line with each other. can be transformed using mean-variance scaling or a more detailed modeling (e.g., [29], [30]). In this paper, was converted simply by transforming the mean and variance on a logbut arithmic scale. In cases where the source did not have the voicing prediction indicated the target frame to be voiced, was interpolated from the neighboring values. Speaking rate differences were not modeled in this work. IV. EXPERIMENTS Both objective and subjective results were carried out to evaluate the performance of the proposed method. A. Acoustic Data and Alignment The VOICES database [31] consisting of seven male and five female speakers uttering 50 parallel sentences was used for evaluation. The samples were downsampled to 16 kHz. We selected 16 inter-gender (eight female-to-male and eight male-to-female) and 16 intra-gender (eight male-to-male and eight female-to-female) conversion pairs from the database. The amount of training data was varied from one to 20 sentences. In the objective evaluations, the test data was always the same 20 sentences regardless of the number of training sentences. The results were averaged over the conversion pairs. For each speaker pair, the models were built based on the training data that were aligned using dynamic time warping. The initial alignment was obtained based on the original source and target MCC features. After the first alignment, we calculated an optimal PLS regression matrix with cross-validation and converted the source MCC features into target features using the regression matrix. The alignment was carried out again using the converted features in order to obtain more accurate alignment. Silent frames of the training data were discarded based
Fig. 3. Alignment of source and target frames and forming of kernel vectors for dynamic modeling.
on a heuristic energy threshold. The test data used in the objective evaluations went through a similar selection and alignment process. As a result of the alignment, each source frame is matched with exactly one target frame. If multiple source frames are matched with a certain target frame, only one of the pairs is included in the training data. An example of the alignment is illustrated in Fig. 3. The augmentation of adjacent frames is formed based on the source frames originally neighboring the current frame, i.e., it is not dependent on the selection of training data frames. B. Reference Methods and Settings Different methods were compared in mapping the features from source to target. In methods using PLS, the used input varies between the different models, whereas the output is always the original target data. The methods and their inputs are • DKPLS (proposed): A global PLS model built using the kernel transformed source data augmented with the kernel data from previous and next frames. • KPLS: As DKPLS, but without the data from previous and next frames. • PLS: A standard PLS model built using the original source data without the kernel transform. • DPLS: A standard PLS model with dynamics modeling based on augmenting the feature vector by features from adjacent frames. • GMM-PLS: Source feature vectors weighted by their posterior probabilities given by the GMM with diagonal covariance matrices as described in [8]. • GMM-DPLS. As GMM-PLS, but with dynamics modeling based on augmenting the feature vector by features from adjacent frames. • GMM-D: A joint density GMM conversion [7] with diagonal covariance matrices. • GMM-F: A joint density GMM conversion [7] with full covariance matrices. • MLGMM-D: A joint density GMM conversion with diagonal covariance matrices and maximum-likelihood parameter trajectory estimation [9]. For methods using GMM (GMM-PLS, GMM-DPLS, GMM-D, GMM-F, and MLGMM-D), the number of Gaussians must be chosen. Based on the minimum objective error given
HELANDER et al.: VOICE CONVERSION USING DKPLS REGRESSION
811
for the testing data, the number of Gaussians was chosen from . the set The cross-validation for determining the optimal number of latent PLS components was performed according to Section II-F in all of the experiments. The importance of cross-validation was examined in the spectral mapping case and the results are given in Section IV-C1. In spectral mapping, only MCCs from the source were used in predicting the target MCCs, without the energy term. In DKPLS in (2) was set to 10 based on and KPLS, the scaling term initial experiments but as mentioned in Section II-B, the selection of the term is not very sensitive. In aperiodicity mapping, the mapping was tested with two alternative prediction parameter configurations: 1) the source BAP values only, or 2) both source MCCs and BAP values. When DKPLS was used in Case 2, the kernel matrices from both aperiodicity and MCCs were built separately since the scaling between different parameters proved to be difficult. The input vector in this case is given in 7 presented later in this section. In the voicing value experiments, three alternatives were evaluated: 1) copying the voicing decision directly from the source, or predicting the voicing decision using source MCCs, BAP and voicing values either with 2) PLS, or 3) DKPLS. In DKPLS, the same settings for the scaling parameter were used as in the aperiodicity case for MCCs and aperiodicity. The binary voicing value from the source was used without kernel transformation. The DKPLS case is given in 7 presented later in this section. Samples for the listening test and objective speaker identity recognition were generated with three different systems • Baseline: MCCs are mapped with MLGMM-D, aperiodicity with GMM-F and voicing values are copied from the source. MLGMM-D was chosen as a spectral conversion method since it can be considered as a well-established benchmark that has already solved some of the problems (e.g., time-independency problem) introduced in the original GMM-based voice conversion. • Proposed—spectral only: MCCs mapped with DKPLS but aperiodicity and voicing as with Baseline. • Proposed: All features mapped with DKPLS, aperiodicity predicted from source MCCs and BAP values, and voicing predicted from source MCCs, BAP and voicing values. for different For the Proposed system, the inputs vectors features are
(7)
where and denote the centered kernel vectors for the spectral and aperiodicity features of source vector , respecis the binary source voicing value (either 0 or 1). tively, and
Fig. 4. Spectral distortion as a function of number of latent components based on the proposed and random cross-validation scheme as well as with the unseen test data.
As in the objective experiments, we set the scaling term in (2) as 10 and 30 for MCCs and BAP values, respectively. The samples produced by all three systems were mildly post(see [25] for detailed description on postfilfiltered tering) and the samples were scaled to the same playback level. C. Objective Results on Spectral Mapping The mel-cepstral distortion for frame between the converted target and the original target was calculated as
dB
(8)
is the original target and is the converted target of where the th MCC in frame . The distortion was averaged over all the frames. 1) The Effect of Cross-Validation Order: We conducted an experiment to illustrate the effect of cross-validation data division as discussed in Section II-F. The results were obtained from applying DKPLS for spectral mapping in a randomly chosen female-to-male conversion case with ten training sentences and the number of reference vectors was set to 400. The maximum possible number of latent components is thus 1200, since DKPLS uses also previous and next frame kernel vectors. We compared two cases: 1) the training data is divided randomly using ten-fold cross-validation, and 2) the training data is divided as proposed in Section II-F. Fig. 4 shows the cross-validation error as a function of the number of latent components for the first 300 components for the random cross-validation (dash-dotted line) and the proposed cross-validation (solid line). In addition, the performance on the 20-sentence testing data is shown with dashed line. According to the proposed cross-validation scheme, the optimal number of latent components is 35. Random cross-validation indicates the optimal number of latent components to
812
IEEE TRANSACTIONS ON AUDIO, SPEECH, AND LANGUAGE PROCESSING, VOL. 20, NO. 3, MARCH 2012
Fig. 5. Average spectral distortion as a function of number of reference vectors with 2, 5, 10, and 20 training sentences. TABLE I AVERAGE SPECTRAL DISTORTION FROM 32 CONVERSION PAIRS USING 20 TRAINING SENTENCES. METHODS ARE DESCRIBED IN SECTION IV-B
be 220. For the unseen 20-sentence testing data, the errors were 5.40 dB and 5.57 dB with 35 and 220 components, respectively. It can be seen that the proposed cross-validation scheme gives realistic estimates for the error and the optimal number of latent components for the test data. In contrast, the random cross-validation gives overly optimistic error values and proposes too high amount of components to be optimal. The rest of the experiments employ the proposed cross-validation scheme. 2) Number of Reference Vectors: We evaluated the effect of the number of reference vectors when using DKPLS. We picked one speaker pair from each conversion category (female-to-male, male-to-female, female-to-female, male-to-male) and calculated the spectral distortion by varying the number of reference vectors between 5 and 300. The results were calculated using a different amount of training sentences and averaged between speaker pairs. Fig. 5 shows how the number of reference vectors affect the spectral distortion with 2, 5, 10, and 20 training sentences. With two sentences the spectral distortion is not decreased after 20–30 reference vectors whereas with 20 training sentences about 100–200 reference vectors are enough. Setting the number of reference vectors too high does not degrade the performance due to the use of PLS regression with cross-validation, but memory and computational requirements become higher. In the rest of the experiments, we set the number of reference vectors to 200 regardless of the amount of the training data.
Fig. 6. Average spectral distortion in 32 conversion cases as a function of number of training sentences.
3) Conversion Methods: The performance of DKPLS was evaluated against other methods described in Section IV-B with training data of 20 sentences. For each conversion category (female-to-male, male-to-female, female-to-female, male-to-male), the results were averaged from eight conversion pairs (32 pairs in total). The results are given in Table I with optimal settings made for the GMM-based methods. As it can be seen, the proposed method DKPLS obtains the lowest spectral distortion value of all the methods. Although the errors were calculated on a frame-by-frame basis, it can be concluded that the use of neighboring frame information is beneficial. This applies also when comparing PLS to DPLS and GMM-PLS to GMM-DPLS. As expected, the use of global linear regression on original source data without or with dynamics is not en ought to fully exploit the 20-sentence training data, since all other methods outperformed PLS and DPLS. The results in Table I are consistent with the results given in [9] and [8]: ML-GMM and PLS-GMM gave better performance than GMM-D. In addition, we compared DKPLS to a few methods (PLS, KPLS and MLGMM-D) when the amount training data was varied between 1 and 20 sentences. The results are shown in Fig. 6. With 10 sentences DKPLS obtained the same performance as MLGMM-D with 20 sentences. The difference between DKPLS and KPLS is slightly increased when the amount of training data is increased, indicating a more efficient use of neighboring information when there is more data. D. Objective Results on Aperiodicity Mapping The root mean squared error (RMSE) values for BAP mapping from a 20-sentence training data set are shown in Table II. The results are averaged from 32 speaker pairs. All the included mapping methods outperformed direct copying (no conversion), leading to lower RMSE value on every frequency band. The optimal number of Gaussians for GMM-F and MLGMM-D was 8 and 64, respectively. The use of kernels and dynamic modeling (DKPLS) combined with the use of MCCs was able to provide the lowest RMSE values on every frequency band. The role of MCCs is
HELANDER et al.: VOICE CONVERSION USING DKPLS REGRESSION
813
TABLE II RMSE ERRORS FOR APERIODICITY MAPPING USING 20 TRAINING SENTENCES
Fig. 8. Percentage of the converted speech sentence to be recognized as the desired target speaker when recognizing the speaker either only using the source and the target model or using all 12 speaker models. The results are shown as a number of Gaussians used in the models.
female as the target speaker. There was not necessarily that much useful information in the male speaker’s MCCs and BAP values for predicting the voicing value of the female speaker as vice versa. F. Identity Evaluation Using a Speaker Recognition System
Fig. 7. Percentage of voicing errors when copying the source voicings or predicting them with PLS or DKPLS as a function of number of training sentences.
more important than that of the kernels, since for example the use of MCCs with DPLS resulted in a lower error than DKPLS without MCCs. The improvement over the method chosen for the Baseline (GMM-F) is more visible in low-frequency bands since high-frequency bands contain more noise and are likely to be less correlated with MCCs. In summary, the results indicate that the use of BAP and MCC kernels combined with dynamic modeling improves the BAP mapping performance. E. Objective Results on Voicing Value Mapping Fig. 7 shows the percentage of voicing errors averaged from all 32 speaker pairs. The voicing decisions are either copied from the source to the target or predicted using PLS or DKPLS. It can be seen that the percentage of voicing errors can be decreased by prediction especially when the amount of training data is increased. The results in Fig. 7 are averaged over speaker pairs, but there were differences between individual pairs when using prediction. The average improvement with 20 training sentences was 19% compared to direct copying, but the best improvements were 16%, 41%, 32%, and 48% in male-to-female, female-to-male, male-to-male and female-to-female conversion, respectively. The improvements are not necessarily similar when the source and the speaker are interchanged. For example a female-to-male conversion pair that produced the best improvement (41%), obtained an improvement of only 9% when the male was changed as the source speaker and the
We implemented a simple speaker recognition system to test how the converted sample was objectively recogwas built for each nized. A Gaussian mixture model speaker in the VOICES database. The number of Gaussians was varied and the covariance matrices were diagonal. MFCCs and their first-order deltas excluding the first MFCC that describes energy were used as features. The features were extracted from the converted samples generated by the analysis/synthesis framework. 20 sentences were used for training the model for each speaker. Silences at the beginning and end of each utterance were discarded, and no universal background model was employed. For each 32 conversion pairs, MFCCs and their deltas from 20 converted testing sentences were extracted and speaker identity was recognized using the two systems: the Proposed and the Baseline system (see Section IV-B for detailed description and settings). The number of training sentences for conversion was 20. A procedure for identification is described in [32]: a test sentence is identified to be spoken by the speaker whose model produces the highest sum of frame-wise log-likelihoods. The speaker identity in the converted samples was recognized either using 1) only the source and the target models, or 2) all 12 speaker models. For both cases the recognition results with different amount of Gaussians are shown in Fig. 8 for the Baseline system and the Proposed system. The results are averaged from ten trials since the random initialization of the GMMs may affect the performance. As can be seen, the proposed system succeeds very well in convincing the identification system that the sample comes from the desired target speaker. Note that the identification system considers only spectral features and not the excitation and thus, according to our experiments, the conversion of aperiodicity and voicing with different systems did not make much difference on identification performance. The Baseline system performs also well but slightly worse than the Proposed system. The use of speaker recognition systems for measuring the performance of a voice conversion system have been reported
814
IEEE TRANSACTIONS ON AUDIO, SPEECH, AND LANGUAGE PROCESSING, VOL. 20, NO. 3, MARCH 2012
TABLE III VALUES FOR THE CONVERTED SENTENCES FROM ALL AVERAGE 32 SPEAKER PAIRS AND SPECIFIED INTO INTER- AND INTRA-GENDER CONVERSION PAIRS AS WELL AS FOR MALE-TO-MALE (M M) AND FEMALE-TO-FEMALE (F F) TRANSFORMATIONS
in [33], [33], and [4]. In [33], only two male and two female speakers were used and still sometimes male speakers were confused by the recognition system which was reported to possibly result from not converting the unvoiced segments. Our conversion system can be considered very successful since recognizing the desired target speaker out of 12 speakers resulted in 99.3% recognition rate with 64 or 128 Gaussians. Using source and target models only, the recognition rate was over 99.9%. In addition to binary recognition rate, we calculated the ratio between the likelihoods given by the source and target model similarly to [4] (9) where and are conditional probabilities of and target converted speech sequence for source model , respectively. model in (9) indicates a successful identity converA positive sion; the higher the value, the better the converted speech is from 32 sentence identified as the desired target. Averages of pairs and 20 testing sentences are shown in Table III. The figure also shows separate results for the inter- and intra-gender cases. Intra-gender cases are further separated into female-to-female and male-to-male transformations. As can be seen, the values with the proposed system are higher than with the baseline indicating a better conversion result. As expected, the ratio is higher in inter-gender case since the differences between the original source and target are likely to be larger. Table III indicates that the male source and target speakers are on average is higher much more similar than females since the average on the original source and lower on the converted source. G. Subjective Results In this section, the proposed DKPLS method is evaluated against a baseline approach in terms of subjective quality. The subjective quality is tested using a mean opinion score test. In addition, the identity conversion performance of the proposed system is evaluated using an XAB test. The training data was 20 sentences. The number of listeners in both tests was 18. 1) Mean Opinion Score Test on Quality: A mean opinion score (MOS) test was conducted in order to see if the differences were significant with different systems. We compared three approaches (Baseline, Proposed—spectral only, and Proposed) that are explained in Section IV-B. Two conversion pairs from each category (male-to-male, male-to-female, female-to-male, female-to-female) were randomly chosen resulting in eight different conversion pairs. Eight sentences were randomly selected from a set of 20
Fig. 9. Mean opinion scores with 95% confidence intervals obtained from eight conversion pairs for the proposed system with two variations and the baseline system.
testing sentences for each speaker pair. Each listener rated the quality of 192 samples that consisted of 64 samples from each of the three approaches and from eight different speaker pairs and eight different testing sentences. The samples from different systems and different conversion pairs were presented in random order. The rating scale was a standard MOS scale bad poor fair good excellent . The average of each three systems is shown in Fig. 9 with 95% confidence intervals. As can be seen, the proposed system is rated the highest. The spectral features clearly play an important role, since there was a major difference between the Proposed—spectral only and the Baseline system. However, further improvements are achieved with better aperiodicity and voicing mapping and the differences between the Proposed and the Proposed—spectral only system are statistically significant. Details for the scores obtained for each speaker pair are shown in Fig. 10(a) and (b). It can be seen that in all the cases, the Proposed and the Proposed—spectral only system clearly outperform the baseline system. With some of the speaker pairs, there is no statistically significant improvement between the Proposed and the Proposed—spectral only system. However, for some conversion pairs statistically significant improvement was obtained and for all speakers, the MOS average for the Proposed was always higher or at least the same. 2) Identity Test: The subjective identity conversion performance of the proposed system was evaluated using an XAB test. Listeners were asked whether a speaker in sample X sounded more like the speaker in sample A or B consisting of analyzed and synthesized source or target speech. All the samples X, A, and B included the same sentence. Prosodic differences were not obvious since the VOICES database includes sentences where speakers try to mimic a certain speaker. According to an initial listening experiment, all inter-gender transformations were recognized correctly and thus we evaluated only intra-gender conversion pairs. Samples from all 32 conversion pairs can be found in http://www.cs.tut.fi/sgn/arg/ IEEE_DKPLS/dkpls.html. In a listening test, three sentences from each 16 intra-gender conversion pairs were randomly chosen and the listeners selected the identity in 48 samples. The playing order of the samples was randomized. The recognition results are shown in Fig. 11 for all pairs and also specified into male-to-male and female-to-female transformations. The recognition rate for males was much lower than that for females.
HELANDER et al.: VOICE CONVERSION USING DKPLS REGRESSION
815
Fig. 12. Detailed recognition results of the desired target for each speaker pair in XAB test.
V. DISCUSSION
Fig. 10. Mean opinion scores with 95% confidence intervals obtained from denote for the female and male, respeceach speaker pair. The letters and tively, and the numbers after the letters identify the conversion pair.
Fig. 11. Average recognition rates of the desired target speaker in XAB test with 95% confidence intervals obtained from 16 intra-gender conversion pairs.
Conversion-pair specific results are displayed in Fig. 12. It can be seen that for one male-to-male pair, the conversion was not successful (identification rate about 24%). Also for another pair, the recognition rate is close to 50%. The speaker identification results using a speaker recognition system in IV-F, however, did not imply this. Sometimes the source and the target speakers sound close to each other and recognizing them without any conversion would also be difficult for the listeners as was indicated in [9]. In this test, we used the same sentence for X. This may result in choosing the sample with slightly similar prosody if the speaker individualities in A or B are difficult to distinguish. The subjective identity results are in line with the likelihood ratios obtained in Section IV-F; distinguishing between the males in the database proved to be more difficult than with the females.
The conventional GMM-based methods estimate the linear transform for each Gaussian. The proposed approach provides a framework for nonlinear feature transformation which allows taking advantage of the global properties of the data. In previous works [5], [6] GMM-based methods have been used to create long feature vectors where source feature vectors are weighted by the posterior probability of each Gaussian. The weighting by posterior distributions introduced nonlinearity to the features that is dependent on their location in the feature space. This allows globally nonlinear transforms which are still locally linear. The length of the feature vector becomes multiplied by the number of Gaussians, so overfitting to the training data becomes a serious problem in this approach. In our previous work [5] we applied PLS on the feature representation produced by the GMM model in order to overcome the overtraining issue. The DKPLS proposed in this paper allows nonlinear transforms even locally, which may be one of the reasons why the method produces better results than the previous GMM-PLS method. Nevertheless, the GMM-PLS method can also be improved by taking dynamics into account as depicted in Table I (GMM-DPLS) which is likely to improve the subjective quality as well.
VI. CONCLUSION We have proposed a voice conversion system that converts spectral, aperiodicity and voicing features using dynamic kernel partial least squares regression. The main benefits of the method are the capability for modeling nonlinearities and dynamics. The computational complexity can be controlled using a rather low amount of reference vectors in the kernel matrix. The DKPLS method is easy to implement and requires very little tuning. We have also proposed a cross-validation scheme for PLS regression when predicting speech features. Extensive conversion experiments using a variety of speaker pairs have been conducted. The proposed system outperformed
816
IEEE TRANSACTIONS ON AUDIO, SPEECH, AND LANGUAGE PROCESSING, VOL. 20, NO. 3, MARCH 2012
the reference system in terms of subjective and objective measures. When using the proposed system only for spectral features, MOS of 3.28 was obtained whereas the MOS for the reference system was 2.22. In addition to major improvements in spectral mapping, it was shown that modeling the aperiodicity and voicing in line with spectral features improves the subjective quality by increasing the MOS even further (3.51). Listeners were able to distinguish between the source and the target in 77% of the intra-gender conversion cases. A speaker recognition system was able to recognize about 99.3% of the desired target speaker out of 12 speakers with 32 different conversion pairs.
APPENDIX SOLVING THE PLS REGRESSION PROBLEM WITH SIMPLS ALGORITHM SIMPLS [21] algorithm estimates the regression matrix the regression model
in
(10) while restricting the range of the transform matrix. Observation matrix and target matrix are the inputs of the algorithm. In each iteration , the algorithm estimates score vector that explains most of the cross-covariance between and . The th entry in vector corresponds to a coefficient in the latent variable vector . The loading vectors and are stored in matrices and , each row of the matrices consisting of the loading vector of the corresponding iteration. After each iteration, the contribution of the estimated PLS component is subtracted from the cross-covariance matrix . For details of the algorithm, see [21]. 1) Initialize , and to empty matrices. 2) Calculate the cross-covariance matrix between and as . 3) Calculate the eigenvector corresponding to the largest eigenvalue of . 4) Set and . 5) Subtract the mean of its entries from . 6) Normalize and by and . 7) Set , and . 8) Set . 9) If iteration count then orthogonalize the terms by and . 10) Normalize as . 11) Set . 12) Assign and as the th columns of matrices and , respectively. The processing steps 2–12 are repeated for iterations up to the number of PLS components. The regression matrix is obtained as .
REFERENCES [1] M. Abe, S. Nakamura, K. Shikano, and H. Kuwabara, “Voice conversion through vector quantization,” in Proc. IEEE Int. Conf. Acoust., Speech, Signal Processing, New York, Apr. 1988, pp. 565–568. [2] S. Desai, A. Black, B. Yegnanarayana, and K. Prahallad, “Spectral mapping using artificial neural networks for voice conversion,” IEEE Trans. Audio, Speech, Lang. Process., vol. 18, no. 5, pp. 954–964, Jul. 2010. [3] H. Valbret, E. Moulines, and J. Tubach, “Voice transformation using PSOLA technique,” in Proc. IEEE Int. Conf. Acoust., Speech, Signal Processing, Mar. 1992, vol. 1, pp. 145–148. [4] L. Arslan, “Speaker transformation algorithm using segmental codebooks (STASC),” Speech Commun., vol. 28, no. 3, pp. 211–226, Jun. 1999. [5] E. Helander, H. Silen, J. Miguez, and M. Gabbouj, “Maximum a posteriori voice conversion using sequential Monte Carlo methods,” in Proc. Interspeech, Sep. 2010, pp. 1716–1719. [6] Y. Stylianou, O. Cappe, and E. Moulines, “Continuous probabilistic transform for voice conversion,” IEEE Trans. Speech Audio Process., vol. 6, no. 2, pp. 131–142, Mar. 1998. [7] A. Kain and M. W. Macon, “Spectral voice conversion for text-tospeech synthesis,” in Proc. IEEE Int. Conf. Acoust., Speech, Signal Process., Seattle, WA, May 1998, vol. 1, pp. 285–288. [8] E. Helander, T. Virtanen, J. Nurminen, and M. Gabbouj, “Voice conversion using partial least squares regression,” IEEE Trans. Audio, Speech, Lang. Process., vol. 18, no. 5, pp. 912–921, Jul. 2010. [9] T. Toda, A. Black, and K. Tokuda, “Voice conversion based on maximum-likelihood estimation of spectral parameter trajectory,” IEEE Trans. Audio, Speech, Lang. Process., vol. 15, no. 8, pp. 2222–2235, Nov. 2007. [10] K. Tokuda, H. Zen, and A. W. Black, “An HMM-based speech synthesis system applied to English,” in Proc. IEEE Workshop Speech Synth., Sep. 2002, pp. 227–230. [11] T. Toda, Y. Ohtani, and K. Shikano, “One-to-many and many-to-one voice conversion based on eigenvoices,” in Proc. IEEE Int. Conf. Acoust., Speech, Signal Process., Apr. 2007, vol. 4, pp. IV-1249–IV-1252. [12] Y. Chen, M. Chu, E. Chang, J. Liu, and R. Liu, “Voice conversion with smoothed GMM and MAP adaptation,” in Proc. Eurospeech, 2003, pp. 2413–2416. [13] D. Erro, A. Moreno, and A. Bonafonte, “Voice conversion based on weighted frequency warping,” IEEE Trans. Audio, Speech, Lang. Process., vol. 18, no. 5, pp. 922–931, Jul. 2010. [14] M. J. Embrechts and B. Szymanski, Computationally Intelligent Hybrid Systems. New York: Wiley, 2005, ch. Introduction to Scientific Data Mining: Direct Kernel Methods & Applications, pp. 317–365. [15] H. Kawahara, I. Masuda-Katsuse, and A. de Cheveigné, “Restructuring speech representations using a pitch-adaptive time-frequency smoothing and a instantaneous-frequency-based F0 extraction: Possible role of a repetitive structure in sounds,” Speech Commun., vol. 27, no. 3–4, pp. 187–207, Apr. 1999. [16] J. Yamagishi, B. Usabaev, S. King, O. Watts, J. Dines, J. Tian, Y. Guan, R. Hu, K. Oura, Y.-J. Wu, K. Tokuda, R. Karhila, and M. Kurimo, “Thousands of voices for HMM-based speech synthesis—Analysis and application of TTS systems built on various ASR corpora,” IEEE Trans. Audio, Speech, Lang. Process., vol. 18, no. 5, pp. 984–1004, Jul. 2010. [17] L. Rabiner and B.-H. Juang, Fundamentals of Speech Recognition. Upper Saddle River, NJ: Prentice-Hall, 1993. [18] F. Camastra and A. Verri, “A novel kernel method for clustering,” IEEE Trans. Pattern Anal. Mach. Intell., vol. 27, no. 5, pp. 801–804, May 2005. [19] B. Schölkopf, A. J. Smola, and K.-R. Müller, “Nonlinear component analysis as a kernel eigenvalue problem,” Neural Comput., vol. 10, no. 5, pp. 1299–1319, 1998. [20] K. P. Bennett and M. J. Embrechts, Advances in Learning Theory: Methods, Models and Applications, ser. NATO Science Series. Series III: Computer and Systems Sciences. Amsterdam, The Netherlands: IOS Press, 2003, vol. 190, ch. An Optimization Perspective on Kernel Partial Least Squares Regression, pp. 227–250. [21] S. de Jong, “SIMPLS: An alternative approach to partial least squares regression,” Chemometrics Intell. Lab. Syst., vol. 18, no. 3, pp. 251–263, Mar. 1993. [22] R. Rosipal and L. Trejo, “Kernel partial least squares regression in reproducing kernel Hilbert space,” J. Mach. Learn. Res., vol. 2, pp. 97–123, Dec. 2001.
HELANDER et al.: VOICE CONVERSION USING DKPLS REGRESSION
[23] H. Zen, T. Toda, M. Nakamura, and K. Tokuda, “Details of the Nitech HMM-based speech synthesis system for the Blizzard challenge 2005,” IEICE Trans. Inf. Syst., vol. E90-D, no. 1, pp. 325–333, Jan. 2007. [24] Y. Ohtani, T. Toda, H. Saruwatari, and K. Shikano, “Maximum likelihood voice conversion based on GMM with STRAIGHT mixed excitation,” in Proc. Interspeech, 2006, pp. 2266–2269. [25] K. Koishida, K. Tokuda, T. Kobayashi, and S. Imai, “CELP coding based on mel-cepstral analysis,” in Proc. IEEE Int. Conf. Acoust., Speech, Signal Process., May 1995, vol. 1, pp. 33–36. [26] O. Turk and L. Arslan, “Robust processing techniques for voice conversion,” Comput. Speech Lang., vol. 4, no. 20, pp. 441–467, Oct. 2006. [27] T. Yoshimura, K. Tokuda, T. Masuko, T. Kobayashi, and T. Kitamura, “Mixed excitation for HMM-based speech synthesis,” in Proc. Eurospeech, 2001, pp. 2263–2266. [28] K. Yutani, Y. Uto, Y. Nankaku, A. Lee, and K. Tokuda, “Voice conversion based on simultaneous modeling of spectrum and F0,” in Proc. IEEE Int. Conf. Acoust., Speech, Signal Process., May 2009, pp. 3897–3900. [29] E. Helander and J. Nurminen, “A novel method for prosody prediction in voice conversion,” in Proc. IEEE Int. Conf. Acoust., Speech, Signal Process., Apr. 2007, vol. 4, pp. IV-509–IV-512. [30] D. Chapell and J. Hansen, “Speaker-specific pitch contour modelling and modification,” in Proc. IEEE Int. Conf. Acoust., Speech, Signal Process., Seattle, WA, May 1998, pp. 885–888. [31] A. Kain, “CLSU: Voices,” in Linguistic Data Consortium, Philadelphia, PA, 2006. [32] D. Reynolds and R. Rose, “Robust text-independent speaker identification using Gaussian mixture speaker models,” IEEE Trans. Speech Audio Process., vol. 3, no. 1, pp. 72–83, Jan. 1995. [33] M. Farrus, M. Wagner, D. Erro, and J. Hernando, “Automatic speaker recognition as a measurement of voice imitation and conversion,” Int. J. Speech Lang. Law, vol. 17, no. 1, 2010. Elina Helander received the M.S. degree in information technology from the Tampere University of Technology (TUT), Tampere, Finland, in 2004. She is currently working towards the Ph.D. degree at TUT. She is currently a Researcher in the Department of Signal Processing, TUT. Her research interests include voice conversion and modification, prosody modeling, and speech synthesis.
Hanna Silén received the M.S. degree in electrical engineering from Tampere University of Technology (TUT), Tampere, Finland, in 2007. She is currently working towards the Ph.D. degree at TUT. She is currently a Researcher in the Department of Signal Processing, TUT. Her research interests include speech synthesis and voice conversion.
817
Tuomas Virtanen (M’07) received the M.Sc. and Doctor of Science degrees in information technology from the Tampere University of Technology (TUT), Tampere, Finland, in 2001 and 2006, respectively. He is currently working as a Research Fellow and Adjunct Professor in the Department of Signal Processing, TUT. He has also been working as a Research Associate in the Cambridge University Engineering Department, Cambridge, U.K. His research interests include content analysis of audio signals, sound source separation, noise-robust automatic speech recognition, and machine learning.
Moncef Gabbouj (M’91–SM’95–F’11) received the B.S. degree in electrical engineering from Oklahoma State University, Stillwater, in 1985 and the M.S. and Ph.D. degrees in electrical engineering from Purdue University, West Lafayette, IN, in 1986 and 1989, respectively. He is currently an Academy Professor and Professor at the Department of Signal Processing, Tampere University of Technology (TUT), Tampere, Finland. He was Head of the Department from 2002 to 2007. He was on sabbatical leave at the American University of Sharjah, UAE, in 2007–2008. He was a Senior Research Fellow of the Academy of Finland during 2007–2008 and 1997–1998. In 2007–2008, he was Visiting Professor at the American University of Sharjah, UAE. He is the cofounder and past CEO of SuviSoft Oy, Ltd. His research interests include multimedia content-based analysis, indexing, and retrieval; nonlinear signal and image processing and analysis; and video processing, coding, and communications. Dr. Gabbouj is a Honorary Guest Professor of Jilin University, China (2005–2010). He served as Distinguished Lecturer for the IEEE Circuits and Systems Society in 2004–2005, and Past-Chairman of the IEEE-EURASIP NSIP (Nonlinear Signal and Image Processing) Board. He was chairman of the Algorithm Group of the EC COST 211quat. He served as associate editor of the IEEE TRANSACTIONS ON IMAGE PROCESSING and was guest editor of Multimedia Tools and Applications, the European journal Applied Signal Processing. He is the past chairman of the IEEE Finland Section, the IEEE Circuits and Systems Society, Technical Committee on Digital Signal Processing, and the IEEE SP/CAS Finland Chapter. He was also Chairman of CBMI 2005, WIAMIS 2001 and the TPC Chair of ISCCSP 2006 and 2004, CBMI 2003, EUSIPCO 2000, NORSIG 1996 and the DSP track chair of the 1996 IEEE ISCAS. He is also member of EURASIP Advisory Board and past member of AdCom. He also served as Publication Chair and Publicity Chair of IEEE ICIP 2005 and IEEE ICASSP 2006, respectively. He was the recipient of the 2005 Nokia Foundation Recognition Award and corecipient of the Myril B. Reed Best Paper Award from the 32nd Midwest Symposium on Circuits and Systems and corecipient of the NORSIG 94 Best Paper Award from the 1994 Nordic Signal Processing Symposium. He is coauthor of over 400 publications.