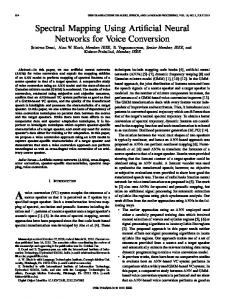
Voice Conversion Using K-Histograms and Residual Averaging A. J. Uriz†
P. D. Ag¨ uero‡
J. C. Tulli‡ J. Casti˜ neira† A. Bonafonte§
E. L. Gonz´alez‡
†CONICET - Facultad de Ingenier´ıa, Universidad Nacional de Mar del Plata, Mar del Plata, Argentina
[email protected] ‡Facultad de Ingenier´ıa, Universidad Nacional de Mar del Plata, Mar del Plata, Argentina
[email protected] §Universitat Polyt`ecnica de Catalunya, Barcelona, Espa˜ na
Abstract— The main goal of a voice conversion system is to modify the voice of a source speaker, in order to be perceived as if it had been uttered by another specific speaker. Many approaches found in the literature convert only the features related to the vocal tract of the speaker. Our proposal is to not only convert those characteristics of the vocal tract, but also to process the signal passing through the vocal chords. Thus, the goal of this work is to obtain better scores in the voice conversion results. Keywords— Voice Histograms, Residual Synthesis.
Conversion, Conversion,
KVoice
1. INTRODUCTION The primary goal of voice conversion systems is to modify the voice of a source speaker, in order to be perceived as if it had been uttered by another specific speaker: the target speaker. For this purpose, relevant features of the source speaker are identified and replaced by the corresponding features of the target speaker. There are two groups of voice conversion systems, which are divided depending on the features of the speech (of the source-filter model) converted in each case. The first group involves the systems that only convert the features related to the vocal tract [7] of the speaker. In the second group, there are systems that besides mapping the speaker vocal tract, also convert the residual signal [7] of the phonation. Several voice conversion techniques have been proposed since the problem was first formulated in 1988. In this year, Abe et al. [1] proposed to convert voices through mapping codebooks created from a parallel training corpus. Since then, many authors tried to avoid spectral discontinuities caused by the hard partition of the acoustic space, by means of fuzzy classification or frequency axis warping functions. The introduction of statistical methods based on gaussian
mixture models (GMM) for spectral envelope transformation was an important breakthrough in voice conversion [8, 11]. In these approaches, the acoustic space of speakers is partitioned into overlapping classes and the weighted contribution of all classes is considered when transforming acoustic vectors. As a result, the spectral envelopes are successfully converted without discontinuities, but as a downside, the quality of the converted speech was degraded by over-smoothing. The most recent approaches use non-numerical[5, 6] clustering techniques to make the conversion. An example of these systems is Uriz et al. [15], who uses a cluster based on k-histograms (KH): a non-numerical cluster algorithm presented by He in [6]. These systems have a better performance, with no conditions about a specific distribution for the data. Thus, the cluster is adjusted to the data distribution. Nevertheless, the problem of creating high-quality voice conversion systems that could be used in reallife applications has not been completely solved. At present, there still is a trade off between the similarity of converted voices to target voices, and the quality achieved by the different conversion methods. The best way to improve this trade off is to not only convert the vocal tract features of the speaker, but also to convert the residual signal of the phonation. This problem was further faced in other works [2, 13], while the usage of GMM-based techniques became almost standard, up to the point that the research was focused on increasing the resolution of GMM-based systems through residual prediction [3, 4, 12] in order to improve both the quality scores and the converted-totarget similarity. In this paper, a system that works by using an approach that combines clustering by means of KHistograms is proposed to convert the vocal tract features, and an averaging of residual signal obtained from a pre-recorded dataset. This is made in order to improve both the quality scores and the convertedto-target similarity. This paper is organized as follows. In Section 2. , the most important aspects of the voice conversion tech-
niques used in the work are explained in detail. In Section 3. , a new voice conversion method is proposed. In Section 4. , the results of the objective and subjective tests are presented and discussed. Finally, the main conclusions are summarized in Section 5. . 2. VOICE CONVERSION The goal of voice conversion systems is to convert the voice of a source speaker, so it is perceived as being pronounced by another specific speaker: the target speaker. The next subsections describe the most important aspects of the voice conversion systems. 2. 1. Source-Filter Model The source-filter model [7] is a representation of the phonatory system that models it as a filter being excited by a source signal. The filter that represents the vocal tract of the speaker is modeled by using a series of coaxial tubes. This is made by using an n degree polynomial, where n is the number of tubes used in the model. On the other hand, the source of the system is the air flow that comes from the lungs and pass through the vocal cords. A diagram of the system is presented in Fig.1.
Figure 1: Inverse source-filter model. The next subsections describe the techniques used in this work to convert the parts represented in the vocal tract model. 2. 2. Vocal Tract Conversion LSF conversion using k-histograms In the most popular voice conversion systems pairs of source-target LSF vectors[7] are modeled using an approach of Gaussian Mixture Models (GMM)[11, 8]. In some cases, the initialization of the parameters of the model is done applying the k-means clustering algorithm. In this work, quantized LSF coefficients are clustered using k-histograms and source parameters are transformed into target parameters through a nongaussian approach via the cummulative density function (CDF). The k-means algorithm is one of the most widely used clustering algorithms. Given a set of numeric objects Xi ∈ D and an integer number k, the k-means algorithm searches for a partition of D into k clusters that minimizes the within groups sum of squared errors (WGSS). This process can be formulated as the minimization of the function P (W, Q) with respect to W and Q, as shown in equations 1 and 2.
MinimizeP (W, Q) =
k X n X l=1 i=i
wi,l d(Xi , Ql )
(1)
Subject to
k X
wi,l = 1, 1 ≤ i ≤ n
(2)
l=1
wi,l ∈ {0, 1}, 1 ≤ i ≤ n, 1 ≤ l ≤ k where W is an n × k partition matrix which assigns each vector Xi to one cluster. Q = {Q1 , Q2 , ..., Qk } is a set of objects in the same object domain (usually known as centroids of the clusters), and d(·, ·) is the definition of distance between vectors. Clustering using k-histograms K-histograms are an interesting approach to cluster categorical data. Each cluster is represented by the histograms of the elements of that cluster. Assuming that each element Xi is a vector of m categorical values xi,1 ...xi,m , Equation 1 can be adapted to categorical data defining a distance based on the histograms of the cluster, as shown in equation 3.
MinimizeP (W, H) =
k X n X
wi,l d(Xi , Hl )
(3)
l=1 i=i
where wi,l is the partition matrix. The distance d compares the histograms of the cluster of each element. The clustering algorithm is explained in detail by He et al [6]. In this paper, k-histograms are used to partition into sets the vectors of features (LSF parameters) utilized in voice conversion. The LSF parameters are discretized to estimate the counts in the histograms of each set. The source and target LSF vectors are aligned in the training set, and they are jointly partitioned using k-histograms. Then, when estimating by using histograms we make no assumptions about a particular distribution of the parameters. The conversion between source and target parameters using histograms is performed applying a nongaussian to non-gaussian mapping via the cumulative distribution function (CDF) coefficient by coefficient, as shown in Eq. 4. [Fxj (xi )] yˆi = Fy−1 j
(4)
The LSF parameter xi of the source speaker is mapped into the target LSF parameter yˆi using the CDF of source and target ith LSF parameter and j th set (Fxj and Fyj respectively). The different available sets are obtained using the partition of the LSF parameter space via the k-histograms clustering technique. The decision about the set j used in the transformation of a given source feature vector x is performed calculating the joint probability of each component of the vector (of dimension K) for each possible set (Equation 5). pj =
K X i
log(fxj (xi ))
(5)
where fxj is the probability that the coefficient xi belongs to set j. The vector belongs to the set j with the highest probability pj . The parameters estimated by means of Equation 4 are used to perform the synthesis of the target speech. In the next subsection, the proposed conversion method will be explained based on the LSF transformation shown in this section. Voice conversion using k-histograms The voice conversion algorithm using k-histograms has four steps in our experiments: windowing and parameterization, inverse filtering, parameter transformation and resynthesis. Each utterance is divided into overlapping pitch synchronous frames with a width of two periods. An asymmetrical Hanning window is used to minimize boundary effects. The parameterization consists of a 20th order LSF vector. The source excitation (the residual of LPC estimation) is calculated via inverse filtering with the LPC parameters obtained in each frame. During the training process, source and target LSF parameter vectors are aligned to obtain the mapping function using k-histograms. The alignment information is extracted from phone boundaries provided by a speech recognizer. Inside the boundaries of a frame, the alignment is linear. The LSF parameters are transformed using the CDF estimated for the set with the highest probability calculated as shown in Eq. 5. The transformation includes a discretization of the LSF parameters that span from 0 to π. The degree of discretization is an adjustable parameter and it is directly related to the amount of available data to estimate the counts of the histograms. The transformed LSF parameters are converted into LPC coefficients, and they are used to obtain the target converted voice by filtering the source excitation. The fundamental frequency is transformed using a mean and standard deviation normalization and the signal is resynthesized using PSOLA [9]. Figure 2 shows a scheme of a system that made voice conversion using only K-Histograms. In this case we preferred to use the target excitation to study the accuracy of LSF parameter conversion without the influence of an inaccurate excitation estimation.
cients. The main drawback of this proposal is the discretization of LSF parameters that introduces noise in the estimation. This is solved by using a high quantity of levels to discretize the cumulative distribution function, and consequently, this error is negligible. 2. 3. Residual Conversion Although methods based on transformation of vocal tract obtain good performances, some works [3, 12] establish that a certain percentage of the identity of the speaker is contained into the residual signal resulting from decomposing the voice using the sourcefilter model. Consequently, it is necessary to find a system capable of converting that not only uses information of the vocal tract to map the acoustic space between speakers, but also it is necessary to take into account for the conversion the residual signal. There are several research lines, and the trivial solution is to resynthesize the voice by copying the source residual signal. This solution is used in the most popular research works. Homewever, the residual signal has information about the identity of the speaker. Then, it is possible to establish a temporal correlation between the features of the vocal tract and the residual signal. Consequently, it is important to resynthesize the voice using converted residual signals. In the literature, several works [3, 4, 12], utilize parameters related to the vocal tract to obtain a residual signal from a prerecorded database in a training stage. Then, the baseline residual selection method is based on a pre recorded database, where there are stored pairs of target residual signals and LSF vectors of the source speaker temporally aligned. Then, each LSF source vector is used to select the closest LSF source vector into the database by computing the euclidean distance. Thus, the correspondent residual signal is extracted of the database, and the voice signal is resynthesized using it.
Figure 3: Structure of the database.
Figure 2: System based on K-Histograms. Using K-Histograms, although it is an approximation that uses statistical tools likewise the GMM model [11], Uriz et al. [15] obtains a better conversion with this non-gaussian approach, without introducing assumptions about the distribution of the LSF coeffi-
In Figure 3 the scheme of the database is shown. As can be seen, it is composed by pairs of LSF source vectors and target residual signals aligned during a training stage. Then, when the j th segment is processed, the corresponding LSF source vector is compared with all the LSF vectors contained into the database applying the euclidean distance. The target residual signal that minimizes this distance is used to resynthesize the j th segment of the voice signal. A scheme of the described system is shown in Fig.4. Figure 4 shows the proposed baseline system. This
Figure 4: Baseline System. has two blocks, one obtains the converted vocal tract parameters (LSFC ), and the other the residual signal (eC ). Once obtained LSFC and eC , the signal is filtered and resynthesized by means of the Time Domain Overlapping and Add technique (TD-OLA). Although the proposed method has a better identity than the method that uses the source residual signal, discontinuities appear due to the procedure of frame selection. It has the disadvantage of choosing consecutive frames from different places of the database, which were pronounced in different phonetic contexts. Thus, voice signals resynthesized using these methods have a lower quality due to differences between consecutive frames. In the next Section a smoothing version of the residual selection is presented, which has residual averaging to reduce the discontinuities between consecutive frames.
Our proposal is to use such techniques to reduce the noise in the residual signal. The literature [7] establishes that the residual signal can be modeled depending on the sound type of the phonation. Then, for voice sounds, the residual signal can be represented as the sum of a train of impulses and white noise, while an unvoiced sound is represented by means of white noise. Then, if a series of similar residual signals are extracted from the database, and they are adjusted in length and averaged, a smoothed residual signal is obtained. If this procedure is repeated for all resynthesized segments, the resulting smoothing will reduce the differences between consecutive segments. This will be reflected in a higher quality in the obtained audio. In this paper we propose to average target residual signals to obtain a vector, which will be used to resynthesize the voice signal. The averaging is made using the k closest target residual signal, extracted by the database through the LSF source vector. The number k of averaged frames determines the degree of smoothing of the obtained vector. The main blocks of the system are presented in Fig.5.
3. PROPOSED SYSTEM As was mentioned in the previous section, the voice signal resynthesized using residual conversion by means of codebooks has artifacts and discontinuities due to the procedure of frame selection. This process selects residual frames from the database by computing an euclidean distance between the LSFS and each LSF source vector of the database. Once selected the vector that minimizes that distance, the target residual signal associated to them is selected to resynthesize the speech. As a result the procedure is based on an euclidean distance that only selects frames that minimize the local distance, the concatenation cost is not taken into account. Then, it is possible to take consecutive frames from distant places of the database, which can be pronounced in different phonetic contexts. This produces problems in the synthesized audio. To solve this problem, the literature take into account a concatenation cost jointly with the local cost to choice the residual frame from the database. Although this method reduces the artifacts, the quality of the synthetic voice is low, and the computational cost associated to this kind of system is higher than others. Our proposal is based on averaging techniques, which are widely used on image processing to reduce the noise in pictures. The goal of these techniques is to reduce the noise of an image by averaging several copies of it. These methods are based on the supposition that the image is contaminated by gaussian noise with a mean equal to zero. Consequently, the averaging of the image allows to obtain the signal plus the mean value of the noise (zero).
Figure 5: Proposed System. In Figure 5 it is possible to see that the LSF source vectors (LSFS ) are used to obtain an approximation of the LSF target vector ( LSFC ), which is made applying the K-Histograms algorithm. Also the LSFS are used to select the k closest LSF source vector (LSFS ) from the database. Thus, the correspondent k target residual signals are adjusted in length so that they can be added and averaged. Then, the resulting residual signal is filtered using the LPC parameters obtained from LSFC , and through TD-PSOLA, the signal is resynthesized. An important factor is the number k of averaged residual signals. A low value of k will not contribute to a good quality because the smoothing is poor. On the other hand, a high value of k, generates an oversmoothed signal, which can affect the identity of the obtained speaker, and also it can affect the content of the message. Filtering would eliminate sounds associated with fricatives. In order to test the performance of the system, three implementations are presented. The first, which generates the frame to resynthesize the voice by averaging two segments of the database. The second, which uses five frames to obtain the averaged segment. Finally, an implementation that uses twenty segments from the database to obtain, by averaging, a residual converted signal. In the next Section, objective and subjective experiments analyze the performance of each system.
The audio database used for the experiments contained 205 sentences in Spanish uttered by two male and two female speakers. The sampling frequency was 16 KHz and the average duration of the sentences was 4 seconds. 55% of the sentences were used to train the conversion functions, while 30% were kept as development set (to tune model parameters) and 15% were used to perform the objective and subjective tests. One male and one female speaker were chosen as source, and the other two speakers were used as target. Four different conversion directions were considered: male to male, female to female, male to female and female to male. 31 sentences unseen during training were converted and resynthesized for all methods. The results will be shown by merging all speakers, because separate results show a correspondence with the global results. For the proposed method, we will consider a quantization resolution of 3140 bins for the histograms, since this ensures a low level of noise quantization. Four levels of averaging are used to test the system: 1 vector (without averaging) (NO SM), 2 vectors (SM=2), 5 vectors (SM=5) and 20 vectors (SM=20). A fifth system that employes privileged information was developed. This system resynthesizes the signal using the converted LSF parameters, and the residual signal corresponding to the real target speaker. It is a measure of the highest achievable quality and identity by the proposed method. The main aim of the averaging is to reduce the inter-frame discontinuities, which must produce an increase in the quality of the synthetic voice. Figure 6 shows the proposed reference system. Some results will be shown
Figure 6: Architecture of the reference system. using boxplots [14]. This representation is an useful statistical tool to compare several statistical distributions. In our case we will use it to compare the distribution of the scores of the different systems to study the significance of the differences. 4. 1. Objective Results Using a Small Speaker Verification System In this work, we evaluate the proposed methods using a small speaker verification system (SVS) based on a GMM model [10]. MFCC coefficients are applyed to code the voice signal using frames of 20ms each. Two GMM models were trained using evalua-
tion data to build source and target models. Given an utterance of a converted voice, these models may be utilized to establish the closeness to source and target. The subtraction of the log-likelihood of source and target models is an indicator (score) of the performance of the conversion. A positive score indicates a good conversion, while a negative score is an indicator of closeness to source voice model. Figure 7 presents the results of the different algorithms. Methods are ordered according to the median of the scores. The results show that the method that averages 20 frames has the higher performance without using privileged information. 100 80 60 40
SCORES
4. EXPERIMENTS
20 0 −20 −40 −60 −80 REFERENCE
NO SM
SM=2
SM=5
SM=20
METHODS
Figure 7: Objective test. The most important result obtained in this experiment is that the identity of the resynthesized voice is not degraded by using averaged segments. 4. 2. Subjective Experiments The subjective tests were conducted with 31 sentences unseen during training. 15 volunteers were asked to listen to the target converted sentence in random order. Listeners were asked to judge the similarity of the voices to the target using a 5-point scale, from 1 (totally identical to source) to 5 (totally identical to target). On the other hand, the listeners were also asked to rate the quality of the converted sentences from 1 point (bad) to 5 points (excellent). The Table 1 shows the Mean Opinion Score (MOS) of the obtained results. It is possible to see that both the quality (MOS-Q) and the similarity (MOS-S) are increased with the averaging. Finally, for the case where SM = 20, both scores are slightly lower than for the reference method (REFERENCE). Figure 8 shows the scores for quality MOS test using boxplots. In this figure can be seen that apart from the reference system, the proposed system has increasing scores according to the degree of averaging. Then, the method that averages 20 frames obtains the highest value of median. Also, it has the lowest distance between the first and the third quartiles, thus it is the most consistent method. These are within expectations, since filtering is performed to reduce noise that
SM = 20 SM = 5 SM = 2 NO SM Reference
MOS-S 4.000 3.950 3.775 3.725 4.025
MOS-Q 2.575 2.375 2.050 2.100 2.925
Table 1: MOS-S and MOS-Q scores for all systems under evaluation. causes a gradient in the resynthesized signal quality.
[3] H. Duxans and A. Bonafonte. Residual conversion versus prediction on voice morphing systems. In Proceedings of the IEEE International Conference on Acoustics, Speech and Signal Processing, volume 1, pages 85–88, 2006. [4] Z. Hanzlicek. On residual predictionin voice conversion task. [5] Z. He, X. Xu, and S. Deng. Squeezer: An efficient algorithm for clustering categorical data. J. Comput. Sci. Technol., 17(5):611–624, 2002.
5 4.5
[6] Z. He, X. Xu, S. Deng, and B. Dong. Khistograms: An efficient clustering algorithm for categorical dataset. 2005.
4
SCORES
adaptation. In Proceedings of the European Conference on Speech Communications and Technology, pages 2413–2416, 2003.
3.5
[7] X. Huang, A. Acero, and H.W. Hon. Spoken language processing. A Guide of Theory, Algorithm, and System Development. 2001.
3 2.5 2
[8] A. Kain. High resolution voice transformation. In PhD thesis, OGI - OHSU, 2001.
1.5 1 REFERENCE
NO SM
SM=2
SM=5
SM=20
METHODS
Figure 8: MOS test of quality. 5. CONCLUSIONS In this paper, a voice conversion algorithm based on K-Histograms and averaging of residual signal stored in a database was presented. Objective and subjective experiments show that the proposed method allows to obtain a higher quality in the converted voices. Since the level of similarity of the resulting audios remains the same, a better trade-off of similarity and quality than the system that resynthesize the voice using only one residual segment is obtained. It was demonstrated that the combination of khistograms and averaged excitation signal obtained good results for identity and quality. In the future, we will include other state-of-the-art methods to enhance the processing of the excitation. Consequently, it is expected that the quality of the complete voice conversion will be increased. REFERENCES [1] M. Abe, S. Nakamura, K. Shikano, and H. Kuwabara. Voice conversion through vector quantization. In Proceedings of the IEEE International Conference on Acoustics, Speech and Signal Processing, pages 655–658, 1988. [2] Y. Chen, M. Chu, E. Chang, J. Liu, and R. Liu. Voice conversion with smoothed GMM and MAP
[9] E. Moulines and F. Chanpentier. Pitch synchronous waveform processing techniques for text-to-speech synthesis using diphones. In Speech Communication, 1990. [10] D. A. Reynolds. Speaker identification and verification using gaussian mixture speaker models. In Speech Communication 17, pages 91–108, 1995. [11] Y. Stylianou, O. Cappe, and E. Moulines. Continuous probabilistic transform for voice conversion. In Proceedings of ICASSP, volume 6, pages 131– 142, 1998. [12] D. Sundermann, H. Hoge, A. Bonafonte, and H. Duxans. Residual prediction. In Proceedings of the IEEE Symposium on Signal Processing and Information Technology, pages 512–516, 2005. [13] T. Toda, H. Saruwatari, and K. Shikano. Voice conversion algorithm based on gaussian mixture model with dynamic frequency warping of STRAIGHT spectrum. In Proceedings of the IEEE International Conference on Acoustics, Speech and Signal Processing, pages 841–844, 2001. [14] J.W. Tukey. Exploratory data analysis, addisonwesley. 1970. [15] A.J. Uriz, P.D. Aguero, A. Bonafonte, and J.C. Tulli. Voice conversion using k-histograms and frame selection. In Proc. of Interspeech 2009, 2009.