Agricultural Economics and Extension, Akwa Ibom State University, Nigeria ... Eket, Ibeno, and Eastern Obolo Local Government Area (LGAs), Akwa Ibom State, ...
International Journal of Management Sciences and Business Research, 2014 ISSN (2226-8235) Vol-3, Issue 12
Analysis of the Expectations and Benefits of Petroleum Resource Exploration in Oil Producing Communities of Akwa Ibom State, Nigeria. Author’s Details: Uwemedimo E. Okon1*, Christopher A. Ekpo2, Sunday B. Akpan1, Otu W. Ibok1 and Nsikan E. Bassey1-1Department of Agricultural Economics and Extension, Akwa Ibom State University, Nigeria 2Department of Geography, University of Uyo, Nigeria *Correspondence: Dr. Uwemedimo E. Okon, Department of Agricultural Economics and Extension, Akwa Ibom State University, P. M. B. 1167, Uyo, Nigeria. Abstract The paper analyzed the expectations and benefit of petroleum resource exploration in three oil producing communities of Esit Eket, Ibeno, and Eastern Obolo Local Government Area (LGAs), Akwa Ibom State, in south-South, Nigeria. A two stage purposive sampling frame was constructed from the list of four communities, spanning three LGAs, identified. Since all the communities apparently displayed similar socio-economic and cultural characteristics, a simple random sampling technique was employed to select 28 communities with a total of 400 questionnaires, using “Yaro Yamane” formula for a finite population. The data collected was analyzed using descriptive statistics while a two way dependent t-test analysis was used in comparing the mean score of the two variables, identified as: the expectation of the host communities (independent variable) and benefit deliveries from relevant stakeholders in the oil sector (dependent variable).The result of the analysis revealed that, the expectations of the communities from oil producing activities by the Multinational Oil companies (MOCs) showed the benefits deliveries as: employment (28.50%), construction of good roads (21.75%), electricity (15%), provision of school/educational facilities (22.25%), pipe borne water (19%) and hospital/health care centre (17.75%). Finally, to some extent the oil companies have exercised their Corporate Social Responsibilities (CSR), but have not done creditably to engender the sense of partnership. The study recommends that to increase the flow of the benefits overtime by MOCs, bottom-up corporate-community partnership is relevant amongst other. Keywords: Expectations, Benefit, corporate social responsibility, community development, Akwa Ibom State. 1.0
Introduction
Generally, natural resource is of great livelihood importance to billions of people throughout the world. Its impact is much more felt among the poor in the developing countries. Food and Agricultural Organisation (FAO, 2004), for instance, estimated that more than 1.3 billion people depend on fisheries, forests and agriculture for employment-close to half of all jobs worldwide. The strength of poor peoples‟ economies depends on availability and access to natural resources within their domain. According to the World Bank (2002), 90% of the world‟s 1.1 billion poor live on less than $1 per day, and depend on forests for at least, some part of their income. In 2002, International Development Agencies estimated that more than 90% of the 15 million people working on the world‟s waters were small-scale fishers, most of them poor, not including the tens of millions of poor who fish inland rivers, lakes, and even rice paddies for protein (USAID, 2006). In Africa, United State Aids for International Development (USAID, 2006), estimated that more than seven in ten poor people live in rural regions, with most engaged in resource-dependent activities such as small-scale farming, livestock production, fishing, hunting, artisanal mining, and http://www.ijmsbr.com
logging. In short, poor peoples‟ last hopes of survival depend on natural resources when other sources of income fail. While it is observed that poor people in developing countries use natural resources the more (Hammond, 1995), the point is also extended, by implication that poor countries‟ economies depend on availability and exploitation of the resources of nature. In this context, the rich and the poor in developing countries are much more confronted with the reality and question of access to available natural resources than in developed countries. Who commands more access to available natural resources depends on power relations as well as financial and physical capital. Because they have greater political power, the rich are able to exercise stronger control over access to resources than the poor. Without wage incomes and lacking cash, the rural poor often have no other choice than to depend on “common pool resources” for food, firewood, and medicines. With lower vulnerability to risk, the rich can selectively concentrate on one or two activities, such as grazing and agriculture, to optimize their investments, while the poor often diversify their livelihood strategies to include a wider range of activities, such as collecting wild foods, wood carving, and collecting firewood and construction Page 7
International Journal of Management Sciences and Business Research, 2014 ISSN (2226-8235) Vol-3, Issue 12
materials partly as a risk mitigation strategy (USAID, 2006). As natural resources have become the pillar of developing countries‟ economies, it has also become the source of what most scholars‟ term „development in reverse‟ or „natural resource curse‟ (Herring Shaw, 2004; Auti, 2001). Most countries with abundant natural resources have become the citadel of wars, violence, clashes and conflicts of various forms. In many recent conflicts, natural resources have played a role in both causing and sustaining conflict. For example, illegal timber products in Liberia and Cambodia have financed civil wars and military campaigns. Diamonds and other minerals have been implicated in conflicts in Liberia, Sierra Leone and Democratic Republic of the Congo. In Nigeria, petroleum oil exploration have fuelled resource conflicts and financed militancy in the Niger Delta. Apart from the poor trying to retain control of their natural resources and services needed for livelihood, the rich and State also struggle to establish hegemony over available resources. The Niger Delta region happens to be the main centre of oil producing activity in Nigeria and therefore the centre of Nigeria‟s economy, accounting for more than 90% of Nigeria‟s foreign exchange earnings and more than 80 percent of government revenue. The natives of this region depend so much on the natural environment for daily living, mostly in the form of fishing, farming and gathering. Consequently, oil exploration and exploitation had had far reaching negative environmental, social as well as economic impacts on the host communities (Akpan and Akpabio, 2003). Foxcroft (2005) observed that the failure of the Nigerian state to provide or actively encourage social and economic development in the Niger Delta has led to reliance by the government and oil producing communities on Multinational Oil Companies (MOCs). This translates to the fact that Nigeria‟s economic and social policies and public administration have clearly accentuated poverty in the Niger Delta more than in other regions of the country. The result has been the evolution of a mind-set and culture of dependence on the MOCs. In the process, the oil producing communities have resorted to expecting and demanding „socioeconomic development‟ from the MOCs. Such expectations have become the greatest security challenge to the government and the region. Shell Petroleum Development Company (SPDC), is the largest oil MOC in Nigeria and second largest in the world and accounts for over half of Nigerian crude oil http://www.ijmsbr.com
petroleum. Nevertheless, given the complexity of measuring the social impact of business both at local and national levels, there is need for a focused critical assessment of these oil companies vis-à-vis their contributions to the host communities, bearing in mind the financial gains from the exploitation and exploration from bowls of the Niger Delta. Such an assessment would be geared towards highlighting the strengths and weaknesses of the initiative, in order to maximize the contribution and net impacts corporate efforts made on sustainable development. Against this background, the study critically examines Exxon Mobil (Mobil Producing Nigeria/MPN), Shell, Total, and Elf Petroleum Nigeria Limited (EPNL), Community Development partnership (CDP) initiatives, geared towards poverty reduction and sustainable community development in their host communities. Data presented were drawn from questionnaires and interviews conducted in host communities and with MOCs‟ partners. Local publications by MOC also serve as a useful source of secondary data. The study looked at the Community Development Programmes (CDPs) initiatives by Exxon Mobil, Total, amongst others and their potentials in contributing to community development. The objectives of this study are to: a. identify and assess the broad expectations of oil communities in relations to oil resource exploration over the years; b. identify and examine available petroleum development benefits incidental to oil exploration in the sampled oil communities. Hypothesis Ho: There is no significant difference in the expectation and benefit distribution of petroleum resources in the core oil producing communities of Akwa Ibom State. 2.0
Literature Review
2.1 Petroleum exploration and benefit distribution A number of commentaries and writings have emerged of recent which seem to demonstrate that petroleum exploration in the Niger Delta have tended to correlate with negative economic, social, political and environmental outcomes (Obi, 2008; Watts, 2004; Ukeje, 2001; Di John, 2007). While oil resources have powered the Nigerian economy for long, it is also observed that the cries of marginalization and benefit deprivation have also intensified. Obi (2008) wrote that the increased centralization of the control of oil at the federal level, and the progressive abandonment of the Page 8
International Journal of Management Sciences and Business Research, 2014 ISSN (2226-8235) Vol-3, Issue 12
derivation principle implied that their regions/states could not claim or control the oil produced within their territories, but rather had to either rely on the „benevolence‟ of a distant far away federal government, or suffer from its neglect of the concerns of their groups. The sense of grievance was worsened by military repression of protests, widespread impoverishment and increased oil-related environmental degradation of the Niger Delta. It was also believed that a „distant‟ federal government dominated by elite from the majority ethnic groups, and foreign oil multinationals had no regard for the rights and welfare of the ethnic minorities of the Niger Delta (Obi, 2008).
Act), the Nigerian government is the principal recipient of oil rent. Hence, the Nigerian state is invariably more of an allocative than a productive state (Luciani, 1987). The consequence of this rentier economy is that it fosters a rentier mentality that affects both the nature of the state and its role in society. For instance, drawing on this rentier context, the resource curse literature has demonstrated how oil has hindered democracy in Nigeria (Ross, 2001), fostered a predatory state and poor governance (Moore, 2004), generated social conflict (Idemudia and Ite, 2006), and fostered poor economic development (Karl, 1997). 2.2
The emergence of petroleum industry in Nigeria and its subsequent social, political, and economic impacts on the state-community relationship has been well documented (Frynas, 2000; Omoweh, 2005). Idemudia (2010) had identified two broader literature related to this field. The first is the early 1970s debate over whether the Nigerian state is simply a tool of foreign capital or it is an autonomous actor. Omoweh (2005) suggested that the debate has been in a state of flux. He concluded that the state is neither just a tool of the capitalist in the metropole or of the local bourgeoisie; rather, like every capitalist state, the Nigerian state acts to reproduce the aims of finance capital while ensuring its own means of accumulation in the process. In addition, the Nigerian state is a product of colonization and therefore a state-nation as opposed to being a nation state. (Idemudia et al, 2006). Hence, the state does not only suffer from a legitimacy crisis, its ethnic heterogeneity, and religious diversities as well as differences in the colonial experiences of the different parts that now make up Nigeria mean that “politics of anxiety” predominates. The second relevant aspect of the broader literature is the understanding of the Nigerian state as a monocommodity rentier state since the 1990s. The rentier nature of the Nigerian economy is manifested in the fact that oil rent does not only predominate, it is also largely external in origin. For example, oil rents accounts for 40% of Nigeria‟s GDP, oil export accounts for 95% of the country‟s total exports and 80% of governmental revenue between 1970 and 2006. In addition, the capital intensive nature of the oil industry means that only a few are involved in the process of rent generation, while a majority of people are involved in its distribution and consumption. No more than two to three percent of the population is involved in the generation of oil revenue. Finally, by virtue of a number of decrees and laws (such as the Land use Act of 1978 and the 1969 Petroleum http://www.ijmsbr.com
COMMUNITY DEVELOPMENT THEORY
The role of theory is to predict, interpret and give the necessary explanation of the phenomenon under investigation (Denzin, 1971:56 and Blammer, 1998:11). To play this role effectively, the theory chosen must be directly explicatory. The Community Development perspective is the basic theoretical and conceptual framework for this study. It is both historical and, a holistic orientation for the analysis of social formations and their contradicting relationships. This perception emphasizes three critical elements, namely; the primacy of material conditions, the dynamic character of social reality and the relatedness and complex nature of elements of society. The mode of production in the Niger Delta especially in the study area revolves around oil and its multi-national oil Companies is presumed to be central to the material conditions of the oil producing communities. This is so, because it provides the basis for understanding social life. It should be noted that man‟s economic activity; be it expectations or benefits from oil exploration and exploitation as in the case of the Niger Delta, is central to his other activities in the society. To survive, man has to provide himself with food, clothing and shelter. In providing his basic needs, he interacts with the other members of the society, cutting across different strata. At the apex of the strata, is the Federal Government of Nigeria and the oil companies when considering the economic hierarchy while the host communities, play the second fiddle. Here, active participation by the people in deciding their benefits are relegated to the backgrounds. Lenin argued that the estrangement of a social group from the means of production would turn them into an oppressed class whose lot is destitution and deprivation of rights. Lenin‟s argument can equally be extended to include that, the more people are estranged from decision making/implementation on issues or programmes that affect them directly, the lower their Page 9
International Journal of Management Sciences and Business Research, 2014 ISSN (2226-8235) Vol-3, Issue 12
morale, restiveness, hence the less impressive the results in community development. The beauty of the community development approach is that it identifies the essential elements of this process as including; participation of the people; much reliance on their own initiative and provision of technical cum other services in ways which encourage initiative, self help and mutual help. Infact, it is now generally accepted that for programme to be properly labeled “Community Development”, it must have the foregoing ingredients. The concept of initiative implies that the community which seeks development especially from the multiThe concept of Corporate Social Responsibility as adopted for this study has acquired broad support in various international fora. There is no universally accepted definition of the concept, there is however, a consensus that it implies a demonstration of a certain responsible behaviour on the part of governments and the business sector towards society and the environment. Three important institutions have underlined the need for governments and companies to adhere to the principles of Corporate Social Responsibility. These are the World Business Council for Sustainable Development (WBCSD), the Organization for Economic Corporation and Development (OECD) and the Dow Jones Sustainability Indexes (D.J.S.G.I). On the whole, the “core values” as integral to Corporate Social Responsibility are: *
Human Right;
*
Employees Right;
*
Environmental Protection;
*
Monitor Rights; and
*
Stakeholders‟ rights.
These core values define the responsibilities of Corporations (and governments) to the society: Corporate Social Responsibility. Thus what benefit or harm would a company‟s project bring or does to the human right of the society, the employees‟ rights of its workers, the environmental protection of the community, the development of the community and the rights of the community as legitimate stakeholders? The community is respected as a stakeholder in the project, thus the company as the case may be is compelled to construct a base for close collaboration and consultation with the community as well as assist in http://www.ijmsbr.com
nationals exploiting oil in their domain must take the first step in the process despite the Memorandum of Understand (MOUs) early signed with them (Poston 1962). 2.3 CORPORATE SOCIAL RESPONSIBILITY CONCEPT Niger Delta is a region endowed with immense natural resources, especially crude oil and ranks among the largest deltas in the world. Akwa Ibom State, being a major stakeholder in the region, enjoys tremendous nature‟s endowment in crude oil as well. capacity building in all aspects of social and economic development. To achieve this level of responsibility, a company must implement a transparent policy of working with community to ensure that, these core values are adhered to. It must also ensure that environment is not compromised and that any environmental risks arising from its project must be equitably distributed among the society and must not be borne disproportionately by the poor. In its broadest terms, therefore, the concept of CSR is inextricably linked to the notion of environmental justice and sustainable development of the host communities. In their study Vander (1999) found economic instruments to be “socially regressive and counter productive to the concept of CSR as the percentage burden is greater for low income households than for higher income households.” They argued that market-based instruments reduce the powerful and symbolic appeal of pollution control. As a consequence, they may lead to a weakening in the public committment to a shared environmental ethics. CSR is not only the expected ethical behaviour of companies, but it also defines the self interest of companies by investing in the core elements of CSR, a company is also simultaneously facilitating a base conducive to the emergence of a healthy and welleducated community that would assist the company in attaining its economic growth objectives. It is a win-win strategy. 3.0
Materials and methods
3.1
Description of study area
Akwa Ibom State lies on the coastal plain of Southern Nigeria with a landmass of 8,412 sq.km. There are 31 local government areas divided into three Senatorial Districts with Uyo as the State Capital. It is located between latitudes 4º30‟ and 5º30‟ N and longitude 7º30‟ Page 10
International Journal of Management Sciences and Business Research, 2014 ISSN (2226-8235) Vol-3, Issue 12
and 8º15‟ E. The study was conducted in Eastern Obolo, Ibeno and Esit Eket is situated between latitude 4º33‟ and 4º42‟ N and longitude 7º50‟ and 8º15‟ E. The selected study area is the “core” oil producing areas of the state. The State recorded a total population of 3,920,208 in 2006 (NPC, 2006), population of the selected study area is approximately 262,454 with Eastern Obolo having the least number with 17,644 people, Ibeno, 75,380 people and Esit Eket, 63,701 people. (NPC, 2006). It is characterized by seasonality of climate in which wet season is followed by a dry season. Seasonal variation in the rainfall is mainly attributed to the two major air masses which influence the climate of the entire State. These are the moisture laden Tropical Continental (CT) - air-mass, which comes from the Sahara desert. The wet season begins in about 3.2
March or April and continues through November. The vegetation of the study area is characterized by freshwater swamp forest, mangrove swamp forest and some patches of secondary forest. Variation in vegetation exists mainly due to variability in climate, geomorphology and soil (Ekanem, 2010). Numerous mineral resources are found in the study area which include mudflat, sand flat influenced by the tidally areas and open coastal planes and gravels supplied from various sources delivered by delta tributaries and redistributed by tides and waves. The major mineral resources of the area include gravel, claystones, limestones, natural gas, and large deposit of crude oil which is made possible by the mangrove swamp and recent alluvium which extend to the continental shelf of the southern part of the state.
Sampling procedure and sample size
The study was restricted to the local government areas of Esit Eket, Ibeno and Eastern Obolo. These are the areas where most of the oil companies‟ plants and facilities are located and where many of its employees live and interact on a daily basis with members of those communities. The population of the study area is made up as follows: Esit Eket 63,358, Ibeno 74,840 and Eastern Obolo 59,970. A sampling frame was constructed from the list of villages in the above named Local Government Areas. From the list of the villages spanning the three local government areas, 141 communities are identified. However, since all the communities apparently display similar socio-economic and cultural characteristics, a simple random sampling technique was employed to select 28 communities for the study. Following the non-release of the breakdown of the 2006 Population and Housing Census on Community (Locality) basis, the total population projection of the 28 chosen communities was based on the population growth rate of 3.4% per annum (NPC 2009), for 2010 using the 1991 population figures as a base. This was projected using the geometric growth models. The model is shown in equation 1.
Pttn
Pt
=
(1 + r)2, where
Pttn Is the population at the time
.
.
.
.
.
.
. (1)
tt n , r is the growth rate per unit time and n is the length of the interval for which the
projection is made. Then, the sample size was statistically determined using the “Yaro Yamane” formula for a finite population. The formular is shown in equation 2.
n
N I N (e) 2
.
.
.
.
.
.
.
. (2)
where: n = Sample size (123,480); N = The finite population; e = Level of significance (0.05); I = Unity (a constant). Substituting in the above formula
n
=
123,480 1 123,480(0.05) 2
=
399.611
http://www.ijmsbr.com
400 Page 8
International Journal of Management Sciences and Business Research, 2014 ISSN (2226-8235) Vol-3, Issue 12
Using purposive sampling technique, respondents judged to possess the characteristics looked for in the research was selected in the study area. Therefore, a total of 400 questionnaires were distributed in the study area. This is shown in table 1. TABLE 1: Distribution of questionnaires in the selected communities of Esit-Eket, Ibeno and Eastern Obolo Local Government Areas of Akwa Ibom State. ESIT EKET LOCAL GOVERNMENT AREA S/N COMMUNITY 2010 PROJECTION 1. Akpambiet 1,673 2. Edor Atai 3,177 3. Oniok Edor 3,209 4. Ekpene Obo 8,690 5. Ikpa 5,611 6. Uquo 11,540 7. Akpautong 8,048 8. Etebi Mbak Uyo 3,287 9. Ntak Inyang 2,300 10. Etebi Idung Assang 4,519 Sub-Total 52,054 IBENO LOCAL GOVERNMENT AREA 11. Upenekang 12. Iwuoachang 13. Atabrikang 14. Iwuo Okpom Opolom 15. Okoro Utip 16. Mkpanak 17. Inua Eyet Ikot 18. Akata 19. Iwuo Okpom Sub-Total
13,026 9,422 1,607 2,966 2,311 17,843 631 1,261 1,236 53,782
EASTERN OBOLO LOCAL GOVERNMENT AREA S/N COMMUNITY 2010 PROJECTION 20. Kampa 648 21. Okoroette 4,814 22. Okoromboho 1,758 23. Okoroitti 1,032 24. Iko Town 4,364 25. 26. 27. 28.
3.3
Atabrikang Iko Ikpilaha Emereoke I Obianga Sub-Total GRAND TOTAL =
POPULATION
NOS. QUESTIONNAIRE 5 10 10 28 18 38 26 11 8 15 169
OF
42 30 5 10 8 58 2 4 4 174
POPULATION
730 1,043 968 888 17,644 52,054 + 53,782 + 17,644 = 123,480 People
NOS. QUESTIONNAIRE 2 16 6 3 14
OF
2 3 3 3 57 169 + 174 + 57 = 400 Questionnaires
Analytical technique:
The data collected from the field was subjected to simple percentage calculations. Statistical methods such as: frequency table, bar chart as well as tables were employed to display information for easy understanding. A two way dependent t-test analysis was used to test the hypothesis. 4.0
Results and Discussion
http://www.ijmsbr.com
Page 8
International Journal of Management Sciences and Business Research, 2014 ISSN (2226-8235) Vol-3, Issue 12
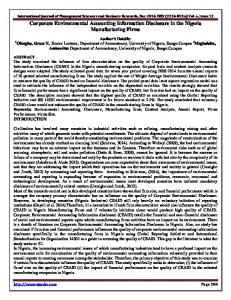
4.1 Broad expectations of oil communities The first research objective was to identify and assess the broad expectation of oil communities in relations to oil resources exploration over the years with the view to ascertaining the Implementation of Corporate Social Responsibilities of the oil multinationals to these communities. In order to treat the research objective, descriptive analysis was performed on the relevant data as shown in Tables 2 to 7 and Figures 1 to 6. Table 2: Descriptive analysis of the assertion that the expectations of the community have been met from oil production activities Items
Frequency
Percentages
Strongly agreed
6
1.5
Agreed
36
9.0
Undecided
227
56.75
Disagreed
96
24.0
Strongly disagreed
22
5.5
Nil
13
3.25
Total
400
100.0
Source: Field study, 2013 60
56.75
50
Percentage (%)
40 30
24
20 9 10
5.5
1.5
3.25
0
r St
y gl on
ag
re
e A
ee gr U
d de ci e nd Responses
D
ee gr si a S
n t ro
y gl
ee gr si a d
il N
Fig.1. Bar chart showing the assertion that the expectations of the community have been met from oil production activities.
The above Table 2 and Figure 1 present the descriptive analysis of the assertion that the expectations of the community have been met from oil production activities. From the result of the data analysis it was observed that most people chose undecided (56.75%). This was seconded by the people who disagreed to the fact (24%). The third in the list was the people who agreed to it (9.0%). It was also observed that 5.5% of the people strongly disagreed to the fact, while the least in the list recorded 1.5% of the respondents strongly agreed to the assertion that the expectations of the community have been met from oil production activities. However, 3.25% of the respondents failed to respond to the question. It could be derived from the analysis that the expectations of the oil community have not been met from oil producing activities. http://www.ijmsbr.com
Page 9
International Journal of Management Sciences and Business Research, 2014 ISSN (2226-8235) Vol-3, Issue 12
Table 3: Expectations of the community from the oil production activities Items
Frequency
Percentage
Employment
114
28.50
Construction of Good Roads
87
21.75
Electricity Building of Hospitals
72
18.00
55 49 23 400
13.75 12.25 5.75 100.0
Pipe born water Building of market Total Source: Field survey, 2011
Fr equen cy ( %)
30
25 20 15 10
5 b u ilding of mark et
pi pe b or n wate r
electricity
h ospitals
cons truc tio n of good road s
employ men t opportunity
0
Responsee
Fig. 2: Bar chart showing the expectation of the community from the oil production activities The table 3 and figure 2 present the descriptive analysis of the expectation of the community from the oil production activities. From the analysis it was observed that employment opportunity (28.5%) is the greatest expectation of the community. This was seconded by construction of good roads (21.75%). Thirdly was electricity (18.0%). Building of hospital (13.75%) was the fourth in the list. The result proved pipe born water (12.25%) as the fifth expectation while building of market was the least in the list (5.75%). The expectations of the community from the oil producing activities are numerous with employment opportunity and construction of good roads being the highest expectation. Table 4: Level of people‟s assessment of the extent (quality and quantity) of infrastructures/development projects and programs provided from petroleum resources in the development of the area.
http://www.ijmsbr.com
Page 10
International Journal of Management Sciences and Business Research, 2014 ISSN (2226-8235) Vol-3, Issue 12
Items Frequency Very high 2 High 53 Medium 181 Low 115 Very low 38 Nil 11 Total 400 Source: Field Survey 2013
50
Percentage 0.50 13.25 45.25 28.75 9.50 2.75 100
45.25
45 40 Per centage
35 28.75
30 25 20 13.25
15
9.5
10 5
2.75
0 .5
Ni l
lo w Ve ry
Lo w
Hi gh
M ed iu m
Ve ry
hig h
0
Responses
Fig.3. Bar c hart s howing the le vel of people ’s asse ssmen t of the extent of infr astructures/development projects and programmes provided from pe troleum reso urces in the d evelop ment of the area.
The above table 4 and figure 3 present the descriptive analysis of the level of people‟s assessment of the extent of infrastructures/development projects and programs provided from petroleum resources in the development of the area. From the analysis, it was observed that most people assessed the extent of infrastructures/development projects and programs to be medium (45.25%). This was seconded by those that assessed it as low (28.75%). The third group in the list assessed it to be high (13.25%). Then 9.5% as the fourth position in the list considered it to be very high, while the fifth group (0.5%) of people consider the level of infrastructures/development projects and programmes provided from petroleum resources in the development of the area to be very high. This shows that the level of infrastructure/development projects and programs provided from petroleum resources in the development of the area is average.
http://www.ijmsbr.com
Page 11
International Journal of Management Sciences and Business Research, 2014 ISSN (2226-8235) Vol-3, Issue 12
Table 5: Descriptive analysis of the level of satisfaction of the type of infrastructures provided in the community Responses
Frequency
Percentages
Highly satisfied
2
0.5
Satisfied
48
12.0
Undecided
185
46.25
Not satisfied
121
30.25
Poorly satisfied
34
8.5
Nil
10
2.5
Total
400
100
Source: Field survey, 2013 46.25
35 30 25 20
30.25
15
1 2 .0
2.5
ie d is f sa t
sa
ti s f
ie d Po or ly
Responses
No t
id ed Un de c
d
ie is f
sa tis
fi e d
0.5
hl y Hi g
8.5
Ni
10 5 0
Sa t
P erce ntage
50 45 40
Fig. 4. Bar chart showing the level of satisfaction of the type of infrastructu res pr ovided in the community.
Table 5 and figure 4 present the descriptive analysis of the level of satisfaction of the type of infrastructures provided in the community. From the analysis it was ob served that most people (46.25%) were unable to decide on this fact. 30.25% of the respondents were not satisfied with the provision. The third group of people were satisfied (12.0%). 8.5% of the people as fourth in the list were poorly satisfied, while the least category of people were highly satisfied (0.5%). However while 2.5% of the respondents failed to respond to the question. This shows that the level of satisfaction derived from the type of infrastructures provided by petroleum resources to the communities are not satisfactory.
http://www.ijmsbr.com
Page 12
International Journal of Management Sciences and Business Research, 2014 ISSN (2226-8235) Vol-3, Issue 12
Table 6: Descriptive statistics of the regular maintenance of the infrastructures provided Items
Frequency
Percentages
Yes
266
66.5
No
110
27.5
Nil
24
6.0
Total
400
100
Source: Field survey, 2013 Table 6 present the descriptive analysis of how the infrastructures provided are regularly maintained. From the analysis, it was observed that most people (66.5%) affirmed that the infrastructures are regularly maintained while few people (27.5%) did not affirm to this fact. However, 6% of the respondents failed to respond to the question. This shows that there is regular maintenance of the infrastructures provided in the study area. 4.2 Petroleum Development benefit The second research objective was to identify and examine available petroleum development benefits incidental to oil exploration with a view to determine the case(s) of social restiveness in the sampled oil communities. In order to treat the research objective descriptive analysis was performed on the relevant data as can be seen in tables 7 to 8. Table 7: Awareness of the benefits derived from the oil production activities in Akwa Ibom State. Response
Frequency
Percentage
Yes
297
74.25
No
94
23.5
Undecided
9
2.25
Total
400
100
Source: survey,
field
2013.
Table 7 present the descriptive analysis of the people‟s awareness of the benefit derived from the oil production activities by the community. From the analysis it was observed that most people in the area affirmed their awareness of the benefits of the oil production activities to their community (74.25%), while few, did not affirm (23.5%). However, Very few of them failed to respond to the item of the question (2.25%). The result therefore means that the oil companies in the study have exercised their social responsibilities to some extents but have not actually done enough to engender that sense of partnership or neighbourliness.
http://www.ijmsbr.com
Page 13
International Journal of Management Sciences and Business Research, 2014 ISSN (2226-8235) Vol-3, Issue 12
Table 8: Type of infrastructures provided by the oil companies in Akwa Ibom State Items Electricity Potable water Hospital/Health centre School/Educational facilities Assit. in agricultural production Assistance towards solid waste mgt. Road Rehabilitation/Construction Erosion control and drainage Donation of drugs and hospital equipment Provision of books Building of markets NIL Total Source: field survey, (Ekpo, 2011).
Frequency 60 76 71 89 7 1 9 7 2 1 1 76 400
Percentages 15.0 19.0 17.75 22.25 1.75 0.25 2.25 1.75 0.5 0.25 0.25 19.0 100
Table 8 present the descriptive analysis of people‟s responses concerning the infrastructural facilities provided by the oil companies. From the analysis it was shown that the most infrastructural facilities provided had been that of school facilities (22.25%), this was seconded by potable water (19.0%). The third in the list is hospital/health centre (17.75%). The result of the analysis also presented electricity (15.0%) as the fourth one. The fifth one was Road rehabilitation (2.3%), while assistance in agricultural production and erosion control and drainage formed a tie of sixth position in the list with (1.75%). The seventh one was donation of drugs and hospital equipment (0.5%), while assistance towards solid waste management, provision of books and building of markets formed a tie at the least position of eight (0.25%). However while 19% of the respondents failed to respond to the question. The major infrastructures provided are school/educational facilities, portable water, hospital/health care centre and electricity. This shows that the oil producing companies have been assisting to a large extent in providing basic infrastructures to the communities. 4.3
Hypothesis Testing
The null hypothesis states that there is no significant difference in the expectation of the considered host communities of Akwa Ibom State and the benefits deliveries from relevant stake holders in the oil sector. To test this hypothesis, two variables were identified as follows: expectation of the host communities as the independent variable and benefits deliveries from relevant stake holders as the dependent variable. Dependent t-test analysis was used in comparing the means score of the two variables (see table 9). Table 9: Dependent t-test analysis of the difference in the expectation of the considered host communities of Akwa Ibom State and the benefits deliveries from relevant holders in the oil sector. Variable
N
X
SD
Expectation of host communities
400
15.96
3.53
6.94
2.92
Benefits deliveries from relevant stakes holders in the 400 oil sector
T
45.71*
*-denotes significant at 0.05 level; df = 398; critical t-value = 1.96 Table 11 presents the t-test value as 45.71. This value was tested for significance by comparing it with critical t – value (1.96) at 0.05 level with 398 degree freedom. The obtained t-value (45.71) was greater than the critical t-value (1.96). Hence the result is significant. The result therefore means that there is significant difference in the expectation of the host communities of Akwa Ibom State and the benefits deliveries from relevant stake holders in the sector. The level of http://www.ijmsbr.com
Page 14
International Journal of Management Sciences and Business Research, 2014 ISSN (2226-8235) Vol-3, Issue 12
expectation of the host communities (15.96) was also observed to be more than the level of benefits deliveries from relevant stake holders in the oil sector (6.94). 5.0
Conclusion and Recommendation
The study analyzed the expectations and benefits deliveries from relevant stakeholders in the oil sector for the three oil producing communities of Esit Eket, Ibeno and Eastern Obolo LGAs of Akwa Ibom State, Nigeria. From the above findings in the study, it is obvious that, the expectations of the communities have not been satisfactorily met from oil production activities. However, employment opportunities (28.50%) was significant as the greatest expectations, which has been marginally fulfilled. Then, construction of good roads (21.75%), while building of market (5.75%) was the least. Generally, the people are not satisfied with the type of infrastructure provided in the host community. Also the study revealed that, the major provider of the infrastructures has been the government of Akwa Ibom State (48%) while mobile producing Nigeria unlimited (18.75%) and ELF Nigeria limited (9.25%). The Niger Delta Development Commission (NDDC) with 14%, being a federal government intervention agency, supports the efforts of the MOCs with its own deliveries to the host communities. Having comprehensively assessed the broad expectations and benefits of the host communities, it can be deduced that, the oil companies have performed their Corporate Social Responsibilities minimally (Fig 5) as statically inferred. The findings call for the a paradigm shift to the adoption of “bottom up” corporate partnerships by MOCs which is more efficient and effective approach to deliver on their affirmative duties than any alternative endeavour. This would most likely make more difference to sustainable community development in the study area. Furthermore, the study strongly advocates for peace building initiatives, because without enduring peace, oil production and distribution cannot be sustained. Peace would encourage more productive activities that would enable wealth creation vis-à-vis the positive transformation of the oil producing communities in the study area. 6.0
References
Akpan, N. S. And E. M. Akpabio (2003). Youth Restiveness and Viloence in the Niger Delta Region of Nigeria: Implications and Suggested Solutions. International Journal of Development Issues. 2(2): 37-58. Center for South Asian Studies (CSAS), School of Economics and Political Science, University of Sydney, Australia Auti, R. (2001). Resource Abundance and Economic Development. Oxford. Oxford University Press. Blammer, H (1998). Symbolic Interactionism, Prentice Hall, Eaglewood Cliffs N.5 p.11 Denzin, N. (1971). Logic of Naturalist inquiry Social Forces 50 p.26 Di John, J. (2007). Oil abundance and violent political conflict: a critical assessment. Journal of Development Studies, 43(6) Ekanem, M. E. (2010). Akwa Ibom State: A Geographical Perspective(1st Edition). Immaculate Publication Limited, p.99. Foxcroft, G. (2005). Does Exxon Mobil Care? A critical examination of perspectives of corporate citizenship in Akwa Ibom state. Unpublished MRes. Department of Geography, Lancaster University, UK Fryanas, J. G. (2000). Oil in Nigeria: Conflict and Litigation between Oil Companies and village communities. LIT: Muster. Hammond, A (1995). World Resources, A Guide to the Global Environment, Oxford University Press, p.10 Herring Shaw, V. (2004). Natural Resources-Curse or Blessing. New Economy 3 (09), 174-177.
http://www.ijmsbr.com
Page 15
International Journal of Management Sciences and Business Research, 2014 ISSN (2226-8235) Vol-3, Issue 12
Idemudia, U. (2010). The state and corporate social responsibility in the Niger Delta: facilitating or inhibiting? In Aaron, K. K. & D. George (eds). Placebo as Medicine, the poverty of development intervention and conflict resolution strategies in the Niger Delta region of Nigeria. Kemuela Publications, Nigeria. Idemudia, U. and U. Ite (2006). Corporate-Community Relations in Nigeria‟s Oil Industry: Challenges and Imperatives. Corp. Soc. Responsib. Environ. Mgmt 13, 194-206 Karl, T. (1997). The paradox of plenty: oil booms and petro-states. Berkeley, Los Angeles: California University Press. Luciani, G. (1987). Allocation vs. Production states: a theoretical framework. In H. Beblawi and G. Luciani (eds). Rentier state. Croom Helm: London, pp 63-82. Moore, M. (2004). Revenues, state formation and the quality of governance in developing countries. International Political Science Review 25 (3): 297-314. NPC (1996). Census. Nigerian National Population Commission. Abuja Obi, C. (2008). Is petroleum „oiling‟ or obstructing democratic struggles in Nigeria? CODESRIA 12th General Assembly: Governing the African Public Sphere. Yaounde, Cameroun. 07-11/12/2008. Omoweh, D. A. (2005). Shell development company, the state and underdevelopment of Nigeria‟s Niger Delta: a study in environmental degradation: Trenton and Asamara: Africa World Press Inc. Poston, R. W. (1962). Democracy Speaks many tongues: Community Development Around the World. N. Y. Harper and Row Publishers. 1962 pp. 180-181. Ross, M. (2001). Does oil hinder democracy? World politics. 53: 325-361. The population Census of Nigeria (2009). 2006 Population Census of the Federal Republic of Nigeria. Ukeje, C. (2001). Oil communities and political violence: the case of ethnic Ijaws in Nigeria‟s Niger Delta. Terrorism and Violence. vol. 13: 4 USAID (2006). Issues in Poverty Reduction and Natural Resources Management. Natural Resources Information Clearinghouse. Washington DC. Vander Wal, H., Moning, K. J. (1999). “Environmental Policy and The Social Dimensions of Sustainable Development in OECD Seminar, Social and Environmental Interface Proceeding, pp. 22-24, Sept. 1999. Watts, M. (2004). Resource Curse? Governmentality, oil and power in the Niger Delta. Geopolitics. vol. 9: 1 World Bank (2001). Africa Rural Development Strategy, Vision to Action Update. World Bank, Washington, D.C Nimeo.
http://www.ijmsbr.com
Page 16