Further, Chaudhury and Singh (2012) point to the impact of economic reforms in ...... through the high NPA levels in these sectors, Finance Minister Arun Jaitley.
International Journal of Management Sciences and Business Research, March-2017 ISSN (2226-8235) Vol-6, Issue 3
Galloping Non-Performing Assets Bringing a Stress on India’s Banking Sector: An Empirical Study of an Asian Country Author Details: Dr. Madan Lal Bhasin Professor, School of Accountancy, College of Business, Universiti Utara Malaysia (UUM), Sintok, Kedah, Malaysia Abstract: A well-organized and efficient banking system is an essential pre-requisite for the economic growth of every country. Galloping levels of Non-performing assets (NPAs) is one of the biggest problems faced by the Indian banking industry. The “stressed balance-sheet and bad-loan accounts” that have been hidden till now, would keep the NPA levels rising spread over 3-5 years. As on March 2015, gross NPAs stood at 4.6% and 5.17% of advances, while the stressed assets (NPAs + restructured loans) were 13.2%. It is estimated that the total quantum of stressed assets is about Rs. 10,000 billion. Undoubtedly, mounting NPAs and bad loans in the banking sector have been the focus of media headlines, which is directly affecting their balance sheets (higher provisions), and impacting the economy as well. Concern about asset quality has been one of the biggest challenges for the Indian regulator too. The extent of the challenge for nationalized banks is that “non-action is no longer an option.” In fact, India is seeing a regulatory upheaval in the way the Government and RBI are addressing the present crisis. The efforts are visible, but the results may be achieved only on a medium- to long-term basis. We feel there is an urgent need to solve the rising levels of NPAs and put a roadmap to control the reasons which lead to creation of such high NPAs. Some estimates suggest that around 35-40% of the stressed assets will require being written-off, and hence, banks need to recapitalize to that extent. This research paper explores an empirical approach to the analysis of NPA of public, private, and foreign sector banks in India. As part of this study, we have considered NPAs in Scheduled Commercial Banks, which includes 26 public-sector (nationalized) banks (PSBs), 5 private-sector scheduled banks (PVBs) and 10 scheduled foreign-banks (FBs), which are listed in the Second Schedule of the Reserve Bank of India Act, 1934. This study is based on data for sampled banks in India for a period of 5 years, from the FY ended 2010-2011 to FY ended 2015-2016. Some statistical tools have been used for analyzing the trend of NPAs of all banks in India. The present study is primarily qualitative, analytical and descriptive, which is based on secondary sources of data. Findings of our study reveals that “extent of NPAs is very high, specifically in PSBs, as compared to PVB and FBs. Some banks have already started adopting predictive and pre-emptive strategies to improve asset quality to minimize NPA levels, but still a lot needs to be done to curb this vicious problem. We suggested all banks to adopt and implement the regulator policy measures of RBI in „true-spirit and substance‟; not just form.” Undoubtedly, the road to recovery is very long and winding, but bankers are optimistic that NPA situation will improve in the near future, albeit at a slow pace. Keywords: Banks, Non-performing assets, stressed assets, assets quality, bad loans, restructured loans, impaired loans, public, private and foreign sector banks, RBI.
INTRODUCTION Banks are the engines that drive the operations in the financial sector, money markets and growth of an economy. In modern era, banking industry plays an important role in the functioning of organized money markets, and also acts as a conduit for mobilizing funds and channelizing them for productive purposes. ―A well-organized and efficient banking system is an essential pre-requisite for the economic growth of every country due to their role in credit intermediation process, payment and settlement systems, and monetary policy transmission,‖ says Bhasin (2016). Therefore, stability of the banking system and viability of banking industry is considered to be of paramount importance for the financial stability, as well as, the speedy growth of the economy as a whole. Across the globe, in fact, the banking sector acts as the catalyst for the country‘s economy. ―In emerging economies (like India), banks are more than mere agents of financial intermediation and carry out the additional responsibility of achieving the government‘s social agenda. Because of this close relationship between banking and economic development, the growth of the overall economy is intrinsically correlated to the health of the banking industry,‖ stated Bhasin (2016a). During the high growth phase of the economy from 2002 to 2008, credit growth in the Indian banking sector was in excess of 22 per cent. Unfortunately, high growth phases are usually accompanied by the generation of Stressed Assets (SA) within the banking sector. A http://www.ijmsbr.com
Page 1
International Journal of Management Sciences and Business Research, March-2017 ISSN (2226-8235) Vol-6, Issue 3
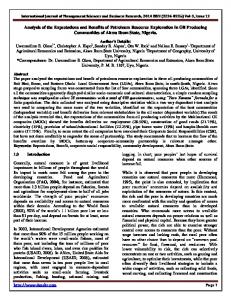
slackening in the economic growth rate has resulted in both, a lower credit demand as well as a receding appetite on the part of the banking industry, to extend credit. Thus, banks are faced with the challenging task of maintaining/increasing credit off-take to fuel GDP growth, while also ensuring loan quality is not compromised. The ―Financial Stability Report (2016)‖ of the RBI stated that ―deteriorating asset quality and weak corporate profit have increased risks to the banking sector in recent months.‖ Recently, bank credit growth has fallen to single-digit and unfortunately increase in profits has been due to decline in growth of operating expenses rather than a rise in growth of income. The profitability of Public Sector Banks (PSBs) has declined significantly. Both Return on Assets (RoA) and Return on Equity (RoE) of Scheduled Commercial Banks (SCBs) have continued to decline, as can be seen from Table 1. Profit after tax (PAT) of SCBs declined due to lower growth in earnings before provisions and taxes (EBPT) and higher provisions and write-offs. Among the bank groups, Profit after Tax (PAT) declined by 22.7 per cent for PSBs, whereas, it increased by 11.5 per cent for Private Banks (PVBs) and 4.6 per cent for Foreign Banks (FBs) during the same period. Table 1: Profitability of Scheduled Commercial Banks (SCBs) in India
(Note: RoA and RoE are ratios, whereas growth is calculated on a y-o-y basis. Source: RBI Financial Stability Report)
―India is one of the fastest growing economies in the world, and is set to remain on that path, backed by growth in infrastructure, industry, services and agriculture. To support this growth, credit flow to various sectors of the economy has been increasing,‖ said Bhasin (2015). Indeed, strong and sustainable credit growth is almost synonymous with a healthy operating environment and strong economic growth. Banks have extended higher credit to the sectors that have high-leverage and weak debt-servicing capacity putting further strain on asset quality of the banks. The macro stress test for credit risk suggests that under the baseline scenario, the Gross NPA ratio may rise to 5.4 per cent by Sept. 2016 before improving. However, if the macro-economic conditions deteriorate, the Gross NPA ratio may increase further to 6.9 per cent by March 2017. In that case, PSBs may record the lowest ―Capital to Risk weighted Assets Ratio‖ (CRAR) of around 9.4 per cent by March 2017, as against 11.5 per cent as of Sept. 2015. This trend, by and large, leads to healthy and profitable asset creation within the economy and the banking sector. However, high growth phases are also when Stressed Assets (SAs) are generated within the banking sector. This is due to excess capacity creation, easy availability of credit, less strict underwriting and easier monitoring during such a phase. This SA accumulation is, however, masked by strong credit growth. As a result, SAs look very low during this growth phase of the economy. A period of downturn reverses this trend of low SA levels and asset quality concern increases as the growth in SA outpaces credit growth in the banking system. Shockingly, SAs among PSU banks have reached an alarming proportion of approximately 112 per cent of equity, whereas the same figure for private banks (PVB) is manageable at about 50 per cent of equity. In this era of global connectivity and quick transmission of shocks, therefore, banks need to monitor asset quality very closely to ensure smooth functioning and spot any aberrations. ―Banks today have started adopting many predictive and preemptive strategies to improve asset quality to specifically minimize NPA levels. A prerequisite for this is to monitor the entire asset life-cycle very closely,‖ says Venkatesh (2017). http://www.ijmsbr.com
Page 2
International Journal of Management Sciences and Business Research, March-2017 ISSN (2226-8235) Vol-6, Issue 3
Table 2: The Outstanding Performers of Indian Banks for FY 2017
Some of the key performance parameters of outstanding performers belonging to the Indian banking industry for the Q1 FY 2017 are as summarized in Table 2. Most of the banks have marginal increase (or de-growth) in terms of revenue, except for few banks like Yes, Kotak, Indusind and HDFC, which have a high net interest margin (above 3.4 per cent). As Credit growth has slowed, most PSBs have seen a revenue cut. From the perspective of deposit and credit growth, Yes Bank, Lakshmi Vilas, Kotak, Indusind, HDFC, DCB and Axis have more than 15 per cent growth in terms of deposits and credits. However, in most cases, credit growth has been better than deposit growth, as loans are cheaper now and deposits are not worth it! The Reserve Bank of India (RBI) has cut the rates by 1.5 per cent in the last two years. Besides, the banks have been more cautious and cutting on lending, they want to clean their books before getting into fresh lending. Moreover, Net Interest Margin typically boils down to their efficiency in revenue. Higher the net interest margin, higher the revenue generation. Kotak, HDFC, DCB, CUB have a very high net interest margin (above 4%) and have been doing outstandingly well in this parameter. In fact, banks which have very minimal exposure to corporate loans (having high retail loans) have the least NPAs. Yes Bank, IndusInd, HDFC, Kotak, Axis, Federal, Lakshmi Vilas, DCB and CUB all have gross NPA‘s below 3 per cent. SBT, Andhra Bank and Axis Bank have seen a drastic increase in NPA recognition. Even, DCB is having higher slippages. Federal bank has reported NPA slippages well within 8 per cent, indicative that, they are comparatively more stable with NPA recognition and might not add higher NPA‘s in coming months. From the view point of Provision Coverage Ratio (PCR) and Provision Growth, some banks which have lower NPAs and have good profits are comfortable with higher provisioning, like DCB (75.25 per cent), Federal (72.09 per cent), Axis (69 per cent), etc. The other interesting thing to look at is the so called ―Safe Banks‖ like HDFC, Axis and Lakshmi Vilas Bank, which are having the lowest NPA per cent, have shown a higher degree of provisioning. For CAR, anything above 14% is outstanding: a bank can sustain for another couple of quarters even with higher provisioning. Kotak, Indusind, Yes, HDFC, City Union, SBI, Axis, BoB fall in this safe category. Figure 1: Impaired Loans of SCBs
http://www.ijmsbr.com
Page 3
International Journal of Management Sciences and Business Research, March-2017 ISSN (2226-8235) Vol-6, Issue 3
(Note: GNPAs: Gross Non Performing Assets, Source: RBI database, CPR research) The term ‗non-performing asset‘ (NPA) used in India corresponds to the term ‗non-performing loans‘ (NPL) in the academic literature. So, we would be using these two terms interchangeably in our study. The overall ―Impaired Loans‖ (viz., Non-Performing Assets and Restructured assets) in the banking sector increased to 11.3 per cent in the quarter ending September 2015 as compared to 9.9 per cent in the FY 2014, and 3.4 per cent in the FY 2008—with PSBs having a much higher share (see Figure 1). For the PSBs, impaired asset ratio stood at 15.4% as of Sept. 2015. Banks‘ gross NPAs (GNPAs) jumped to 7.6 per cent of total advances by March 2016, from 5.1 per cent in Sept. 2015. Including restructured standard advances, overall stressed loans rose marginally to 11.5 per cent in March 2016 as against 11.3 per cent six months ago. ―The stress is the highest in the industrial sector. Other stress tests conducted by the central bank suggest further pain in store, with baseline projection pointing to GNPA of 8.5 per cent by March 2017, which could worsen the ratio to 9.3 per cent in a severe stress scenario,‖ said Radhika Rao, Economist, DBS Bank, as reported by Mathew (2017) in his media report. In the last one year banks have been classifying stressed loans as standard assets with the help of the flexible restructuring and the conversion of debt to equity scheme. It is reported that stress advances ratio for PSBs rose to 14.1 per cent while the same for the private sector banks (PVB) remained broadly flat at 4.6 per cent in the quarter Sept. 2015. Stressed Balance Sheet of the Indian Banks There is no doubt that a strong banking sector is important for a flourishing economy. Recently, Bhasin (2016b) stated, ―The banking system in India consists of Commercial Banks (CBs) and Cooperatives Banks of which the Commercial Banks (CBs) account for more than 90 per cent of the banking system‘s assets. Based on the ownership pattern, the CBs can be grouped into three types, i.e., (a) State owned or Public Sector Banks (PSBs)—that is the State Bank of India (SBI) and its subsidiaries, and the nationalized banks (there are 27 PSBs functioning in the country as on 31.3.2014), (b) Private Banks (PVBs) under Indian ownership, and (c) Foreign Banks (FBs) operating in India.‖ The PSBs dominated the banking business in the country.‖ Balance sheets of the Indian banks have been weighing down with high-levels of impaired loans, which are expected to impact their ability to extend credit to the productive sectors of the economy thereby hurting the pickup in private capex (Kumar et al., 2016). Moreover, Gynedi (2014) warns that ―asset quality in India‘s banks has deteriorated sharply and if not tackled promptly poses a systemic risk to the banking system—and by extension the Indian economy. A high proportion of NPAs steadily erodes the capital base of a bank, impinging on the ability of banks to raise fresh capital and continue lending for investment activities. Indeed, the spillover impact from banking crises to the real-economy are all too familiar, evinced by the subprime mortgage crisis in the United States.‖ The PSBs, which account for over 70 per cent of the banking system in India, faces concerns regarding their profitability, asset quality, capital position and governance despite several measures taken to distress the sector. Now, stressed assets (SAs) are getting increased attention as the trend of deteriorating asset quality has emerged as a big economic risk for the Indian banking sector. In fact, SA is a powerful indicator of the health of the banking system. Hence, a new classification is made in the form of SAs that comprises restructured loans and written-off assets besides NPAs. Indeed, SAs in India have almost doubled from 5.7 per cent in FY 2008 to 10.2 per cent in FY 2013, which has impacted the banking industry adversely. However, the ratio of stressed assets to gross advances of the Indian banking system is increasing from 2013 onwards. It has risen from around 6 per cent at the end of March 2011 to 11.1 per cent by March 2015. Shockingly, the PSBs have the highest stressed asset ratio 13.5 per cent of total advances as of March 2015, compared to 4.6 per cent in the case of PV banks. As decline in asset quality has been a key area of concern for the banking sector in general and PSBs in particular, several regulatory measures to de-stress banks‘ balance sheets have been taken in the recent years, http://www.ijmsbr.com
Page 4
International Journal of Management Sciences and Business Research, March-2017 ISSN (2226-8235) Vol-6, Issue 3
including in the year 2014-15. The basic ―Framework for Revitalizing Distressed Assets in the Economy‖ was released by the RBI in Jan. 2014. Following this, several regulatory steps were taken, which were aimed at instituting a mechanism for rectification, restructuring and recovery of SAs. These involved the preparation of a corrective action plan by the Joint Lenders‘ Forum (JLF) for distressed assets, periodic refinancing and fixing a longer repayment schedule for long-term projects as part of flexible structuring, extension of the date of commencement of commercial operations in the case of project loans to infrastructure sector without these loans being labeled as non-performing advances subject to certain conditions, strategic restructuring of debt involving the provision to convert debt into equity, issuance of guidelines about classification of willful defaulters and non-cooperative borrowers, among others. (RBI, 2014a) While the Indian banks are in the process of migrating to capital standards, as prescribed under the Basel III framework, the implementation of liquidity standards marks the second important step in implementing the package of reforms suggested by the ―Basel Committee on Banking Supervision‖ (BCBS). Following the final guidelines from the RBI, the liquidity coverage ratio (LCR) was made operational as part of the Basel III framework on liquidity standards on Jan. 1, 2015. The compliance to this ratio has been made easier for banks as a part of their Statutory Liquidity Ratio (SLR) investments has been deemed eligible to be classified as high quality liquid assets. Furthermore, the RBI also prescribed liquidity monitoring tools and liquidity disclosures for strengthening the liquidity management by banks. Fortunately, India has been in the forefront in terms of adopting capital adequacy norms, as per the Basel III framework, and has in fact stipulated a higher Capital-toRisk-Weighted Assets Ratio (CRAR) than what is recommended by the BCBS. In Jan. 2015, it also introduced a simple, back-stop, non-risk based measure of leverage in the form of an indicative Leverage Ratio of 4.5 per cent as part of a parallel run till the final norms for the same are prescribed by the BCBS. This ratio is expected to supplement the risk-based CRAR in monitoring excessive risk-taking and build-up of on and off-balance sheet leverage by banks. In January 2016, the BCBS published its last update ―Minimum capital requirements for market risk,‖ on the revised minimum capital requirements for market risk, which represents a key outstanding element of the postcrisis reforms. All banks are required to finalize the implementation of the revised market risk standards by January 2019 and to start reporting under the new standards by the end of 2019. In the final version of the regulation, most of the risk factors pertaining to the sensitivity-based method have been amended. The most notable change refers to the treatment of Credit Spread Risk (CSR) that has been softened by reducing the risk weights and making securitizations less capital-consuming. According to the BCBS, banks would have to increase their capital for trading books by about 40%, while in a previous draft of the rules the rate was 74 per cent. Nevertheless the securitizations are still subject to the Standardized Approach (SA), making their capital requirements severely expensive. And as Residual Risk Add-On (RRAO) impacts heavily on the overall capital charge, the regulator has reduced the weights in the calculation formula (1 per cent weight for exotic instruments and 0.1 per cent for ―others‖) to soften the RRAO‘s impact on capital. The BCBS has also brought clarity to areas such as cross currency basis risk by establishing a single cross currency basis (over USD or over EUR). Unfortunately, the new release of the regulation doesn‘t address some principal concerns like asymmetric correlations which may lead to unrealistic charges or credit risk double counting. Recently, Bhasin (2017) stressed, ―The RBI, as a national regulator, has been actively involved in tackling this situation through various ways, such as instructing reviews of banks to identify the loopholes in the due diligence process, or mandating forensic audits for large corporates to identify the intent of key decisionmakers, or enhancing the scope of regulations around ‗willful‘ defaulters.‖ More recently, it is allowing banks to take equity control for companies that fail to repay (strategic debt restructuring). The following initiatives by the regulator were perceived to be the most relevant in improving the NPA crisis situation: (a) Strengthening the procedure of appointment of top executives of public-sector banks, (b) Empowering lead bankers to conduct project appraisals for all the lenders in the consortium set up for sanctioning corporate loans above Rs. 500 http://www.ijmsbr.com
Page 5
International Journal of Management Sciences and Business Research, March-2017 ISSN (2226-8235) Vol-6, Issue 3
cores, (c) Tightening the provisioning norms for restructured loans, and (d) Expanding the coverage of ―willful defaulters‖ What are Non-Performing Assets (NPAs)? In the traditional banking business of lending financed by deposits from customers, Commercial Banks (CBs) are faced with the risk of default by the borrower in the payment of either principal or interest. This risk in banking parlance is termed as ‗Credit Risk‘ and accounts where payment of interest and/or repayment of principal are not forthcoming are treated as ―Non-Performing Assets‖ (NPAs). The unabated rise in stressed assets of the Indian banking sector is a cause for concern for the economy. Indeed, existence of NPAs is an integral part of banking and every bank has some Non-Performing Assets in its advance portfolio. However, the high level of NPA is a cause of worry to any financial institution. A non-performing asset is a loan or advance for which the principal or interest payment remained overdue for a period of 90 days. Banks are required to classify NPAs further into three groups: (a) Substandard assets: Assets which has remained NPA for a period less than or equal to 12 months. (b) Doubtful assets: An asset would be classified as doubtful if it has remained in the substandard category for a period of 12 months (c) Loss assets: As per RBI, ―Loss asset is considered uncollectible and of such little value that its continuance as a bankable asset is not warranted, although there may be some salvage or recovery value.‖ Further, the following factors confronting the borrowers are responsible for incidence of NPAs in the banks: • Diversion of funds for expansion/modernization/setting up new projects/helping promoting sister concerns. • Time/cost overrun while implementing projects. • External factors like raw-material shortage, raw-material/Input price escalation, power shortage, industrial recession, excess capacity, natural calamities like floods, accident etc. • Business failures like product failing to capture market, inefficient management, strike/strained labor relations, wrong technology, technical problem, product obsolescence, etc. • Failure, non-payment/over dues in other countries, recession in other countries, externalization problems, adverse exchange rate, etc. • Government policies like excise, import duty changes, deregulation, pollution control orders, etc. • Wilful default, siphoning of funds, fraud, misappropriation, promoters/management disputes etc. Besides above, factors such as deficiencies on the part of the banks viz., deficiencies in credit appraisal, monitoring and follow-up; delay in release of limits; delay in settlement of payments/subsidies by Government bodies, etc. are also attributed for the incidence of NPAs. Indeed, the NPA problem is one of the most severe plaguing the Indian Banking sector posing questions over the stability of Indian banking system. Raghuram Rajan, the ex-Governor of RBI has identified ―the NPA problem as a major challenge facing the Indian banking sector.‖ The problem, which was largely hidden earlier as banks used to do window-dressing of their account statement, (Bhasin 2016c) has now come to the forefront after Rajan exhorted the banks to ―clean up their asset books by March 2017.‖ Resultantly, this led to 29 PSBs writing-off Rs. 1.14 lakh crore of bad-debts between 2013-2015, much more than what they had done in the preceding nine years. Some of the key highlights relating to NPAs are: The gross bad loans of 39 listed Indian banks, in absolute term, rose 92 per cent in fiscal year 2016 to Rs.5.79 trillion even as after provisioning, the net bad loans more than doubled to Rs.3.38 trillion. In percentage terms, the average Gross non-performing assets (NPAs) of this group of banks rose from 4.41 per cent of loans in 2015 to 7.91 per cent in 2016. However, Net NPAs in the past one year rose from 2.45 per cent to 4.63 per cent. Public sector banks (PSBs), which have close to 70 per cent market share of loans, are more affected than their private sector peers. Two of them have over 15 per cent gross NPAs and an additional eight close to 10 per cent and more. http://www.ijmsbr.com
Page 6
International Journal of Management Sciences and Business Research, March-2017 ISSN (2226-8235) Vol-6, Issue 3
If we include restructured loans as well as those loans that have been written off, the total stressed assets could be as much as one-fourth of loans, at least for some of the government-owned banks.
Figure 2: NPA’s in Public Sector Banks of India during 2011 to 2015
Figure 2 shows how quickly non-performing assets in PSBs rose more than five times to Rs. 3.6 lakh crore in 2015 from just Rs. 71,000 crore in 2011. As the NPAs in the banks rose, their quality of lending also seems to have worsened. The numbers show that more than 5 per cent of all lending done by PSBs was classified as NPAs by 2015 while the ratio was a mere 2.3 per cent in 2011. It is also important to note here that this ratio has been falling since 2001 when it was 13.11 per cent before it started rising in 2011. According to EY (2015) Report, ―Wrong borrower selection, herd mentality of the bankers and lure of high real estate returns have driven the borrowers to fund illiquid/long gestation acquisitions through short term bank funds, leading to collapse of the system.‖ Analyzing the gravity of the current situation, pre-sanction due diligence and sanctioning process have also been under the scanner of the regulator to gauge the control mechanism at banks. High value loans have gone bad, in spite of large banks either being part of the multiple lending arrangements or under a consortium. So, the question remains, is the rise in NPAs due to internal lapses in due diligence at banks or are complexities of business making it difficult to detect issues/any wrong doing by the borrowers at an early stage? Unfortunately, the borrowers are taking advantage of the slow and complicated legal process. Even if there are no stressed accounts, they mis-utilized it to their advantage due to the weak frameworks. Rise in customer base, multiple product offerings and regulatory pressures led to the implementation of ―Core Banking Solutions‖ (CBS 2016). The number of public sector bank branches in India with CBS implementation increased from 79.4% in March 2009 to 90% in March 2010. However, NPA tracking and flagging continued to be part of manual compilation, which in effect was prone to errors and manipulation. ―With the advancement of technology-based solutions, banks moved to system-based identification of NPAs with limited manual intervention. However, this led to a sudden spurt in the NPA reporting for some of the large banks, which has raised concerns over the system used for tracking,‖ added Bhasin (2013a). Global Comparison of NPAs The performance parameters of the Indian banks had steadily improved till 2009 approaching international standards and were among the better performers in the emerging market group. However, it started deteriorating after 2011, as shown in Table 3. According to Kumar, Krishna and Bhardwaj (2016), ―The banking sector‘s gross non-performing asset (GNPA) ratio, which is the value of non-performing loans divided by the total value of the loan portfolio, stood at 4.2 per cent as of the end of 2015. In India, the ratio bottomed out only in 2009 (versus 2007 for the world). Moreover, until 2011, the worsening of bank asset quality in India was modest by global standards. In contrast, since 2012, the ratio in India has been rising sharply and had nearly touched the global average. World Bank data on country-wise bank asset quality is available up to 2013. Till that year, the http://www.ijmsbr.com
Page 7
International Journal of Management Sciences and Business Research, March-2017 ISSN (2226-8235) Vol-6, Issue 3
ratio in India was lower than the world average, albeit marginally. In contrast, the emerging markets of Brazil and Indonesia only recorded an NPA of 3.1 per cent and 2.3 per cent, respectively during the same period. The disturbing fact is that the NPA in India has inflated to almost twice its size since 2010, while the same metric for its peers (Brazil, Indonesia and South Africa) remained steady or moved in the opposite direction. Table 3: Cross-Country Comparison of NPA to Total Loans (%) Country 2005 2006 2007 2008 2009 2010 Brazil 3.5 3.5 3.0 3.1 4.2 3.1 China 8.6 7.1 6.2 2.4 1.6 1.1 Euro area 1.8 1.3 1.8 2.8 4.8 5.4 Indonesia 7.3 5.9 4.0 3.2 3.3 2.5 India 5.2 3.5 2.7 2.4 2.2 2.4 Japan 1.8 1.8 1.5 2.4 2.4 2.5 Russia 2.6 2.4 2.5 3.8 9.5 8.2 United States 0.7 0.8 1.4 3.0 5.0 4.4 South Africa 1.8 1.1 1.4 3.9 5.9 5.8
2011 3.5 1.0 6.0 2.1 2.7 2.4 6.6 2.8 4.7
2012 3.4 1.0 7.5 1.8 3.4 2.4 6.0 3.3 4.0
2013 2.9 1.0 7.9 1.7 4.0 2.3 6.0 2.5 3.6
2014 2.9 1.2 6.8 2.1 4.3 1.9 6.7 1.9 3.2
(Source: World Bank Report)
Why Worry About NPAs? : Potential Consequences The unabated rise in stressed assets of the Indian banking sector is a cause for concern for the economy. Empirically, high level of NPAs has been found to be associated with contraction of credit, slow-down of GDP growth, depreciation of exchange rates, inflation and unemployment (Bock and Demyanets 2012, Klein 2013). The quantum and growth in gross NPA of banks has been inhibiting not just banks profitability, growth, health and solvency but also the overall investments and economic progress of the country (FICCI 2016). The impact starts with the pressure NPAs create on the income statement and balance sheet of banks. • Profitability: NPAs affect the profitability of the banks adversely by way of affecting both income and expenses. A high NPA means the asset is not performing or bringing in the interest income it was expected to bring. Income from NPAs can be booked only on actual realization of the same and not on accrual basis. So this will have an adverse impact on bank‘s interest income. A lower interest income would lead to lower total income and hence, lower net profits. From expenses point of view, a high NPA means higher provisioning requirements as well as higher expenses involved in NPA recovery process (like litigation and administrative costs), both of which would reduce the net profits. • Capital Adequacy: Reduction in profits due to high NPA is likely to result in lower retained earnings, which in turn is likely to create adverse effect on Tier 1 component of CRAR. Moreover, Total Risk Weighted Assets (TRWA) increase because of the risks attached to NPA portion of the total asset composition. Increase in TRWA with absolute amount of capital funds remaining intact is likely to bring down CRAR. • Liquidity and Credit growth: Lower profits or earnings arising from NPAs also boils down to lower cash inflow, thereby impairing bank‘s liquidity. Poor liquidity together with pressure on profits and capital adequacy adversely affects the willingness and ability of the banks to expand its loan portfolio. Reluctance on the part of banks to grant loans can spill over to the economy in the form of credit rationing and credit crunch. • Stock prices and Solvency: High NPA signals weakness in asset quality of banks and is likely to bring down the stock prices of banks because the investors would perceive assets of such banks to be of high risk. From Table 4, we can see that with decrease in NPA ratios in 2011 over 2010, the performance measures like ROA, CRAR and loan growth experienced an improvement whereas with increase in NPA ratios in 2013 over 2012, the same measures namely ROA, CRAR and loan growth registered a deterioration. Here, Arpita Ghosh (2014) reported as: ―So, NPAs can worsen the financial performance of a bank by way of its adverse impact on http://www.ijmsbr.com
Page 8
International Journal of Management Sciences and Business Research, March-2017 ISSN (2226-8235) Vol-6, Issue 3
bank‘s interest income, higher provisioning requirements and higher expenses involved in NPA recovery. It can also create a dent into the capital adequacy ratio of a bank and impair its liquidity, its growth and its ability to raise funds from the market. All this can have an adverse effect on the solvency as well the stock prices of the bank. Similarly, if we extend the potential impact of deteriorating asset quality of banks at macro level, it can amount to adversely affecting the credit growth in the economy and therefore, leading to an unfavorable impact on the macro-economic factors like GDP growth. Moreover, bailing out of the banks whose assets are stressed through means of capital infusion by government can also turn out to be a heavy burden on the fiscal position of the government. In fact, the burden has to be ultimately borne out by the taxpayers of the country sooner or later. Table 4: Key Implications of NPAs on Banks Average of all SCBs (excluding foreign banks) GNPA to Gross Advances NNPA to Net Advances ROA (Profitability) CRAR (Capital Adequacy) Loan Growth
2010 2.30 1.03 0.96 14.77 20.77
2011 2.02 0.82 1.05 15.44 28.09
2012 2.35 1.09 1.02 13.81 32.55
2013 2.70 1.49 0.98 13.27 17.35
Impact of NPAs on Banks NPA impact the performance and profitability of banks. If NPAs are increasing, this will have serious effects on future credit growth, as banks would develop cold feet in extending credit to sectors exhibiting higher NPAs. This is particularly true for some sectors, such as agriculture and SMEs. Further, if higher NPAs lead to higher write-offs, this will have negative effects on those who repay their loans promptly, and create a moral hazard problem. Thirdly, under Basel III, higher NPAs would require higher provisioning, and therefore, higher economic capital. For the public sector banks, this is going to pose additional challenges, given the fiscal situation. Hence, meaningful reduction and containment of NPAs within a reasonable limit is very important at the current juncture. Among the banking groups, the deterioration is pronounced for public sector banks, followed by foreign banks. Today, 70 per cent of the banking system is paralyzed. The state-controlled banks have no ability to take on additional risk—they are not capitalized to do so, and that is a very serious issue for the economy. Slippage ratio, calculated as the addition of Gross NPAs during the year as a percentage of outstanding standard assets of the previous year, is an important indicator of asset quality. This has increased from 2.0 at end March 2011 to 2.5 at end March 2012 and further to 3.04 at end June 2012. NPAs recovered remained stagnant at about 57 per cent in 2012 as against 59.8 per cent during 2011-12. The written-off ratio, defined as NPAs written-off during the year as a percentage of gross NPAs outstanding at the beginning of the year, reached a peak of 14.9 per cent in 2009-10 and since then this started declining and stood at 4.4 per cent during 2011-12. The written-off amount is quite significant for private sector banks, compared with public sector banks, keeping the total gross advances lent by them (Kanan 2013). 1. Banks have to adhere to the provisioning norms set by RBI for the bad loans, which eats into their profitability. This leads to banks having lesser capital to deploy, shareholders losing money and banks finding it tough to survive in the market 2. If banks do not classify an asset as NPA, they naturally have more money to advance to earn interest income on. If large NPAs go unreported, the bank could reach a situation, where it has advanced more money than it has available leading to a situation of technical bankruptcy. 3. In light of attaining the Bessel norms, the burden on maintaining Capital Adequacy Ratio increases 4. It also affects the competitive position of banks http://www.ijmsbr.com
Page 9
International Journal of Management Sciences and Business Research, March-2017 ISSN (2226-8235) Vol-6, Issue 3
5. For economy, it is disadvantageous as banks become more circumspect in giving loans which affect the credit off-take in economy. India is still an economy which is largely dependent on banks to raise capital as the bond market is not that well developed. This leads to declining Gross Capital Formation affecting economic growth. 6. Rising of NPAs will lead to a crisis of confidence in the market. The price of loans, i.e. the interest rates will shoot up. Shooting of interest rates will directly impact the investors who wish to take loans for setting up infrastructural, industrial projects etc. 7. It will also impact the retail consumers like us, who will have to shell out a higher interest rate for a loan. 8. This will hurt the overall demand in the Indian economy which will lead to lower growth rates and of course higher inflation because of the higher cost of capital. 9. The trend may continue in a vicious circle and deepen the crisis. Laws relating to NPA and Bankruptcy: A Birds Eye View
SARFAESI: The Securitization and Reconstruction of Financial Assets and Enforcement of Security Interest Act empowers Banks/ Financial Institutions to recover their NPAs without the intervention of the court, through acquiring and disposing secured assets without the intervention of the court in case of outstanding amounts greater than 1 lakh. SARFAESI, it is accused, has been used only against the small borrowers primarily from MSME sector. Recovery of Debts Due to Banks and Financial Institutions (DRT) Act: The Act provides setting up of Debt Recovery Tribunals (DRTs) and Debt Recovery Appellate Tribunals (DRATs) for expeditious and exclusive disposal of suits filed by banks / FIs for recovery of their dues in NPA accounts with outstanding amount of Rs. 10 lakh and above. DRTs are overburdened leading to slow disposal of cases. Lok Adalats: Section 89 of the Civil Procedure Code provides resolution of disputes through ADR methods such as Arbitration, Conciliation, Lok Adalats and Mediation. Lok Adalat mechanism offers expeditious, inexpensive and mutually acceptable way of settlement of dispute. Banking Regulation Act: Under the Banking Regulation Act 1949, the RBI is empowered to monitor the asset quality of banks by inspecting record books.
Recovery Mechanisms of NPAs Specific measures have been taken for sectors where the incidence of NPA is high, the government said in response to the parliament question. To improve the resolution or recovery of bank loans, Insolvency and Bankruptcy Code (IBC) has been enacted and SARFAESI Act and Recovery of Debts due to Banks and Financial Institutions (RDDBFI) have been amended, the response said. Further, six new Debt Recovery Tribunals (DRTs) have been established for improving recovery. The SARFAESI Act allows banks and other financial institutions to auction residential and commercial properties when borrowers default on their payments. This helps the banks to reduce their NPA by recovery and reconstruction. Under this Act, 64,519 properties were seized or taken possession off by the banks in 2015-16. In the current financial year, as of June, the number stands at 33,928. At a time when bad loans are witnessing a surge, the rate of recovery of bad assets by banks has taken a knock. The rate of recovery of NPAs was 10.3 per cent, or Rs. 22,800 crore, out of the total NPAs of Rs. 221,400 crore during fiscal ended March 2016, against Rs. 30,800 crore (12.4 per cent) of the total amount of Rs. 248,200 crore reported in March 2015,‖ data from the RBI has said. According to the RBI, the rate of recovery was 18.4 per cent, or Rs. 32,000 crore out of the total NPAs of Rs. 173,800 crore reported in March 2014. The recovery rate was even higher at 22 per cent (Rs. 23,300 crore) in March 2013 out of the total reported NPAs of Rs. 105,700 crore, the RBI said in its database on the Indian economy. http://www.ijmsbr.com
Page 10
International Journal of Management Sciences and Business Research, March-2017 ISSN (2226-8235) Vol-6, Issue 3
The RBI said a total of 46.54 lakh cases to recover NPAs were filed in Lok Adalats, Debt Recovery Tribunals and under the SARFAESI Act. Of this, 44.56 lakh cases were taken up by Lok Adalats during fiscal March 2016. Public sector banks, which are burdened with a high proportion of the banking sector‘s NPAs, could recover only Rs. 19,757 crore as against Rs. 27,849 crore during the previous year, the RBI said. ―The deceleration in recovery was mainly due to a reduction in recovery through the SARFAESI channel by 52 per cent from Rs. 25,600 crore in 2014-15 to Rs. 13,179 crore in 2015-16. On the other hand, recovery through Lok Adalats and DRTs increased,‖ the RBI said in its ―Report on Trends and Progress in Banking‖ (2014a). To help banks recover loans or a part thereof, there are legal measures available too. These include: Debt Recovery Tribunals, which help banks resolve cases of seizure of property and assets for defaulters above Rs. 10 lakhs expeditiously The Securitization and Reconstruction of Financial Assets and Enforcement of Security Interest Act which allows banks to realize money from a lender‘s assets without going through Courts. For milder cases, there are Lok Adalats, which help with arbitration and settlement. Figure 3: Recovery of NPAs by Public Sector Banks
The chart shows that even though Lok Adalats and Debt Recovery Tribunals were able to realize as much as 30 per cent of the amount on cases filed by banks in 2011, the ratio came down to a mere 18 per cent in just four years. A time-series analysis shows that it was largely the efficiency of DRTs that came down from 21.5 per cent in 2011 to 9.83 per cent in 2014 (see Figure 3). While the ministry claims that in absolute numbers, DRTs are disposing off many more cases than before and it is only because the number of cases has fallen that the ratio of realization is dipping, it is evident that some ways are proving to be more effective than others in recovering lost money for the banks. While the government tries to force banks into disclosing and recovering their bad loans, what Raghuram Rajan told the committee on the possibility of corruption and lax norms in lending seems to sum up the situation where funds are not only being ―diverted‖ but ―stolen‖ in public eye. ―We have to go after corrupt bank managements as well as corrupt promoters,‖ Rajan said. ―There is no doubt that we need to do it. We do not have enough teeth. There are these promoters, who have diverted funds. ―Diverted fund is a euphemism. I would say plainly that they have stolen the funds, and we cannot go after them. It takes too long.‖ Review of Literature The topic of NPAs in banks has been extensively debated, researched by scholars and hotly highlighted by the media. Accordingly, many published studies and reports are available and several academic researchers have studied the issue of NPAs, from time to time, in the Indian banking industry. A brief of the different literatures available on the issue and related areas are given below in a chronological order. Balasubramaniam (2001) highlighted the level of NPAs is high with all banks currently and the banks would be expected to bring down their NPA. This can be achieved by good credit appraisal procedures, effective internal http://www.ijmsbr.com
Page 11
International Journal of Management Sciences and Business Research, March-2017 ISSN (2226-8235) Vol-6, Issue 3
control systems along with their efforts to improve asset quality in their balance sheets. However, Kaur (2006) suggested that for effective handling of NPAs, there is an urgent need for creating proper awareness about the adverse impact of NPAs on profitability amongst bank staff, particularly the field functionaries. Bankers should have frequent interactions and meeting with the borrowers for creating better understanding and mutual trust. Moreover, Vallabh, Bhatia and Mishra (2007) explored an empirical approach to the analysis of NPAs of public, private, and foreign sector banks in India. A model consisting of two types of factors, viz., macroeconomic factors and bank-specific parameters, is developed and the behavior of NPAs of the three categories of banks is observed. The results show that movement in NPAs over the years can be explained by the factors considered in the model for the public and private sector banks. The co-linearity between independent variables was measured by Durbin-Watson test and VIF characteristic and it was found to be a little for public and private banks. Beside this, Karunakar (2008) also highlighted the problem of losses and lower profitability of NPAs and liability mismatch in Banks and financial sector depend on how various risks are managed in their business. The lasting solution to the problem of NPAs can be achieved only with proper credit assessment and risk management mechanism. In fact, Kaur and Singh (2011) felt that NPAs are considered as an important parameter to judge the performance and financial health of banks. The level of NPAs is one of the drivers of financial stability and growth of the banking sector. Gupta‘s (2012) paper, however, made efforts to understanding the concept of NPAs, its magnitude and major causes for increasing NPA & to evaluate the operational performance of SBI & Associates and other Public Sector Banks during 2007-2011. He used various statistical tools like ratio, standard deviations, coefficient of variation and ANOVA test to analyze and interpret the data. Author concluded that each bank should have its own independence credit rating agency which should evaluate the financial capacity of the borrower before credit facility and credit rating agencies should regularly evaluate the financial condition of the clients. Further, Chaudhury and Singh (2012) point to the impact of economic reforms in the country on the asset quality of the banks. To test the statistical significance, ANOVA technique is used. The analysis clearly shows that there is a significant difference in the group-wise asset quality of Indian banks. Nevertheless, reforms have indeed transformed Indian banks into strong, stable and prosperous entities. In terms of groupwise results, the authors find a significant difference in their quality of loans. Samir and Kamra (2013), however, analyzed the comparative position of NPAs in selected banks namely State Bank of India, Punjab National Bank and Central Bank of India. They also highlighted the policies pursued by the banks to tackle the NPAs and suggested a multi-pronged strategy for speedy recovery of NPAs in banking sector. The researchers throw light on the significance of asset quality since it affects interest income, profitability, capital base, capitalrisk weighted assets ratio. Moreover, DTA (2014) report points to the fact that almost 86% of the bad loans in the sector were generated from the nationalized banks (56%) and SBI group (30%) as at the end of September, 2013. With respect to rising bad loans, the report points to measures like independent appraisal of all credit application cases, sensitivity analysis for infrastructure projects, increasing importance of the ARCs etc. Similarly, the reports prepared by CARE (2014, 2015) looked into the NPA trend in the Indian banking sector apart from the causes that have been responsible for the rising trend in the poor loans that we are seeing recently. Also, a brief discussion is made about the different measures that have been adopted to bring the nonperforming loans (NPLs) under control. Also, Mahajan (2014) examined the NPAs of all public, old and new private and foreign sector banks in India for 15 years period from year ended 1998-99 to 2012-13 with the help of ratios. Chakrabarti (2015) discussed the vital role of asset reconstruction companies (ARC) in managing NPAs in the banking sector in the light of the sudden rise in NPAs in the industry. The author mentions that RBI points to the fact that NPAs plus stressed assets equal almost 10% of the bank loans. The discussion focuses on the performance and the problems of the ARCs. However, Jana and Thakur (2015) looked into the trend of NPAs by studying variables like the gross and net NPA ratios on the data of the nationalized banks for the period 2008 to 2012. The study revealed that though the overall trend is negative and is, therefore, upward rising, it is http://www.ijmsbr.com
Page 12
International Journal of Management Sciences and Business Research, March-2017 ISSN (2226-8235) Vol-6, Issue 3
heterogeneous in nature. Similarly, Tripathy and Singh (2015) conducted a study of 4 banks. The data collected for NPA, CRAR, regulatory capital and capital ratio from website of RBI and banks and further analyzed to check whether banks have sufficient capital adequacy or not. The time span is 2008-2014 for NPA and CRAR and 2013-2014 for regulatory capital and capital ratios. Finally it is concluded that ―public sector banks have made enough cushion against their risk weighted assets‖. Vallabh et al. (2016) in their joint study, however, devised a unique way to forecast the NPAs in Indian banking system in 2020. The focus was to devise a model which would play a pivotal role in forecasting future NPAs in the Indian banking sector. This was achieved by looking into various methodologies and zeroing in on a model, which could be implemented to help understand how NPAs could be predicted. Another study performed by Borse (2016) attempts to correlate the NPA and ROA of Indian commercial banks, 6 Public sector banks and 5 Private sector banks, where chosen for the study. 2010-11 to 2014-15 is the study period for this study. The study concluded that ―NPA increase rate is higher in public sector banks than the private sector banks. NPA of private sector banks are well under control. This study shows that there is moderate negative correlation of NPA and ROA of Public sector banks. This means as the NPA increases it negatively affects the ROA of banks.‖ The main objectives of Sasikala and Mohanapriya (2017) study is to identify various factors are responsible for increasing the size of NPA in cooperatives. The current data is analyzed with the help of secondary data from RBI website, NPA with reference to PCUBs covering the five financial years from 2008-2009, 2009-10, 201011, 2011-12 and 2012 – 2013) & primary data is collected from respective officers form PCUB‘s through questionnaire. However, Mazumdar‘s (2017) paper states, ―Even though the aspect of NPA has been studied by researchers from time to time, the present research aims to seen whether there has been any significant effect or trend following the financial crisis that commenced in 2007 and has still not lost its grip on some major economies of the world.‖ Similarly, Roy and Samanta (2017) study tries to depict both the Gross Non Performing Asset and Net Non-Performing Asset position of Public Sector Banks in India and attempts to find whether there is any significant difference among them. This paper also tries to show the impact of GNPA on Net Profit of the selected banks for the last 5 years. The analysis carried on in this paper about GNPA shows that‖ the overall NPA position of all the banks is deteriorating over the years. Since there is a negative high correlation between GNPA and NP, the profit gradually decreases as the GNPA grows which has become a serious concern right now.‖ Research Methodology and Sources of Data As part of this research study, we have collected the relevant data‘s and analyzed the NPAs in Scheduled Commercial Banks, which includes 26 public-sector (nationalized) banks (PSBs), 5 private-sector scheduled banks (PVBs) and 10 scheduled foreign-banks (FBs), which are listed in the Second Schedule of the Reserve Bank of India Act, 1934. The study is based on time-series data for the sampled banks in India for a period of 5 years from the year March ended 2010-2011 to March ended 2015-2016. Some statistical tools have been used for analyzing the trend of NPAs of all banks in India. The present study is primarily qualitative, analytical and descriptive in nature and it is based on secondary sources of data. Moreover, several reputed research journals, including research paper and articles, have been extensively used by the researchers. Also, the relevant data have been collected from RBI publications like Annual Report on Trends and Progress of Banking in India, Annual Report of RBI, and various publications of RBI like RBI Bulletin, IBA Bulletin, websites and magazines. An attempt is made in this paper to analyze the factors contributing to NPAs, the magnitude of NPAs, reasons for high NPAs and their impact on Indian banking operations, relationship between NPAs and business cycles, GDP, Interest rates, etc. and finally, to provide suitable suggestions to reduce NPAs in commercial banks. This paper also makes an attempt to study the most significant factors contributing towards the problem of NPAs http://www.ijmsbr.com
Page 13
International Journal of Management Sciences and Business Research, March-2017 ISSN (2226-8235) Vol-6, Issue 3
from the point of view of top bankers from public and private sector banks in India plus foreign banks and the measures required for the management of NPAs. Broad objectives of the study are: • • • • •
To study the concept of Non-Performing Assets and its main impact on Indian Banking Industry. To study the trend of NPA on various sector‘s. To suggest various measures for the bank to reduce the level of NPA. To study the general reasons for assets to become Non-performing assets. To offer some suggestions based on findings of the study.
Analysis of Findings NPAs in the banking system have started increasing sharply since the end of 2011. This was also the period when the growth in India‘s GDP had started slowing down from levels of above 8 per cent (based on old methodology) to 6.2 per cent in FY 2012 and further to 4.5 per cent and 4.7 per cent, respectively in the subsequent years. Based on the new methodology, growth rates are higher at 5.6 per cent and 6.6 per cent, respectively in FY 2013 and FY 2014. These years were also the ones where there was low industrial growth, as well as, build-up of stalled projects as there were challenges in areas, such as mining, power, land, environment to name some. Industrial growth came down to 1.1 per cent in FY 2013, -0.1 per cent in FY 2014 and 2.8 per cent in FY15. Growth in bank credit has also averaged a lower number of 13.5 per cent for the period FY 2012-2015 compared with 19.5 per cent in the preceding four years. Therefore, the macro conditions have not been favorable and hence, contributed to the higher growth in NPAs. It has been observed historically that banks also tend to lend more money when economic conditions are good. However, once the downturn sets in the business cycle, the assets come under pressure and move towards becoming NPAs—especially those in the infrastructure sector as well as loans given to the SME segment which get impacted significantly during a downturn. Also a sub-optimal monsoon leads to an increase in NPAs on farm loans. A combination of these factors has contributed to this build-up of NPAs over the years. The advances given by banks are called ‗assets‘, which generate ‗income‘ (via interests and installments). If an installment is not paid until the due date, it is called a bad loan. If it extends beyond 90 days, it is termed NPA. The ratio of NPAs to total advances given by a bank is a commonly used indicator reflecting the health of the banking system. Gross/Net NPA per cent is percentage of Gross/Net NPA towards the gross advances. NPAs indicate the quality of loan book. The higher NPA is a double whammy for the bank, as they do not get income on loans classified under NPA (lesser revenue) and they need to set aside provisions (lower profits) for the NPA identified. As of June 2016, the total amount of Gross NPAs for public and private sector banks is around Rs. 6 lakh crore. In absolute terms, State Bank of India (SBI) has the highest value of Gross NPA around Rs. 93,000 crores. Punjab National Bank (PNB) (Rs. 55,000 crores) and Bank of India (BoI) (Rs. 44,000 crores) come next. But how severe is the Indian bad loan problem? A look at the ratio of bad loans or non-performing assets (NPA) across the world shows that India‘s NPA levels place it among the worst-performing major economies of the world,‖ said Shreesh (2016). Banks which have very minimal exposure to corporate loans (high retail loans), have the least NPAs. The Yes Bank, IndusInd, HDFC, Kotak, Axis, Federal, Lakshmi Vilas, DCB and CUB all have gross NPA‘s below 3 per cent. ICICI Bank and SBI despite large credit lending have managed to keep NPAs in sustainable limits. It might be because of the high volume of credit lending they undertake every quarter which offsets the NPA growth. The IOB, UCO Bank, United Bank of India, PNB, Central Bank of India and Bank of India have alarmingly high level (>13 per cent) of Gross NPA per cent. IOB (gross NPA at 20.48 per cent) will not be able to sustain if it goes above its current level, unless it brings in more cash infusion (see Figure 4).
http://www.ijmsbr.com
Page 14
International Journal of Management Sciences and Business Research, March-2017 ISSN (2226-8235) Vol-6, Issue 3
Figure 4: Gross NPA and Net NPA’s (in Per cent) of Banks
Table 5 below provides information on the absolute quantum of NPAs across Public banks (PSB), Private banks (PVB) and Foreign banks (FB) groups for the last 5 years spread over from 2010 to 2015. The difference between the state-owned banks and private sector banks is starker when we compare their asset quality. Gross non-performing assets (NPA) as percentage of total loans and advances is higher in public sector banks than private banks. The share of PSBs in total NPAs has been increasing continuously over the last 5 years from 70.83 per cent in FY 2010 to 85.19 per cent in FY 2015. Therefore, there has been concentration of NPAs in this segment. Also, in value terms the incremental increase has been more perceptible after FY 2012 with an increase of between Rs. 44,670 to 59,972 crore each year. Quite clearly the level of stress has gone up. It is important to note that the numbers mentioned here are the classified NPAs and do not include the restructured assets, which is another portfolio of stressed assets that had built-up largely due to the infra-sector, which was buffeted by extraneous forces that made debt servicing difficult. Also, these NPAs are after the sale of assets to ARCs, 5/25 assets and SDR (strategic debt restructuring). ―Asset Reconstruction Companies‖ (like ARCIL in India) purchase stressed assets from Commercial Banks at a discount. They are holder of assets and liabilities of borrowers whose NPA accounts are sold by the financing Banks. When the ARCs realize the dues from borrowers they make a profit as they have purchased the assets at a discount. Banks also benefit as their NPA level goes down and their blocked assets become liquid, which they can further lend or invest (Crisil-Assocham Study, 2016). Due to the combination of increase in the growth of Gross NPAs, as well as, lower provisioning, net NPAs also registered higher growth. It was higher for public sector banks, followed by private sector banks. In the last few years, banks restructured their advances to contain the deterioration in asset quality due to increasing NPAs. Gross NPA growth and Net NPA growth are indicative of further slippages. Higher slippages need to be offset with higher provisioning, which again is going to take a toll on bank profits. From the perspective of the Indian banking industry, the Q1 FY 2017 NPA growth has been below 15 per cent (QoQ basis) for most of the banks. But there have been some exceptional cases too. The Gross NPA of the above 37 banks together stands at Rs. 6.24 Trillion, it grew over 9.65 per cent from the previous quarter. The Net NPA of the above 37 banks together stands at Rs. 3.66 Trillion, it grew over 10.15 per cent from previous quarter (Shreesh, 2016).
http://www.ijmsbr.com
Page 15
International Journal of Management Sciences and Business Research, March-2017 ISSN (2226-8235) Vol-6, Issue 3
Table 5: Gross NPAs of banks (Rs. in crores) March Public Private 2010 59,434 17,341 2011 74,926 18,239 2012 117,838 18,768 2013 164,461 21,071 2014 227,264 24,542 2015 278,465 34,106 Average 184477.6 26813.4 NPAs (Source: Reserve Bank of India Reports; courtesy of CARE Ratings)
Foreign 7,134 5,068 6,297 7,964 11,565 10,771 9759.8
Total 83,909 98,233 142,903 193,342 263,371 323,342 221,050.8
Table 6 traces the growth pattern of NPAs across the three categories of banks (Public, Private and Foreign banks) over the 5 year period from 2011 to 2015. Unfortunately, the average growth rate of NPA belonging to Public sector banks during 2011 to 2015 was abnormally very high at a level of 36.74 per cent. Growth in total NPAs has been fairly high with a compounded average rate of 31.38 per cent for the 5-year period. This rate has far exceeded that of credit thus bringing to the fore the rudiments of the problem. Such a situation does signal an inherent weakness in the system that has to be addressed. Table 6: Growth in NPAs ( in per cent) March Public 2011 26.1% 2012 57.3% 2013 39.6% 2014 38.2% 2015 22.5% 2016 Average 36.74 Growth Rate
Private 5.2% 2.9% 12.3% 16.5% 39.0%
Foreign -29.0% 24.3% 26.5% 45.2% -6.9%
Total 17.1% 45.5% 35.4% 36.1% 22.8%
15.18
12.02
31.38
The table shows that Public Sector Banks (PSBs) have witnessed the highest growth rate given their rising share in the total NPAs of the banking system. However, private banks too have witnessed an increasing growth rate in NPAs implying that the downturn does affect all banks alike and hence, depending on the portfolio on the assets side, the intensity differs. Foreign banks have had a mixed picture in terms of growth in NPAs, being high (35-45 per cent) in the years FY 2012-FY 2014, but declining in the other two years. The conclusion that emerges is that while PSBs have definitely had the highest growth in NPAs, the trend in other banks was also the same, albeit at a lower level. Typically, banks with a higher retail portfolio, as well as, lower proportion of legacy loans would tend to have better NPA ratios. Private sector banks, on the whole, would be scoring better on both these counts. For the Indian banking system, as a whole, the Gross NPA ratio has been increasing from FY 2012 onwards after declining in FY 2011. With higher growth in NPAs and lower growth in bank advances growth, the ratio has tended to have an upward bias. Table 7 shows that the NPA ratio has been the highest (4.13 per cent) for Public sector banks (PSBs), followed by the Foreign banks (FBs) (3.96 per cent) and Private sector banks (PVBs) (2.64 per cent). Surprisingly, in case of PSBs, it has been increasing continuously over the 5 years, while for the foreign banks it declined to 2.76 per cent in FY 2012 and then rose from 3.04 to 3.86 per cent till FY 2014 before slightly declining to 3.20 per cent in FY 2015. Fortunately, the private sector banks have witnessed a declining trend (2.99 to 1.78 per cent) till FY 2014 before increasing to 2.10 per cent in FY 2015. Gross NPA growth and Net NPA growth are http://www.ijmsbr.com
Page 16
International Journal of Management Sciences and Business Research, March-2017 ISSN (2226-8235) Vol-6, Issue 3
indicative of further slippages. Higher slippages need to be offset with higher provisioning, which again is going to take a toll on bank profits. Table 7: NPA ratios Bank Group-wise March Public 2010 2.27 2011 2.31 2012 3.17 2013 3.61 2014 4.36 2015 4.96 2016 Average GR 4.13
Private 2.99 2.48 2.09 1.77 1.78 2.10
Foreign 4.36 2.61 2.76 3.04 3.86 3.20
Total 2.51 2.35 2.95 3.23 3.83 4.27
2.64
3.96
3.83
Incremental NPAs Gross NPAs of the system have been increasing also in incremental terms, i.e., additions to NPAs. Shockingly, the average additions and incremental lending to NPAs were Rs. 140,941.4 crore and Rs. 859,717.4 crore. The CAGR was 24.5 per cent over the five-year period reflecting again difficult economic circumstances. Table 8 provides information on additions to gross NPAs for the last 5 years, as well as, the new NPAs as a percentage of incremental advances. This ratio again has been increasing sharply from 21.0 per cent in FY 2014 and reaching 30.5 per cent in FY 2015. While admittedly these additions to NPAs are recognition for the past years and hence, not strictly comparable with the incremental credit of the banking system, it still serves as a broad indicator of the movement of these two variables and the fact that it has been generally rising does flag a problem for the system. Further, such additions to NPAs do put pressure on banking sectors in terms of making provisions, as well as, writing-off sticky-assets which adversely affect the profitability of the banking system. Analysts said NPAs have appeared to be stabilizing in terms of incremental assets. ―The lower performance of banks is more due to the extra provisioning that they have done to clean up their balance sheets. As the economy recovers, the NPA levels will come down. We believe that the system has better recognition norms today, which is comforting. However, the provisioning of the same could take two quarters and hopefully by March things should be better,‖ Care Ratings (2015) said. While overall corporate sector stability has improved in FY16 compared to 2007-08, the profile of stressed industries suggests that the deleveraging process is not on account of a turnaround in demand, improved liquidity or lower credit costs. Iron and steel industry faces highest leverage and interest burden as of March 2016. This is followed by construction, power, telecom and transport industries. ―Hence, instead of an improved business environment translating into better corporate earnings, leveraged firms continue to hive off their non-core businesses or are in midst of a debt restructuring exercise with its banks (debt converted to equity). Reports pegged planned asset sales by top ten indebted business houses in the economy at Rs 83,000 crore since April 2015, but demand has been lukewarm,‖ Rao said as reported by Methew (2017) in his media report. Table 8: Additions to NPAs as per cent of incremental credit (per cent) March Additions Incremental Lending Ratio 2011 70,439 733,903 9.6 2012 97,519 652,826 14.9 2013 138,389 1,323,012 10.5 2014 189,722 903,928 21.0 2015 208,638 684,918 30.5 2016 Average 140,941.4 859,717.4 17.3 http://www.ijmsbr.com
Page 17
International Journal of Management Sciences and Business Research, March-2017 ISSN (2226-8235) Vol-6, Issue 3
Rating agencies have voiced concern over public sector banks‘ capital needs and inadequacy of funding options. ―Moody‘s expects asset quality to be under pressure over next year. Despite government‘s plans to increase capital infusions into banks, Fitch cautioned that more injections were required to support banks‘ credit needs, while the latter also manages pressures of asset quality, resolution of problem loans and elevated credit costs‖ (Shukla, 2015). Banks are now pinning their hopes on the ―Insolvency and Bankruptcy Code (2016)‖ for effective loan recovery. ―Effective implementation of the Insolvency and Bankruptcy Code can potentially release about Rs 25,000 crore capital currently locked up in non-performing assets over next 4-5 years, said a Crisil-Assocham joint study. ―If implemented successfully, the code will help India‘s banking sector catch up with or even exceed the recovery rates of 32 per cent and average time taken of 2.8 years in other emerging markets.‖ The code will also contain slippages into NPAs by spawning better credit discipline. The RBI has already tightened norms for wilful defaulters, which, together with implementation of the code, will enhance recoveries from such borrowers and improve overall credit discipline, Crisil said. However, considering that institutionalizing the code will be a long-drawn affair, it may not provide any material capital relief to banks over short term. The contention that public sector banks (PSBs) could have been more diligent while disbursing huge loans also becomes clearer from the chart, as depicted in Figure 5, which shows how private sector banks have kept their net NPA ratio much lower than all other banks in the country. While nationalized banks had 3.45 per cent NPAs out of their net lending in 2015, private banks kept the ratio to less than 1 per cent even though it has risen over the years. ―While all banks‘ fresh NPA generation rate was ~6 per cent for FY 2016, banks‘ fresh NPA generation is likely to moderate to around 4 to 4.5 per cent in FY 2017 as a large proportion of the weak advances may been classified as NPAs in FY 2016,‖ says Karthik Srinivasan, Co-head Financial Sector Ratings, ICRA (Shivani, 2016).
Figure 5: Trends in NPAs to Net Advances in percentage. Action Taken by Bank on NPAs RBI as regulator and the Government as the owner of the largest number of banks in the country must crack the whip to the large defaulters. RBI has defined ―wilful defaulter‖ as a borrower who intentionally defaults on its repayment obligation, despite adequate cash flows, or has diverted/siphoned off funds, or not utilized the funds for the purpose for which it was taken. Recently, RBI widened the scope of ―wilful defaulters‖ by covering ―guarantors‖ under its purview. While these changes are a welcome step, there are many reasons which curb bankers from declaring NPA borrowers as ―wilful defaulters.‖ As per the guidelines, higher provision is required to be made for fraud accounts compared to NPA accounts (EY 2016).
http://www.ijmsbr.com
Page 18
International Journal of Management Sciences and Business Research, March-2017 ISSN (2226-8235) Vol-6, Issue 3
Figure 6: Trend of NPA Reduction and Write offs for PSBs At a time when bad loans are witnessing a surge, the rate of recovery of bad assets by banks has taken a knock, as highlighted in Figure 6. The rate of recovery of NPAs was 10.3 per cent (or Rs. 22,800 crore) out of the total NPAs of Rs. 221,400 crore during fiscal ended March 2016, against Rs. 30,800 crore (12.4 per cent) of the total amount of Rs. 248,200 crore reported in March 2015, data from the RBI has said. According to the RBI, the rate of recovery was 18.4 per cent (or Rs. 32,000 crore) out of the total NPAs of Rs. 173,800 crore reported in March 2014. The recovery rate was even higher at 22 per cent (Rs. 23,300 crore) in March 2013 out of the total reported NPAs of Rs. 105,700 crore, the RBI said in its database on the Indian economy. The RBI said a total of 46.54 lakh cases to recover NPAs were filed in Lok Adalats, debt recovery tribunals and under the SARFAESI Act. Of this, 44.56 lakh cases were taken up by Lok Adalats during fiscal March 2016. Public sector banks, which are burdened with a high proportion of the banking sector‘s NPAs, could recover only Rs. 19,757 crore as against Rs. 27,849 crore during the previous year, the RBI said. ―The deceleration in recovery was mainly due to a reduction in recovery through the SARFAESI channel by 52 per cent from Rs. 25,600 crore in 2014-15 to Rs. 13,179 crore in 2015-16. On the other hand, recovery through Lok Adalats and DRTs increased,‖ the RBI said in its ―Report on Trends and Progress in Banking, (2014).‖ Reiterating that casually treating a structural problem of lending by the banks would not be a long-term solution, Raghuram Rajan also said last month that the banks need to stop brushing the NPA issue under the carpet. ―If the bank wants to pretend that everything is alright with the loan, it can only apply Band-Aids—for any more drastic action would require NPA classification,‖ he said. Last August, Finance Minister Arun Jaitley called the levels of NPAs in public sector banks ―unacceptable‖ when he announced a Rs. 70,000 crore compensation plan for these banks, spread over four years. In this budget too, Jaitley announced a package and stressed that the banks will have clean balance sheets by 2017, which seems to be a case of wishful thinking. Two aspects of NPAs which are important are: (a) the responses from banks in terms of write-offs, and (b) provisions which finally affect their balance sheets. Table 9 provides a snapshot image of the total write-offs of all banks, which have been increasing, especially from FY 2013 and 2014 onwards. In the FY 2015, total writeoffs were at the peak of Rs. 60,050 crore, which is 0.79 per cent of total outstanding advances as of March 2015. However, write-offs were 26 per cent of operating profits, which is quite significant. From the perspectives of average NPAs write-off, once again, PSBs were leading (with Rs. 20,025.8 crore), followed by PVBs (Rs. 5492.6 crore) and FBS (Rs.1271.6 crore). During 2013 to 2015, 29 public sector banks wrote off as much as Rs. 1.14 lakh crore of bad debts. For instance, SBI alone declared loans worth Rs. 21,313 crore as unrecoverable in 2015 compared to Rs 5,594 crore in 2014. The problem is so severe that the RBI Governor Raghuram Rajan has also been emphasizing on the need to clean-up balance sheets and performing a ―deep surgery‖ on the balance sheets which will need an ―anaesthetic‖ in the form of recognizing NPAs on the financial books. ―The future of India‘s economy hinges on how promptly the overhang of huge stressed assets is cleared and banking sector starts functioning without stress. Point to note is that cost of fund for the economy, http://www.ijmsbr.com
Page 19
International Journal of Management Sciences and Business Research, March-2017 ISSN (2226-8235) Vol-6, Issue 3
therefore the future rate of growth, is dependent on a transparent and stress free financial sector‖ said DTA (2014) report. Table 9: Total write-offs of NPAs (Rs. in crore) March Public Private 2010 2,897 4,072 2011 5,885 2,339 2012 2,348 3,262 2013 7,186 4,115 2014 30,834 6,541 2015 50,979 7,134 Average 20,025.8 5492.6
Foreign 2,948 78 4 52 1,339 1,937 1271.6
Total 9,917 8,302 5,614 11,353 38,714 60,050 26,790
Provision Coverage Ratio (PCR) indicates the percentage of provisions done for the outstanding NPAs. The RBI prescription (though not mandated) is at 70 per cent, but many banks are struggling to reach this target. Higher provisioning takes a hit at the profits, and hurts capital–a very high provisioning will hit their capital hard and thus reduce their Capital Adequacy Ratio (CAR). Most of the banks, PCR lie in the range of 45 to 55 per cent indicating the banks are not anywhere close. Rather than provisioning for the NPAs, they bet on a recovery (the rest they can write off as bad debt, rather than provisioning for the whole NPA). In 2017, Rs. 42,477 crore was the total provisioning done by the above 37 banks for the reported quarter. The provisioning declined by 44.60 per cent compared to last quarter. For the reported quarter, the total provisions of the above said 37 banks accounted for 16.37 per cent of their revenue. For the last quarter it was 30.78 per cent. Table 10 depicts data on provisions made by banks for NPAs. Like write-offs, provisions made by banking industry for NPAs have been increasing continuously with a sharp gradient in FY 2014 and FY 2015. Keeping in view the average figures of NPA provisions made by banks, public sector banks were leading with provision of Rs. 48,787 crore, which was followed by Private sector banks (Rs. 8278.2 crore) and Foreign banks (Rs. 2699 crore). Surprisingly, the average of NPA provisions made by the banking industry were galloping from Rs. 30,679 crore in 2010 to Rs. 79,783 crore in 2015, with an overall average of Rs. 59,764.2 crores. While the provisions made by the Public, Private and Foreign sector banks for their NPAs were a high multiple of writeoffs in the first 4 years, this has come down in the last two years, indicating a combination of either more NPAs being written-off and/or lower provisions being made keeping in mind the profit movement to impress their shareholders. The credit cost (defined as provisions to average outstanding advances in two years) has been concomitantly increasing from 0.87 per cent in FY 2011 to 1.04 per cent and 1.11 per cent in the last 2 years, respectively. Table 10: Provisions for NPAs (Rs. in crore) March Public Private Foreign Total 2010 17,142 9,629 3,908 30,679 2011 25,956 5,084 538 31,578 2012 34,572 3,981 1,999 40,552 2013 43,063 5,474 1,048 49,585 2014 55,450 7,261 3,933 66,644 2015 67,752 9,962 2,069 79,783 Average 48,787 8278.2 2699 59,764.2 ―It is important that those who availed loans from banks do not misuse the write-off route. During 2010-11, the Government of India injected Rs. 20,117 crore as capital in PSBs; this infusion amounted to Rs. 12,000 crore http://www.ijmsbr.com
Page 20
International Journal of Management Sciences and Business Research, March-2017 ISSN (2226-8235) Vol-6, Issue 3
and Rs. 12,517 crore, respectively, during 2011-12 and 2012-13. During 2013-14, the GOI announced an infusion of Rs. 14,000 crore in the latest Budget,‖ added Venkatesh (2017) in his media report. On an average, the write-off amount accounts for about 15 to 25 per cent of the capital injected in these years. Hence, it is important that this write-off route is used judiciously so that taxpayers‘ money is not misused. In the FY 2016, the NPA scene has become even more serious over the quarters. Information however, is available for a sub-set of 39 Indian banks, 24 in the public sector and 15 in private. Average Gross NPAs across all banks increased from 4.4 per cent in Q4-FY 2015 to 4.7 per cent in Q1-FY 2016 to 4.9 per cent in Q2-FY 2016 and 8.1 per cent in Q3-FY 2016. As witnessed in the Table 11, most of the increase in the NPAs can be attributed to the PSBs. It needs to be noted that out of the 24 PSBs banks, only 4 banks have gross NPAs below 5 per cent in Q3-FY 2016. Two of them have had a ratio of above 10 per cent, while 7 had between 8 to10 per cent. Although, lower NPAs of private sector banks have also increased from 2.0 per cent in Q4-FY 2015 to 2.7 per cent in Q3-FY 2016. Only two of them had ratios of above 5 per cent and are old private banks. Table 11: NPAs in FY16 (Rs. in crore and ratio in per cent) Q4 FY 2015 Q1 FY 2016 Rs. Cr. Ratio Rs. Cr. Ratio Public Banks 269,124 5.1% 285,748 5.5% Private Banks 32,379 2.0% 34,805 2.2% All Banks 301,502 4.4% 320,554 4.7%
Q2 FY 2016 Rs. Cr. Ratio 303,678 5.8% 36,716 2.2% 340,395 4.9%
Q3 FY 2016 Rs. Cr. Ratio 527,246 9.2% 44,813 2.7% 572,059 8.1%
The NPA issue has been running havoc in banking sector, and some banks like IOB have taken too much of a hit–they are tottering and the only reason they are not insolvent is some of these banks are government owned. The higher NPA ratios for some Public Sector Banks for December quarter can be attributed to prudent recognition norms following the advice given by the RBI, as well as, recognition of some restructured assets as non-performing as per the new guidelines besides absolute numbers increasing due to corporate stress. Economic slowdown, incorrect credit assessment, governance issues and wilful default are other reasons for this increase in NPAs. The NPAs, according to the RBI (2014a), are concentrated in sectors such as infrastructure, mining, textiles, steel and aviation, which could still be under pressure given the direction of global commodity prices. Further, the price movements in steel on account of the China factor would continue to exert pressure. RBI and the Ministry of Finance are taking steps to mitigate the risks around the NPA bubble. The emphasis is more on proactively managing the account and identifying the early warning signals before it turns bad. How to reduce NPAs? NPAs normally have tended to move along with the economic cycle. Often, the loans given during the good times stop performing when conditions turn adverse. The recent fall in commodity prices has affected several industries and those which are leveraged have had issues with debt servicing. The interest cover ratio has also been declining over the last few quarters (Care Ratings, 2016). Here, ―NPA Life Cycle in Banks‖ can prove to be a valuable tool to reduce NPAs in Banks. There are three stages of the life cycle of NPAs in banks (Shukla, 2015). The first stage consists of identification of stressed assets and NPAs. The second stage consists of investigation by measurement and the last and third stage consists of resolution through crisis management and revitalization of stressed assets. RBI has laid an emphasis on banks to be proactive in recognizing stress level and to take remedial measures in order to preserve the economic value of assets. Under the guidelines of RBI Special Mention Accounts (SMAs) classification has been introduced recently, coupled with defining a time bound procedure for deciding the course and nature of remedial actions. In addition, RBI has also taken various steps in strengthening the NPA resolution eco-system in India, which includes an increase in foreign participation rules in ARCs in India and bringing a sunset clause to regulatory forbearance accorded to restructured accounts up to March 2016. http://www.ijmsbr.com
Page 21
International Journal of Management Sciences and Business Research, March-2017 ISSN (2226-8235) Vol-6, Issue 3
The following are some thoughts on reducing NPAs. 1. More stringent credit appraisal from the point of view of banks. Weak banks could pursue narrow banking until such time their books look better after capitalization. This process could also imply shrinking the balance sheets at times. 2. Better monitoring of assets, especially those with high value. There could be separate departments to address this issue. 3. Have in place early warning signals to flag such problems. This would be in the nature of picking up signals on policy or industry developments besides the regular financial indicators. 4. Better information dissemination on the NPAs especially on those who are wilful defaulters or have very large debt overhang. This can be useful for banks when sanctioning fresh loans. 5. Recognizing the same in a prudent manner and making provisions thereof. 6. Addressing governance issues in some banks that have high NPAs. 7. Asset reconstruction companies would need to run in parallel to takeover such assets. Creating a bad bank is an idea to be pursued in this respect. 8. The passing of the bankruptcy code would be very useful in addressing this issue. Assuming that these books are cleaned up by March 2016, a recovery in industrial prospects should help to lower the delinquency rates. The RBI had also noted in its draft guidelines on large exposures of banks that a certain segment should be migrated to the corporate debt market. Such a move will help to spread risk across sectors. Given that there will be an upward pressure on funding once the investment cycle recovers and infrastructure investment picks up, there will be the need to provide for the same through the financial system. Banks may not be able to fully accommodate this requirement and hence, it may be expected that there would be a diversion to the bond market. The challenge however will still remain for the system to ensure that 1-5 mentioned above are assiduously followed to keep these numbers under check (Care Ratings, 2016). Conclusions One cannot comprehend an economic and industrial growth without a healthy banking industry. Banks are faced with the challenging task of maintaining/increasing credit off-take to fuel GDP growth, while also ensuring quality is not compromised. An obvious outcome of low asset quality is the growth in Non-Performing Assets (NPAs). NPA growth needs to be supported with a higher level of provisioning, which in turn has a direct impact on bottom-line. Banks see a definite drop in retained earnings and are forced to raise more tier-1 capital to sustain the same level of credit disbursements. Intuitively, this points to an inefficient utilization of resources with ratios like profit margin and return on equity (RoE) being directly impacted. In fact, it might be impossible to eliminate NPAs from the books of the banks, which are into the business of taking credit risks when granting loans. But high levels of NPAs can pose a big threat to the viability of the banks and can lead to bank failures. Bank failures in turn, through its interconnectedness can threaten the stability of the financial system of an economy as a whole. A quick review of the past NPA handling by the banks and the regulators would also help them in deciding on the most effective corrective mechanism towards resolving the current NPA over-hang. A better knowledge of the NPA drivers can also help improve upon the existing stress testing exercise of the bank supervisor. As said by Rajan (2013) in: ―You can put lipstick on a pig but it does not become a princess. So dressing up a loan and showing it as restructured and not provisioning for it when it stops paying, is an issue‖. There is an urgent need to solve the current NPAs and put a roadmap to reduce the reasons which lead to creation of such high NPAs. Under Rajan‘s stewardship, the RBI has announced a host of measures to reign in this problem (FICCI 2016). Some of the changes introduced include the recent move by RBI are: •
Allowing banks to take equity by converting their debt.
http://www.ijmsbr.com
Page 22
International Journal of Management Sciences and Business Research, March-2017 ISSN (2226-8235) Vol-6, Issue 3
• • • • •
Implementation of Special Mention Accounts (SMA) norms have helped in early identification of stress assets in the system. Creation of an empowered Joint Lender Forum to expedite the process for resolving of NPAs. Tagging individuals and companies as wilful defaulter would help in creating a strong deterrent. Early last year, the central bank allowed the banks to sell even the loans where the principal or interest was overdue by 60 days rather than 90 days, earlier. In essence, it allowed banks to start selling assets early if they felt the loan was non-redeemable. Nudging banks to sell NPAs to professionally managed ARCs, who could resolve assets. The RBI extended the benefit which allows banks to spread the loss from sale of assets to ARCs, over two years. Available till March 2016, this benefit has resulted in surge in efforts from banks to clean their balance sheets
A comprehensive Early Warning Framework (EWF) that included identifying the right customer segment, understanding the data landscape, formulating early warning triggers and creating a risk mitigation plan, resulted in 15-20 percent reductions in NPAs among some of the large global banks. An early warning solution can also help banks irrespective of scale, scope and region to (a) Reduce the new NPA flows (and a resulting reduction in NPA stock), (b) Maximize the recovered value and reduce the Exposure at Default, with timely alerts, and (c) Better utilize capital. Building an Early Warning Solution (EWS) requires banks to adopt a custom approach that is specific to their portfolio needs. Is the Narendra Modi govt ignoring the warning signals? Unnikrishnan (2017) media report says, ―At least 20 public sector banks (PSB) in India now have their gross non-performing assets (GNPAs) above 10 per cent of their total advances, six of them above 15 per cent and one bank has reported GNPA at 22.42 per cent (Indian Overseas Bank). According to Capitaline data, total gross NPAs reported by 42 banks aggregated to Rs 7.32 lakh crore as of December end, as compared with Rs. 4.51 lakh crore in the year-ago period and Rs. 7.05 lakh crore in the September quarter. Of this chunk, close to 88 per cent is in the books of state-run banks.‖ The bad loan story of state-run banks continues and there are hardly any signs of things improving in the near future. At issue is what to do with $133 billion in stressed assets accumulated by banks after years of reckless lending, a problem that has bedeviled regulators and stalled loans that India needs to revive private investment. The bad loan scenario of Indian banks hasn‘t improved significantly in the recent years on account of three factors. One, the revival in the investment cycle has not taken strong hold yet. And the second, the process of rebooting of the delayed projects has not yet translated into improved cash flows for companies. ―Bad loans of public sector banks have reached an unacceptable level and an all-out effort has been launched to correct their health. NPAs, which have reached to the present level, are unacceptable. They reached this level partly because of indiscretion, partly because of inaction and partly because of challenges in some sectors of the economy, which were evident through the high NPA levels in these sectors, Finance Minister Arun Jaitley (2015) said. The FM wants banks to clean-up the bad loan pile on their balance sheets as quickly as possible. ―But, there is no magic wand to make NPAs disappear. It is not easy,‖ said a senior banker, who was present at the meeting. ―It all depends upon how fast the economy comes back on track, stressed assets revive and companies start paying back. Till then, the only option for banks is to avoid further lending,‖ said the official. That does not augur well for an economy, which desperately needs funds to kick off the growth-phase. The slowdown in credit growth is already visible. How did the NPAs pile up? It did not happen overnight. Besides the overall economic slowdown, one major reason why the NPAs shot up is the reckless lending resorted by state-run banks without adequately assessing the risks. The focus was on volume growth and not quality. Secondly, interested party lending and the role of middlemen played a key role. The banker-middlemancorporate nexus operated in full swing. Most often than not, these interested parties are those linked to influential politicians and business groups. Third, a new set of promoters, who would not pay back loans to banks despite having the ability to do so, emerged more often. ―The RBI called them wilful defaulters. Once a http://www.ijmsbr.com
Page 23
International Journal of Management Sciences and Business Research, March-2017 ISSN (2226-8235) Vol-6, Issue 3
company or promoters is tagged as wilful defaulter, no other financial institution will lend to such parties, nor can these promoters be part of any other organizations. There are 7,035 cases of wilful defaults with a bad loan pile to the tune of Rs. 58,792 crores as on 31 March, 2015,‖ Lee (2016). Fourth, bad loan picture turned grim after banks started pushing loans to the restructured category to prevent them becoming NPAs. This only postponed the problem and started to backfire. Many of these loans were close to NPAs when they were admitted to recasts. As part of the solution, ―A slew of corrective measures initiated by the Modi government, such as cleaning up the power-discom mess with state-supported revival package, increasing the tenure of bank chiefs and creation of a bankruptcy code can aid the reduction in bad loans over a period of time.‖ But, the actual implementation of these promises is critical. Budget 2017 may prove to be path-breaking on several fronts. However, an important concern is the peripheral attention given to reviving the banking sector. For the economy, the banking sector represents its heart. If the heart is clogged, the economy cannot return to vitality, says media report by Subramanian (2017). For example, Venkatesh‘s (2017) media report states, ―Jaitley, Finance Minister of India, earmarked Rs 10,000 crore for recapitalization of the government banks. While he said a higher sum will be allocated if needed, the sum is piffling compared to the Rs 1.8 lakh crore required by 2018-19 as recapitalization amount.‖ The Government has announced a capital infusion of Rs.70,000 crore for PSU banks over the next four years with Rs.25,000 crore to be infused in FY16. This comes as a positive move since the budgeted allocation of Rs.7,940 crore was inadequate. Current infusion plan may help in providing some growth capital for the banks in FY16. However, given the fact that the provision coverage ratio is low for most of the PSU banks, additional capital will be required to provide sufficient cover for stressed assets (Care Ratings 2015). Moreover, to enable the banking sector tackle the problem of stressed assets, the Centre has set up an Information Utility (IU), called ―National E-Governance Services‖. An IU is a credit registry, maintaining data on borrowing, default, and security interest of lending/borrowing transactions with banks and financial institutions. It provides data to authorized users on the present status of a borrower (Rao 2017). Besides, measures such as bankruptcy law and strict action on wilful defaulters may aid in lowering NPAs. Moreover, speedy judicial resolution of cases involving large-ticket bad loans is critical for banks to recover their dues. Many a times, after long years of litigation, the sharp erosion in the value of underlying asset leaves nothing much for the lender to recover. The future of India‘s economy hinges on how promptly the overhang of huge stressed assets is cleared and banking sector starts functioning without stress. Point to note is that cost of fund for the economy, therefore, the future rate of growth, is dependent on a transparent and stress free financial sector. Banks would need to adopt and implement the measures in true spirit and substance and not just ‗form‘. Smart management of the asset lifecycle can enable banks to not just be compliant, but over the long-term, also help adjust their credit policy, product portfolio and lending processes in a bid to reduce bad loans. The key to proactive identification of red flags would be to integrate and analyze transactional data (bank statements) with documents available (audit report, sanction documents etc.) and information from the public domain including market information to find anomalies. Specific roles for designated persons, who will ensure compliance with the formal guidelines, would be necessary to ensure accountability of decisions taken. The road to recovery is long and winding. But bankers are cautiously optimistic that the NPA situation will improve albeit at a slow pace. References Balasubramaniam, C.S. (2011), Non-Performing Assets and Profitability of Commercial Banks in India: Assessment and Emerging Issues, Journal of Research in Commerce & Management, 1(7), 41-57. BCBS (2016), Minimum capital requirements for market risk,‖ Basel Committee on Banking Supervision, Jan. https://www.bis.org/bcbs. Bhasin, (2015), Creative Accounting Practices in the Indian Corporate Sector: An Empirical Study, International Journal of Management Science and Business Research, 4(10), Oct. 35-52.
http://www.ijmsbr.com
Page 24
International Journal of Management Sciences and Business Research, March-2017 ISSN (2226-8235) Vol-6, Issue 3 Bhasin, M.L. (2013), Corporate Accounting Scandal at Satyam: A Case Study of India‘s Enron, European Journal of Business and Social Sciences, 1(12), March, 25-47. Bhasin, M.L. (2013a), An Empirical Investigation of the Relevant Skills of Forensic Accountants: Experience of a Developing Economy, European Journal of Accounting, Auditing and Finance Research, 1(2), June, European Centre for Training and Development, 11-52. Bhasin, M.L. (2015), Menace of Frauds in Banking Industry: Experience of a Developing Country, Australian Journal of Business and Management Research, 4(12), April, 21-33. Bhasin, M.L. (2016), Frauds in the Banking Sector: Experience of a Developing Country, Asian Journal of Social Sciences and Management Studies, 3(1), 8-16. Bhasin, M.L. (2016a), The Fight Against Bank Frauds: Current Scenario and Future Challenges, Cuenca e Technical Vitivinicola Journal, 31(2), Feb., 56-85. Bhasin, M.L. (2016b), Integration of Technology to Combat Bank Frauds: Experience of a Developing Country, Wulfenia Journal KLAGENFURT, 23(2), Feb. 201-233. Bhasin, M.L. (2016c), Creative Accounting Scam at Satyam Computer Limited: How the Fraud Story Unfolded? Open Journal of Accounting, 5(4), Sept. 57-81. Bhasin, M.L. (2017), Integrating Corporate Governance and Forensic Accounting: A Study of an Asian Country, International Journal of Management Sciences and Business Research, 6(1), Jan., 31-52. Bock, R.D. and Demyanets, A. (2012), Bank Asset Quality in Emerging Markets: Determinants and Spillovers, IMF Working Paper WP/12/71 https://www.imf.org, Borse, N.B. (2016), The Study of the Effect of Non-Performing Assets (NPA) on Return on Assets (ROA) of Major Indian Commercial banks, International Journal in Management and Social Science, 4(1), Jan. 222-227. Care Ratings (2015), Banking Sector Performance Study–FY15, Aug. 26, Credit Analysis & Research Limited, 1-6. Care Ratings (2016), The NPA Story –FY16. Feb. 19, Credit Analysis & Research Limited 1-6. Chakrabarti, M. (2015), The Role of Asset Reconstruction Companies in NPAs Management in Indian Banking Sector: An Empirical Study, Abhinav International Monthly Refereed Journal of Research in Management & Technology, 4(5) May, 56-66. Chaudhury, S. and Singh, S. (2012), Impact of Reforms on the Asset Quality in Indian Banking, Zenith International Journal of Multidisciplinary Research, 2(1), Jan. 13-31. EY (2016), Role of core banking solutions in banks, Ernst & Young LLP, India, http://www.ey.com, 1-20. Crisil-Assocham Study (2016), ARCs might be able to improve recovery rates & churn capital better: ASSOCHAM-Crisil study, Nov. 21, http://assocham.org. DTA (2014), Rising NPA, a stress on India‘s banking sector, Feb. 1-5. EY (2015), Unmasking India‘s NPA issues: Can the Banking Sector Overcome this Phase? http://www.ey.com. EY (2016), ARCs – at the crossroads of making a paradigm shift, July. http://www.ey.com EY (2016), Insolvency and Bankruptcy Code, 2016: An Overview, July, http://www.ey.com. FICCI (2016), NPA Management in Banks, Financial Foresights: Views, Reflections and Erudition, Federation of Indian Chambers of Commerce and Industry, 6(2), Q3 FY 2016. www.ficci.com. Ghosh, A. (2014), Asset Quality of banks: Evidence from India, Indian Institute of Banking & Finance. www.iibf.org.in. Gupta, B. (2012), A Comparative Study of Non-Performing Assets of SBI & Associates & Other Public Sector Banks, SIT Journal of Management, 2(2), Dec., 175-189. Gynedi, R. (2014), India‘s Non-performing Assets—A Lurking Crisis, Center for Strategic & International Studies, April, 1-5, https://www.csis.org. Jain, M. (2016), Four charts show how the bad loan problem of Indian banks is much bigger than Vijay Mallya, Mar, https://scroll.in. Jana, M.M. and Thakur, M.K., (2015) ―An Overview of Non-Performing Assets Management and Banking Performance - An Empirical Analysis‖, The Management Accountant, 50(1), 42-48. Kanan, R. (2013), How to Swat the NPA Bug, Business Line, April 5, http://www.thehindubusinessline.com Karunakar, M. (2008), Are Non-Performing Assets Gloomy or Greedy from Indian Perspective? Research Journal of Social Sciences, 3: 4-12. Kaur, K. & Singh, B. (2011), ―Non-performing assets of public and private sector banks A comparative study‖, South Asian Journal of Marketing and Management Research, 1(3), Dec. 54-72. Klein, N. (2013), Non-Performing Loans in CESEE: Determinants and Impact on Macroeconomic Performance, IMF Working Paper WP/13/72 https://www.imf.org. Kumar, R., Krishna, G.D. and Bhardwaj, S. (2016), Indradhanush: Banking Sector Reforms, www.cprindia.org. Lee, A. (2016), All you need to know about wilful defaulters, Feb. 24, http://www.business-standard.com. Mahajan, P. (2014), Non-Performing Assets: A Study of Public, Private & Foreign Sector Banks in India, Pacific Business Review International, 7(1), July, 9-16. Mathew, G. (2017), Non-performing assets: Bad loan recovery by banks only gets worse in four years, Jan. 3, http://indianexpress.com. Mazumdar, S. (2017), Evolution of NPA Management in Indian Banking Sector, The Management Accountant, 52(1), Jan.
http://www.ijmsbr.com
Page 25
International Journal of Management Sciences and Business Research, March-2017 ISSN (2226-8235) Vol-6, Issue 3 Patrick, M. (2016), The burgeoning number of NPAs: A cause of worry for the Indian banking system, Centre for Public Policy Research, 20 Feb. http://www.cppr.in PTI (2015), FM Jaitley says NPAs at Unacceptable Level for PSBs, Business Today, PTI, New Delhi, August 21, http://www.businesstoday.in Rai, K., (2012), ―Study on performance of NPAs of Indian commercial banks‖, Asian Journal of Research in Banking and Finance, 2(12), Rao, K.R. (2017), Centre sets up credit registry to help banks tackle stressed assets, March 3, Business Line. http://www.thehindubusinessline.com. RBI (2016), The Financial Stability Report (2016) RBI (2014), ―Framework for Revitalizing Distressed Assets in the Economy‖ Jan. RBI (2014a), Report on Trend and Progress of Banking in India 2014-15. Roy, P. and Samanta, P.K. (2017), Analysis of Non-Performing Assets in Public Sector Banks of India. International Journal of Management, 8(1), 2017, 21–29. Samir and Kamra, A. (2013), A Comparative Analysis of Non- Performing Assets (NPAs) of Selected Commercial Banks in India, Opinion-International Journal of Management, 3(1), 68-80. Sasikala, P. and Mohanapriya, G. (2017), A Study on Functional Issues in Reducing NPA Among Cooperative Banks in Pondicherry, International Journal of Innovation in Engineering Research & Management, 4(1) 1-10. Shivani, V. (2016), NPA Management: The Need to Balance Credit Quality with Growth, White Paper, iCreate Software Pvt. Ltd www.icreate.in. pp. 1-4. Shreesh (2016), The Indian Banking Sector Report: NPA Shocks Continue as Banks Struggle to Provision Enough, September 28, Capitalmind, https://capitalmind.in) Shreesh (2016), The Indian Banking Sector Report: NPA Shocks Continue as Banks Struggle to Provision Enough, 28 Sept. Capitalmind, https://capitalmind.in. Shukla, R. (2015), Role of Credit Rating Agencies in Reducing NPAs in Banks, Remarking, 2(6), Nov. 25-28. Singh, V.R. (2014), A Study of Non-Performing Assets of Commercial Banks and it‘s recovery in India, Annual Research Journal of SCMS, Pune 4(3), March, 110-125. Subramanian, K. (2017), Budget 2017: Forgotten Reforms becoming a NPA for Banking Sector, Feb. 2, The Economic Times, http://economictimes.com. Tripathi, R. and Singh, P.T. (2015), Proposed Basel III Implementation: Are Indian Commercial Banks Ready, Apeejay Journal of Management Sciences and Technology, 3 (1), October, 20-38. Unnikrishnan, D. (2017), Bank NPAs are worsening: Is the Narendra Modi govt ignoring the warning signals? Feb. 20, First Post, http://www.firstpost.com. Vallabh, G., Bhatia, A. and Mishra, S. (2007), Non-Performing Assets of Indian Public, Private and Foreign Sector Banks: An Empirical Assessment‘, ICFAI Journal of Bank Management, 6(3), 7-28. Vallabh, G., Singh, D., Prasoon, R. and Singh, A. (2016), Methodology to Predict NPA in Indian Banking System, Theoretical Economics Letters, 6(4) Aug., 827-836. Venkatesh, M. (2017), Budget 2017 doesn‘t bank on tackling NPA problem, Hindustan Times, Feb. 1, New Delhi.
http://www.ijmsbr.com
Page 26