THESIS FOR THE DEGREE OF DOCTOR OF PHILOSOPHY
Voltage Dip (Sag) Estimation in Power Systems based on Stochastic Assessment and Optimal Monitoring by
GABRIEL OLGUIN
Department of Energy and Environment Division of Electric Power Engineering CHALMERS UNIVERSITY OF TECHNOLOGY
Göteborg, Sweden 2005
Voltage Dip (Sag) Estimation in Power Systems based on Stochastic Assessment and Optimal Monitoring GABRIEL OLGUIN ©GABRIEL OLGUIN, 2005
ISBN 91-7291-594-3 Doktorsavhandlingar vid Chalmers Tekniska Högskola Ny serie nr 2276 ISSN 0346-718x
Department of Energy and Environment Division of Electric Power Engineering Chalmers University of Technology SE-412 96 Göteborg SWEDEN Telephone: +46 - 31 – 772 1000 Fax: +46 - 31 – 772 1633 E-mail:
[email protected] http://www.chalmers.se
Chalmers Bibliotek, Reproservice Göteborg, Sweden 2005
III
To my parents Maria Yolanda and Manuel My wife Valeria And my children Manuel and Paola
V
Abstract This dissertation deals with the statistical characterization of the performance of power systems in terms of voltage dips (sags). It presents a method named voltage dip estimation that extends monitoring results to buses not being monitored. Statistical dip characterization of power networks is essential to decide about mitigation methods as well as for regulatory purposes. Statistics on voltage dip may be obtained by means of 1) monitoring of the power supply, and/or 2) stochastic assessment of voltage dips. Monitoring is expensive and requires long monitoring periods. Stochastic assessment is a simulation method that combines stochastic data concerning the fault likelihood with deterministic data regarding the residual voltages during the occurrence of faults. The method of fault positions is used in this work to assess the dip performance of an existing power system. An alternative analytic approach to the method of fault positions that addresses the question of the suitable number of fault positions is proposed. It is shown that despite being able to provide a description of the long-term expected performance of the network, the method of fault positions cannot predict the performance during a particular year. Comparisons of pseudo measurements with the prediction via the method of fault positions show discrepancies and therefore the need for adjustment. A Monte Carlo simulation approach is proposed to better describe the performance of the network, and an optimal monitoring program is suggested to accomplish the adjustment of the method of fault positions. An integer optimisation model is introduced in order to determine the optimal number and location of monitors, so that every fault triggers at least a given number of power quality meters. The results of the monitoring program are then used to perform voltage dip estimation, adjusting the stochastic assessment and extending monitoring results to non-monitored buses. The dissertation shows that it is possible to profile the dip performance of the entire power system without the need for power quality monitors at every load bus of the power network. Keywords: power systems, power quality, voltage dips, voltage sags, stochastic methods, short-circuit faults, symmetrical components, impedance matrix, integer optimisation.
VII
Acknowledgements The work reported in this dissertation would not have been possible without the support from many organizations and individuals. The research work was carried out at the Department of Energy and Environment, Division of Electric Power Engineering, Chalmers University of Technology. Elforsk, Energimyndigheten, and ABB have provided the funding for this research project. Thanks are due to these institutions for their financial support. Mats Häger (STRI AB), Ulf Grape (Vattenfall), Gunnar Ridell (Sydkraft), Mikael Dahlgren (ABB Power Technology), and Erik Thunberg (Svenska Kraftnät) participated in the industrial steering group. Thanks to all them for their active role in discussions and careful reading of the first draft of this dissertation. Professor Jaap Daalder, examiner of this work, carefully read the manuscript and gave me helpful comments and suggestions. Gratitude is also expressed for the constant support and encouragement. Dr. Daniel Karlsson (Gothia Power) provided supervision of this work during the second stage of the project. Professor Math Bollen (STRI AB - LTU) introduced me into the research field and gave me the opportunity to undertake the PhD program at the Department of Electric Power Engineering, Chalmers University of Technology. Both did an excellent job in guiding me through the path connecting practical engineering and scientific research. My stay at The University of Manchester was a fruitful experience for which I would like to thank professor Daniel Kirschen (The University of Manchester, UK) and my financial sponsors. Appreciation is extended to the members of the research group, in particular to Dr. Gupta, Dr. Djokic, and Dr. Aung for interesting discussions about various aspects regarding voltage dips. Thanks also to Dr. Ivana Kockar and Ms. Ding for their friendship and interesting discussions regarding integer optimisation. I wish to thank the researchers that have collaborated in some of the joint papers at international conferences. Roberto Leborgne has been my nearest collaborator in studying voltage dips. Ms. Marcia Martins
VIII helped me to understand the effect of voltage dips on wind power installations. Professor Paola Verde (U. Casino, Italy) and her student Di Perna made possible our joint publication on voltage dip system indices at PMAPS 2004. Professor Jorge Coelho (UFSC, Brazil), my supervisor during my MSc at Federal University of Santa Catarina, made possible my participation at Induscon 2004. Professor Miguel Arias (USACH, Chile) and his student Marcelo Aedo helped me to finish the paper on Monte Carlo simulation submitted to IEEE T&D Asia. Dr Vuinovich (U. Palermo, Italy) helped me to understand genetic algorithms and actively participated in our joint publication at IEEE TPWRS. Professor Juan A. Martinez (ETSEIB, Spain) let me get involved in the CIGRE TF on Voltage Dips Evaluation and Predictions Techniques. They have all contributed to the success of this project.
Gabriel Olguin Gothenburg, May 2005
IX
Contents 1 INTRODUCTION 1.1 1.2 1.3 1.4 1.4.1 1.4.2 1.4.3 1.5 1.6 1.7 1.8 1.9 1.9.1 1.9.2 1.10 1.11
POWER QUALITY INTEREST IN POWER QUALITY VOLTAGE SAG OR VOLTAGE DIP? EFFECTS OF VOLTAGE DIPS IT AND PROCESS CONTROL EQUIPMENT CONTACTORS AND ASYNCHRONOUS MOTORS POWER DRIVES CUSTOMER DAMAGE COST DUE TO VOLTAGE DIPS DIPS AND ELECTROMAGNETIC COMPATIBILITY LITERATURE REVIEW LITERATURE DISCUSSION THE PROJECT INDUSTRIAL RELEVANCE LIST OF PUBLICATIONS DISSERTATION OUTLINE MAIN CONTRIBUTIONS OF THIS WORK
1 1 2 3 5 5 7 7 8 11 13 18 19 20 20 22 24
2 MODELLING AND TOOLS
27
2.1 2.2 2.2.1 2.3 2.3.1 2.4 2.4.1 2.5 2.5.1 2.5.2 2.5.3 2.5.4 2.5.5
SYSTEM MODELLING THE STOCHASTIC NATURE OF VOLTAGE DIPS FAULT RATE AND STOCHASTIC MODELS METHOD OF CRITICAL DISTANCE PHASE-ANGLE JUMP AND MORE ACCURATE EXPRESSIONS THE IMPEDANCE MATRIX BUS IMPEDANCE MATRIX BUILDING ALGORITHM SYMMETRICAL COMPONENTS AND FAULT CALCULATION SEQUENCE IMPEDANCES SEQUENCE NETWORKS AND THEIR IMPEDANCE MATRIX FAULT CURRENT CALCULATION NEUTRAL SYSTEM GROUNDING DURING FAULT VOLTAGES: A QUALITATIVE DISCUSSION
27 29 31 32 34 37 39 41 42 43 44 47 48
3 MAGNITUDE AND CLASSIFICATION OF VOLTAGE DIPS
53
3.1 VOLTAGE DIP MAGNITUDE AND CLASSIFICATION 3.2 BALANCED VOLTAGE DIP MAGNITUDE 3.2.1 PHASE ANGLE JUMP 3.3 UNBALANCED VOLTAGE DIP MAGNITUDES 3.3.1 VOLTAGE CHANGES CAUSED BY A SINGLE-PHASE-TO-GROUND FAULT 57
53 54 56 56
X 3.3.2 3.3.3
VOLTAGE CHANGES CAUSED BY A PHASE-TO-PHASE FAULT 60 VOLTAGE CHANGES CAUSED BY A TWO-PHASE-TO-GROUND FAULT 61 3.4 THE CHARACTERISTIC VOLTAGE AND POSITIVE-NEGATIVE FACTOR 63 3.5 EFFECT OF POWER TRANSFORMERS ON THE DIP TYPE 66 4 PROPAGATION AND COUNTING OF VOLTAGE DIPS IN POWER SYSTEMS
71
4.1 PREDICTION AND PROPAGATION OF VOLTAGE DIPS 4.1.1 AFFECTED AREA 4.1.2 EXPOSED AREA 4.2 COUNTING VOLTAGE DIPS
71 72 74 76
5 METHOD OF FAULT POSITIONS: SIMULATIONS AND RESULTS
81
5.1 DESCRIPTION OF THE SYSTEM 81 5.2 BALANCED DIPS 82 5.2.1 BALANCED DURING-FAULT VOLTAGES 83 5.2.2 AREA AFFECTED BY A SYMMETRICAL FAULT 84 5.2.3 EXPOSED AREA OF A LOAD BUS DUE TO SYMMETRICAL FAULTS 86 5.2.4 CUMULATIVE BALANCED DIP FREQUENCIES 88 5.2.5 VOLTAGE DIP MAPS 89 5.2.6 INFLUENCE OF GENERATION 90 5.2.7 SYSTEM STATISTICS BASED ON BALANCED DIPS 92 5.3 UNBALANCED DIPS 93 5.3.1 EXPOSED AREA OF A LOAD BUS DUE TO UNSYMMETRICAL FAULTS 94 5.3.2 A CLOSER LOOK AT THE EXPOSED AREAS 95 5.3.3 CONTRIBUTION OF SYMMETRICAL FAULTS TO DIP FREQUENCY 97 5.3.4 SYSTEM STATISTICS BASED ON BALANCED AND UNBALANCED DIPS 99 6 OPTIMAL MONITORING PROGRAMS
101
6.1 6.2 6.3 6.4 6.5 6.6 6.7
101 101 102 103 104 108 108
CHARACTERIZATION OF DIP PERFORMANCE BY MONITORING OPTIMAL MONITOR LOCATION MONITOR REACH AREA OPTIMISATION PROBLEM APPLICATION REDUNDANCY SYSTEM STATISTIC FROM LIMITED NUMBER OF MONITORS
XI 7 ANALYTIC APPROACH TO THE METHOD OF FAULT POSITIONS
111
7.1 INTRODUCTION 7.2 RESIDUAL VOLTAGE CAUSED BY A MOVING FAULT NODE 7.3 EXPECTED NUMBER OF VOLTAGE DIPS 7.3.1 ALGORITHM AND DETAILS OF COMPUTER IMPLEMENTATION 7.3.2 UNSYMMETRICAL FAULTS 7.3.3 SIMULATION RESULTS
111 112 115 117 118 118
8 COMPARING STOCHASTIC ASSESSMENT AND MEASUREMENTS
121
8.1 INTRODUCTION 8.2 CREATING FAULTS SCENARIOS 8.2.1 SIMULATION RESULTS 8.3 A MONTE CARLO SIMULATION APPROACH 8.3.1 ALGORITHM 8.3.2 SIMULATION RESULTS
121 122 124 128 129 130
9 VOLTAGE DIP (SAG) ESTIMATION
133
9.1 INTRODUCTION 133 9.2 VOLTAGE DIP ESTIMATION: CONCEPTUALISATION 134 9.3 MONITORING FOR VOLTAGE DIP ESTIMATION 135 9.4 MAGNITUDE APPROACH TO VOLTAGE DIP ESTIMATION 136 9.5 FREQUENCY APPROACH TO VOLTAGE DIP ESTIMATION 137 9.6 MATHEMATICAL FORMULATION AND ALGORITHM FOR VOLTAGE DIP ESTIMATION 137 9.6.1 MAGNITUDE VOLTAGE DIP ESTIMATION 139 9.6.2 FREQUENCY VOLTAGE DIP ESTIMATION 139 9.6.3 USING REDUNDANCY TO IMPROVE THE ESTIMATION 140 9.6.4 USING INFORMATION FROM NON-TRIGGERED MONITORS TO IMPROVE THE ESTIMATION 142 9.6.5 ALGORITHM FOR VOLTAGE DIP ESTIMATION VSE 142 9.7 VSE: SIMULATIONS AND RESULTS 143 9.7.1 MONITORING RESULTS 144 9.7.2 MAGNITUDE VSE 144 9.7.3 FREQUENCY VSE 147 9.7.4 SITE AND SYSTEM STATISTICS 149 9.7.5 ADDITIONAL UNCERTAINTIES 155 10 CONCLUSIONS AND FUTURE WORK
157
10.1 10.2
157 160
SUMMARY CONCLUSIONS
XII 10.3
FUTURE WORK
163
REFERENCES
167
APPENDIX A: SYSTEM DATA
173
APPENDIX B: DIP FREQUENCY RESULTS
179
1
1 Introduction This chapter contains a general introduction to power quality with special emphasis on voltage dips or sags. Effects of voltage dips are presented for a selected number of equipment types. Voltage dips from a perspective of electromagnetic compatibility are discussed. The need for voltage dip statistics for decision-making regarding mitigation methods as well as for regulatory purposes is highlighted. A literature review has been done and the description of the project and the outline of this dissertation are presented. The chapter concludes with the list of publications.
1.1 Power Quality There is an international agreement regarding the importance of reliability and power quality and several research groups work on the subject around the world. Reliability should be interpreted here as the continuity of the electric supply. This term is well understood, but there is no a real consensus about the meaning of the term power quality. According to the Standard IEEE 1100 (IEEE Std 1100, 1999) power quality is “the concept of powering and grounding electronic equipment in a manner suitable to the operation of that equipment and compatible with the premise wiring system and other connected equipment”. This is an appropriate definition of power quality for electronic equipment, however not only electronic devices are subject to failures due to poor quality. Heydt (1991) gives another interpretation of electric power quality in his book Electric Power Quality. For this author electric power quality broadly refers to maintaining a near sinusoidal bus voltage at rated magnitude and frequency. Dugan et al. (1996) propose an even broader definition of power quality problems, stating that it is “Any power problem manifested in voltage, current, or frequency deviations that result in failure or malfunction of customer equipment”. However not only customer equipment is subject to power quality problems. For instance the increase of the third harmonic current in the neutral of delta-wye connected distribution transformers has motivated the resizing of the neutral conductors to avoid overheating, losses and potential faults. Some authors use the term voltage quality and others use quality of the power supply to refer to the same concept power quality. The term clean power usually is used to refer to the supply that does not contain intolerable disturbances. What is clear is that all these terms refer to the interaction between the load and the network supply. In this dissertation, the following
2 definition is adopted for being the most complete and most appropriate for the new deregulated scenario of the power industry (Bhattacharya et al. 2001). “Power Quality is the combination of current quality and voltage quality, involving the interaction between the system and the load. Voltage quality concerns the deviation of the voltage waveform from the ideal sinusoidal voltage of constant magnitude and constant frequency. Current quality is a complementary term and it concerns the deviation of the current waveform from the ideal sinusoidal current of constant magnitude and constant frequency. Voltage quality involves the performance of the power system towards the load, while current quality involves the behaviour of the load towards the power system”. The work presented in this dissertation belongs to the power quality knowledge area, however it is restricted to one specific disturbance called voltage dip or voltage sag. The causes and effects of dips will be reviewed in the coming sections, but before that a discussion about general aspects of power quality is presented.
1.2 Interest in Power Quality The main concern of consumers of electricity is the continuity of the supply, i.e. the reliability. However, nowadays consumers not only want reliability, but quality too. For example, a consumer that is connected to the same bus that supplies a large motor load may face sudden voltage depressions (dips or sags) every time the motor is started. Depending on the sensitivity of the consumer’s load this voltage depression may lead to a failure or disconnection of the entire plant. Although the supply is not interrupted the consumer experiences a disturbance – a voltage dip- that causes an outage of the plant. There are also very sensitive loads such as hospitals, processing plants, air traffic control, financial institutions, etcetera that require uninterrupted and clean power. Several reasons have been given to explain the current interest in power quality (Bhattacharya et al. 2001). • Equipment has become less tolerant to voltage disturbances. Industrial customers are much more aware of the economical losses that power quality problems may cause in their processes. • Equipment causes voltage disturbances. Often the same equipment that is sensitive to voltage disturbances will itself cause other voltage disturbances. This is the case with several power converters.
3 •
•
The need for performance criteria. There is an increasing need for performance criteria to assess how good the power companies do their job. This is especially important for the monopolistic part of the chain formed by generation, transmission, and distribution of electricity. The natural monopoly that transmission and distribution companies possess, even in the deregulated markets, requires a quality framework where compulsory quality levels are given. Regulator bodies will have to create such a quality framework in terms of power quality indices. Power quality can be measured. The availability of power quality monitors means that voltage and current quality can actually be monitored on a large scale.
1.3 Voltage Sag or Voltage Dip? According to the Standard IEEE 1346 (IEEE Std 1346, 1998) a voltage sag is “a decrease in rms voltage or current at the power frequency for durations of 0.5 cycle to 1 minute”. To give a numerical value to a sag, the recommended usage is “a sag to X%”, which means that the line voltage is reduced down to X% of the normal value. The International Electrotechnical Commission, IEC, has the following definition for a dip (IEC 61000-2-1, 1990). “A voltage dip is a sudden reduction of the voltage at a point in the electrical system, followed by a voltage recovery after a short period of time, from half a cycle to a few seconds”. From the previous definitions it is evident that both voltage sag and voltage dip refer to the same disturbance. Moreover, the draft Technical Report for Electromagnetic Compatibility (IEC 61000-2-8, 2002) regarding voltage dips and short interruption on public electric power systems states, “voltage sag is an alternative name for the phenomenon voltage dip”. In this work, both terms dip and sag are used as synonym of each other. To give a value to a voltage dip, the residual voltage will be used in this dissertation A voltage dip is a multidimensional electromagnetic disturbance, the level of which is mainly determined by the magnitude and duration. Magnitude of a voltage dip is the value of residual voltage during the event. Duration of dip is time for which the rms voltage stays below a voltage dip threshold.
4 V in pu
1 Threshold Depth Allowed voltage variation
Duration of Dip
Residual voltage Time
Figure 1.1: Voltage dip and its characteristics
Typically, a dip is associated with the occurrence and termination of a short-circuit fault or other extreme increase in current like motor starting, transformer energising, etc. The dip is characterised by its duration and its residual or retained voltage, which is the lowest rms voltage during the event. The duration of the dip is the time between the instant at which the rms voltage decreases at least to a value below the start threshold and the instant at which it rises above the end threshold (at a particular point of the electricity network). Figure 1.1 illustrates a single-phase dip and its basic characteristics. It should be noted that the starting and ending threshold might not be equal. Customer A
MV Bus Feeder 1
Customer B Feeder 2 Feeder 3
Customer C
Figure 1.2: Voltage dip caused by a fault
This dissertation focuses on fault-caused dips. Figure 1.2 shows a distribution system with three feeders. Consider customer A located in feeder 1. If there is a fault downstream of the customer position, then A will experience a reduction in the voltage due to the large current flowing through the transformers and feeder followed by an interruption due to the operation of the main protection at the
5 beginning of the feeder. Customers B and C will not be interrupted but they will see a dip because the fault current, flowing through the transformers, will cause a voltage drop at the MV bus.
1.4 Effects of Voltage Dips Many sensitive loads cannot discriminate between a dip and a momentary interruption. The severity of the effects of voltage dips depends not only on the direct effects on the equipment concerned, but also on how important the function carried out by that equipment is. Modern manufacturing methods often involve complex continuous processes utilising many devices acting together. A failure of one single device, in response to a voltage dip, can stop the entire process. This may be one of the most serious and expensive consequences of voltage dips. However, such damage or loss is a function of the design of the process and is a secondary effect of the voltage dip. Some of the most common direct effects are described in this section; secondary effects are discussed in relation to their economic impact in the next section. 1.4.1
IT and Process Control Equipment
The principal units of this category of equipment require direct current (dc) supplies. These dc supplies are provided by means of modules that convert the alternating current (ac) supply from the public power supply system. Nonregulated dc voltage
Regulated dc voltage Voltage Controler
C
Figure 1.3: Regulated dc power supply
230 V ac
6 It is the minimum voltage reached during a voltage dip that is significant for the power supply modules. A simplified configuration of a dc power supply is shown in Figure 1.3. The capacitor connected to the non-regulated dc bus reduces the ripple at the input of the voltage regulator. The voltage regulator converts the non-regulated dc voltage into a regulated dc voltage of a few volts and feeds sensitive digital electronics. If the ac voltage drops, so does the voltage at the dc side. The voltage regulator is able to keep its output voltage constant over a certain range of input voltage. If the dc voltage becomes too low the regulated dc voltage will start to drop and ultimately errors will occur in the digital electronics. 100
CBEMA 80
ITIC
60
40
20
0 0,1
1
10
100
1000
Duration in (60Hz) Cycles
Figure 1.4: CBEMA and ITIC curve (reproduced from Bollen, 1999)
A common way to present the sensitivity of this category of equipment is by means of a voltage tolerance or power acceptability curve. The Computer Business Equipment Manufacturers Association (CBEMA) developed the most known of these curves. The purpose was to set limits to the withstanding capabilities of computers in terms of magnitude and duration of the voltage disturbances. The Information Technology Industry Council (ITIC) redesigned the CBEMA curve in the second half of the 1990s. The new curve is therefore referred to as ITIC curve and is the successor of the CBEMA curve. The work reported here focuses in dips and thus in the lower part of the ITIC and CBEMA curve, see Figure 1.4.
7 1.4.2
Contactors and Asynchronous Motors
Alternating current contactors (and relays) can drop out when the voltage is reduced below about 80% of the nominal for a duration of more than one cycle, i.e. a sag to 80%. A recent paper (Pohjanheimo et al., 2002) has presented test results for contactor sensitivity. The main conclusion states that most of the contactors open when the voltage drops below 50%, but the most sensitive ones tolerate only a 30% voltage depression. It is also stated that dip duration does not have a practical relevance but the point-on-wave of dip initiation affects the contactor performance significantly. The point of operation of an asynchronous motor is governed by the balance between the torque-speed characteristic of the motor and that of the mechanical load. The torque-speed characteristic of the motor depends on the square of the voltage. During a voltage dip, the torque of the motor initially decreases, reducing the speed, and the current increases until a new point of operation can be reached. Severe dips are equivalent to short interruptions in their effect on the operation of the motor. Depending on the ratio of the total inertia to the rated torque -the mechanical time constant- two different behaviours are found: • Mechanical time constant low compared with the duration of the dip. The speed decrease is such that the motor virtually stops. • Mechanical time constant high compared with the duration of the dip. In this case, the motor speed decreases slightly. However, there is the possibility of the back electromotive force (emf) being in phase opposition to the supply voltage during the recovery, resulting in an inrush current greater than the normal starting current. The high inrush current at the voltage recovery can produce a second voltage drop retarding the re-acceleration of motors to normal speed. 1.4.3
Power Drives
Power drives can be very sensitive to voltage dips. Such systems generally contain a power converter/inverter, motor, control element and a number of auxiliary components. The effect on the control element can be critical, since it has the function of managing the response of the other elements to the voltage dip. The reduction in the voltage results in a reduction in the power that can be transferred to
8 the motor and hence to the driven equipment. Dips can lead to a loss of control (Stockman, 2003). Tripping of power drives can occur due to several phenomena (Bollen, 1999): • The drive controller or protection detects the sudden change in operation conditions and trips the drive to prevent damage to the electronics components. • The drop in the dc bus voltage causes failed operation or tripping of the drive controller. • The increased ac currents during the dip or the post-dips overcurrents charging the capacitor cause an overcurrent trip or blowing of fuses protecting the electronics components.
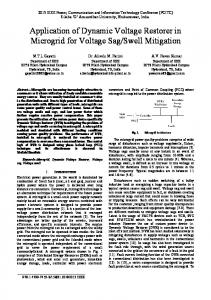
1.5 Customer Damage Cost Due to Voltage Dips Due to the advancement and proliferation of information technology and the widespread use of power electronic devices in recent years, utilities’ customers in various industrial fields are suffering economic losses from short interruptions and voltage dips. Losses caused by a voltage dip may only be an annoyance for residential customers (as a shutdown of a personal computer) but in the industrial and commercial sectors the same event may cost millions of euros, as it will be illustrated in this section. In contrast to the reliability of power supply, which is a wellunderstood and mature topic, the voltage dip phenomenon is currently being studied and the evaluation of customer damage cost due to voltage dips is still poorly explored. The assessment of customers’ cost due to unreliability is a difficult but well documented task (Wacker, 1989). Customers’ surveys are seen by most researchers as the most effective way to evaluate cost of unreliability. With this method customers are asked to estimate their cost or losses due to supply interruptions of varying duration and frequency, and at different times of the day and the year. It is generally accepted that the customer is in the best position to assess losses and this is the strength of this method. Similar surveys have been conducted to estimate damage cost due to voltage dips. Figure 1.5 (Pohjanheimo, 2003) summarises results from a survey in which 400 industrial customers of various categories were asked about costs due to a voltage sag to 50% lasting for 200 ms. The curve shows that 150 of those 400 customers did not have losses due to voltage dips. It also shows, however, that the same sag may lead to losses in the range of tens thousands of euros for a few industrial customers. It is evident
9 that certain types of industries are very sensitive to the events object of this research.
Figure 1.5: Reported industrial cost due to a voltage dip with residual voltage 50% lasting 200 ms (Pohjanheimo, 2003)
The semiconductor industry is usually mentioned as the one most sensitive to voltage dips and short interruptions. It has been reported (Shih-An Yin, 2001 and 2003) that the average interruption cost faced by the high tech industry in Taiwan ranges from about 55 000 USD for a short interruption up to 425 000 USD for a 24 hours stoppage. Many machines in a typical semiconductor factory contain power drives and control circuits that are very sensitive to voltage dips. A disturbance can cause these machines to malfunction or shut down after which a time-demanding restart procedure is needed. The pharmaceutical industry is also sensitive to voltage dips. Production is often conducted in batches and therefore a disturbance in one process may stop the complete line leading to huge losses. Pumps, boilers, autoclaves, valves, and control device act together and are coordinated to obtain the final products. Hence a disturbance in any device may stop the entire process. Not only high tech processes are sensitive to voltage dips. In metal processes, for example, it has been found that cost due to interruption (Carlsson, 2003) may reach as much as €100 000 per hour. The report
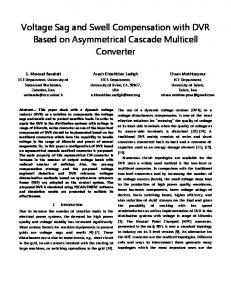
10 (Carlsson, 2003) describes three metal processes. The blast furnace, hot rolling and cold rolling processes are analysed with regard to sensitivity to voltage sags. The blast furnace and hot rolling processes are briefly reviewed here. A blast furnace is used as one of the first steps in the production of iron and steel. Iron is produced by feeding iron-ore and coke into the top of a furnace and by blowing hot air (about 1000 oC) into the bottom of the furnace. Molten iron and slag is formed. The molten iron is drained into large containers through draining holes. The blower (fed by a synchronous machine) compresses and blows air via pipelines and heaters to the blast furnace. If the synchronous machine unexpectedly stops during production, the overpressure in the pipelines falls to zero; something that may result in production losses or worse in making the furnace unusable due to the solidification of iron and slag in the air pipes of the blast furnace. The normal case is that the furnace can still be used, however it takes about 24 hours to get the furnace in production after a stoppage and the production losses per hour may reach € 10 000. The hot rolling mill is used in various industrial processes. A rolling mill rolls ingots of metal or alloys to make them thinner. There are many type of rolling mills, some roll hot whereas others roll cold. The hot roll mill studied by Carlsson (Carlsson, 2003) is a steel rolling mill and consists of two synchronous machines, each having a rated power of 11.2 MW. The rolls are driven individually; each one having a synchronous machine and power drive. The main problem with voltage dips in a hot rolling mill is the downtime. Since the steel slab has a temperature of about 1000 oC, the steel slab may deform the rolls due to the heating. During normal operation this does not occur because water is sprayed to cool the rolls. But when the slab gets stuck due to an unexpected stop, it is not possible to cool down the rolls at the contact area and the rolls may have to be replaced with new ones. This may cost as much as € 10 000 and take one working day. In summary, the disruption of an industrial process, no matter the cause, can result in very substantial costs. Figure 1.6 (Andersson, 2002) illustrates the range of customers’ costs due to voltage dips and short interruptions. Manufacturing facilities have interruption costs ranging up to tens millions of euros. These costs include damaged products, delays in delivery, damage in equipment and processes and reduced customer satisfaction.
11
Figure 1.6: Customer’s cost in different industries (Andersson, 2002)
1.6 Dips and Electromagnetic Compatibility The International Electrotechnical Commission defines electromagnetic compatibility (IEC 61000-2-1, 1990) as “the ability of a device, equipment or system to function satisfactorily in its electromagnetic environment without introducing intolerable electromagnetic disturbances to anything in that environment”. In the standardisation area, EMC is used in a broad sense. The aim is to ensure the compatibility through a good co-ordination of immunity levels of sensitive loads and the electromagnetic environment to which they are exposed. In the case of voltage dips, the electromagnetic environment is determined by the occurrence of events in the power network such as faults, transformer energising or motor starting. Co-ordination between user’s equipment and power supply is needed to avoid overspending on spurious outage cost (consumers cost) or network improvements (utility cost). Before connecting a sensitive device or equipment to the electrical network to get supply, it is necessary to assess the compatibility between the device and the supply. Voltage dips, as other power quality phenomena, should be treated as a compatibility problem between equipment and supply. To assess the compatibility, it is necessary to determine the equipment’s sensitivity. This information can be obtained from equipment manufacturers, doing tests or taking typical values from
12 the technical literature. A typical representation of this information is the voltage tolerance or power acceptability curve presented in Figure 1.4, page 6. In addition to the description of the equipment sensitivity, it is necessary to determine the expected electrical environment. The traditional way to do this is by means of power quality monitoring. The main purpose of a motoring program is to support the description of the expected electrical environment for end-user’s equipment. However, this strategy is costly and time demanding. Monitoring presents limitations when used to estimate frequencies of nonfrequent events at a single site. It has been reported (Bollen, 1999) that the monitoring interval required is one year to obtain a 10% accuracy when the expected average rate is around 1 per day. If the expected event rate is 1 per month 30 years of monitoring are needed to obtain a 10% accuracy. Table 1.1 reproduces the results reported in (Bollen, 1999). Table 1.1 is based on the assumption that timebetween-events is exponentially distributed, which means that the number of events within a certain period is a stochastic variable with a Poisson distribution. Under that condition for an event with a frequency of μ times per year, the monitoring period should be at least 4/(μ.ε2) to obtain an accuracy ε. Table 1.1: Monitoring Period Needed to Obtain a Given Accuracy (Bollen, 1999) Event Frequency 1 per day 1 per week 1 per month 1 per year
required accuracy 50% 10% 2% 2 weeks 1 year 25 years 4 months 7 years 200 years 1 years 30 years 800 years 16 years 400 years 10,000 years
Event frequencies are needed to estimate the number of expected tripping of equipment due to power quality events. Therefore, also low frequencies of one event per month or even one event per year are important. In this work, stochastic prediction methods are proposed for the characterisation of the electrical environment, but monitoring should not be put aside. Monitoring is needed for the adjustment of the stochastic method. Stochastic prediction methods use modelling techniques to determine expected value, standard deviation and other statistics of the stochastic variable. The great advantage of these methods compared to monitoring is that results are obtained right
13 away and different system configurations can be studied during the planning stage. Once the electrical environment is described and the sensitivity of the equipment is determined, the compatibility between electrical supply and equipment can be decided.
1.7 Literature Review It is difficult to identify when a real concern for statistics on magnitude and duration of voltage dip started. Voltage dips have occurred in electrical networks since the very beginning of its time. For long the main concern was on dips caused by motor starting. Prior to 1990, very little detailed information was available on the frequency and duration of dips. Stochastic assessment of dips was an unknown term and monitoring programs were very few. In 1985, at the Athens Congress of the union of electricity companies in Europe UNIPEDE, (today Euroelectric), a group of experts was appointed to improve the knowledge of the severity and rates of occurrence of voltage dips in public electricity networks. A report of the study was released in 1991 (Davenport, F., 1991). Among the conclusions, the report highlights 1) that voltage depressions in the range of 0-60% and up to 500 ms arise from transient faults on higher voltage systems, mainly transmission system, and 2) the high incidence of transient events (lighting, gales) on the number of dips recorded for other than cable networks. The report was submitted to the International Electrotechnical Commission IEC to enable compatibility levels and immunity limits to be established. In the nineties three large monitoring programs were performed in the USA and Canada with the main objective of profiling the power quality (Dorr, 1996) resulting in several papers reporting the results. The Canadian Electrical Association began the CEA survey in 1991. Koval and Hughes (1996) report frequency of dips at industrial and commercial sites in Canada. The threshold chosen for dips was 90% of the nominal voltage and among the conclusions they highlight that the majority of the dips have their origin inside the industrial plant. In response to the lack of information on the nature and magnitude of power disturbances at typical 120 Volts AC wall receptacles, the National Power Laboratory, NPL, initiated in 1990 a power quality study (Dorr, 1992). Hundreds of site-months of power line disturbances were accumulated. The voltage dip threshold was fixed at 104 Volts, but a decrease in voltage for more than 30 cycles (1/2 second) was considered as undervoltage. Dorr (1992) presents results
14 of 600 site-months and compares the recorded disturbances with the CBEMA curve. The author concludes that the large number of disturbances found at typical locations suggest the need for power conditioning or protection for computers and sensitive electronic equipment. The same author (Dorr, 1994) presents a study of 1057 site-months based on the same NPL monitoring program. Conclusions show that there is a wide variation between the best site and worst site for each event category. Seasonal variation is also highlighted showing somehow the limitation of the monitoring programs for characterisation of individual sites. The Electric Power Research Institute EPRI commissioned a survey entitled “An Assessment of Distribution Power Quality” (Dorr, 1996). From June 1993 to September 1995 a total of 227 sites ranging from 4.16 kV to 34.5 kV were monitored. One third of the monitors were located at substations. Monitors in feeders were randomly placed along them. A paper by Wagner et al. (1990), which focuses on industrial power quality, raised an important question regarding the incidence and consequence of dips. It states that it is surprising that manufacturers and users have not focused more attention on dips considering their incidence and consequences. The main conclusion is that dips were the most common disturbance at a typical manufacturing plant. Conrad and co-authors (Conrad, 1991) are the pioneers in stochastic assessment of dips although they do not use this word in their paper. Their work is the foundation of Chapter 9 of the Gold Book (IEEE Std 493, 1997). Conrad and co-authors raised the importance of dips originated by faults and combine accepted analysis tools to predict important characteristics of this kind of voltage disturbances. Frequency, magnitude and duration of dips can be predicted by using three basic tools: short-circuit fault techniques, fault clearing device characteristics and reliability data. The magnitude of the dips is predicted by simulating a fault, the frequency of dips is found by considering the fault rate of lines and buses and the duration is determined by taking typical values of fault clearing time. Another issue raised in this paper is the effect of delta-wye connected power transformers on dips. It is reported that transformers alter the voltage disturbance making a dip caused by a phase-to-ground fault to appear as a dip caused by a phase-to-phase fault and vice versa. Electricite de France (1992) developed CREUTENSI, a software that using the number of faults and reclosing was able to predict the disturbance levels in terms of dips and interruptions. The approach is
15 somehow similar to the one proposed by Conrad et al. (1991), but additionally it proposed the use of a statistical distribution pattern for the magnitude of dips. This pattern segments the voltage drops in four intervals: 10-20%, 20-40%, 40-60% and 60-100% of voltage depression. Less severe dips, 10-20%, are the most frequent with a 57% of occurrence whereas most severe dips, 60-100%, are the less frequent with a 6% of occurrence. In 1991 McGranaghan and co-authors (1991) present a paper that follows the same trend shown in the previous publications: combining fault rate and fault response of the network a stochastic assessment of dips can be performed. A new concept is introduced, area of vulnerability, that relates the sensitivity of the load and the potential area where faults may cause a severe dip. Bollen (1993 a,b) incorporates in the reliability analysis of industrial plants the effect of voltage dips. Using Monte Carlo simulation the author gets a reliability assessment of the industrial plant which includes long and short interruptions as well as voltage dips. The same author (Bollen, 1995) proposes a simple voltage divider for prediction of the magnitude of dips in radial feeders. The paper introduces the concept of “critical distance” to identify the length of the feeder exposed to faults that may cause a severe dip at the load position. It also shows that the contribution of feeder faults to the number of dips with a voltage magnitude less than V p.u. is proportional to V/(1-V). The author (Bollen, 1995) applies the voltage divider model to sub-transmission loops and combines the residual voltage during the occurrence of faults with the fault rate to determine the expected number of trips due to severe dips. Additionally the paper introduces the concept of “critical angle jump” which is the phase angle jump that may trip sensitive equipment. This angle is the difference in phase angle with respect to the phase angle of the pre-fault voltage. Ortmeyer and Hiyama (1996 a) introduce the concept of coordination of time overcurrent devices with sag capability curves for radial feeders. The available short-circuit current levels are combined with the dip at the load point producing a voltage current characteristic for the load point. This characteristic is then combined with the voltage tolerance curve of the sensitive load to determine the current-time curve of the protection devices. The same author introduces the concept “footprint” of faults (Ortmeyer, 1996 b). A footprint is a plot in a voltage-time plane that shows all the potential dips caused by faults. The footprint is then combined with the fault
16 rate to determine frequency, duration and magnitude of dips in the load point. Bollen and co-authors (1997) formally propose the method of critical distance for stochastic assessment of dips. The method is based on a voltage divider that gives the magnitude of the dip in terms of feeder and source impedance. Writing the distance to the fault in terms of the feeder impedance, an expression of the critical distance can be derived. Combining this expression with the fault rate, the expected number of spurious trip due to dips can be found. The method is also presented in (Bollen, 1998 a) and further developed in (Bollen, 1998 b). The latter paper presents the exact equations for the critical distance and extends the method to non-symmetrical faults. In (Bollen, 1998 c) the method of critical distances is compared with another named method of fault positions. The latter one is a straightforward method based on the simulation of short circuits through the system. Combining the voltage during the fault with the fault probability a stochastic assessment of voltage dips can be performed. The conclusions indicate that the method of fault positions is more suitable for meshed systems. The paper also raises the unsuitability of monitoring for characterisation of dip activity at individual sites, however it stresses the need for validation of the stochastic methods by means of monitoring, after which the method can be used without continuous verification. The method of fault positions is applied by Qader (1999) to determine the expected number of dips in buses of a large transmission system. The paper introduces graphical ways of presenting the results obtained from the stochastic assessment. The exposed area (or area of vulnerability) is the area where faults will cause dips more severe than a given value. The voltage dip map is a representation of the quality of supply in terms of sags around the network. In a voltage dip map, lines enclose buses with similar number of expected sags. The conclusions raise several issues. The number of expected dips varies significantly throughout the system showing that the average number cannot be used to characterise any individual site. It also highlights the effects of the generation scheduling and the need for considering the variation in the expected number of dips in monitoring programs. The comparison between power quality monitoring and predicted results is undertaken by Sikes (2000) and Carvalho (2002 a,b). Sikes (2000) concludes that the characteristics of the dips are very predictable, however some tuning of the stochastic method is needed. The tuning can be accomplished by using actual meter data to scale
17 the event rate results. If the simulation is intended to examine performance characteristics for changes in system topology, then only relative results are needed. It is argued that calibration of the predicted events to those actually experienced is the benefit of installing power quality monitoring meters. Carvalho et al. (2002 a,b) confirm the conclusions derived by Sikes (2000). The study was based on the Brazilian transmission network. A classification of the possible errors is made and some compensation factors are introduced in order to scale the stochastic results. Both deterministic results, due to short circuit simulation, and stochastic results, due to fault occurrence, show an acceptable error below 11%. The effects of pre-fault voltage, networks topologies, embedded generation and motors are analysed by Milanovic (2000) and Gnativ (2001). These authors raise the fact that the area affected by voltage dips following a short circuit increases if the network is more interconnected. Embedded generation reduces the magnitude of dips and the same effect is reported for induction motors. Heine and co-authors (2001) also analyse the effect of distribution system design in voltage dips. However, their work is mainly focused on comparing rural and urban networks. They conclude that urban customers seem to experience less dips compared to rural customers the main reason being shorter total feeder length of urban networks. A paper by Carvalho (2002 c) presents an overview of methods and computational tools that are currently in use for simulation of voltage sags. The methods of fault positions and critical distances are presented and six computational tools are discussed. VSAT (EPRI/ELEKTROTEK, USA); VSAG (Pacific Gas & Energy, USA); PTI (Power Technology Inc., USA); ANAQUALI (CEPEL, Brazil); software of PUC-BH, (Catholic University of Belo Horizonte, Brazil) (Alves, 2001 and Fonseca 2002) and VISAGE (Federal University of Itajuba). Only the last two tools, developed at universities, include estimation of the duration of dips. In general all the applications use short-circuit theory to calculate the during-fault voltage. Then they combine the stochastic information given by the fault rate to get an estimation of the expected number of dips and their characteristics. The tool reported by Fonseca (2002) combines Monte Carlo simulation with a big database of during-fault voltage to incorporate the uncertainties in the fault position. A Monte Carlo approach is reported by Martinez (2002). An EMTP based tool is assembled to a Monte Carlo module in which several
18 uncertainties are considered. Simulations are performed in the time domain by means of EMTP-type tools. An analytical approach to probabilistic prediction of voltage dips in transmission networks is proposed by Lim and Strbac (Lim, Y. S., 2002). The probability density function of voltage-dips caused by faults across the network is determined. The residual voltage at an observation bus is expressed as a function of the position of a moving fault node providing a deterministic relation between two stochastic variables, fault position and residual voltage. Although powerful, the method is hard to understand and difficult to implement. Bollen et al. propose a method to extract the phasor information from the three rms voltages only (Bollen, 2004). The method can be used to translate voltage dip statistics of the network into information for the end user or to compare voltage dip measurements realized at different voltage levels or with different monitor connections (start or delta). The phase-angle jump is recognised as a limitation of the method since for large phase angle the method may fail. Milanovic et al. (Milanovic, 2005) analyse the influence of modelling of fault distribution along transmission line on the assessment of number and characteristics of voltage sags. Different fault distributions along a line crossing the border of the exposed area of a sensitive load are used to explore the effect on the stochastic assessment of voltage sags. The study shows that depending on the fault distribution (uniform, normal, exponential) along the line, different number of voltage dips could be expected at the selected bus.
1.8 Literature Discussion In the previous section, a literature review has been presented. The following conclusions can be derived: • Voltage dips are one of the most important power quality disturbances for industrial customers (Wagner et al. 1990). • Voltage dips are caused by faults and other large increases in currents both inside the industrial plants and outside of them. • Monitoring cannot be used to characterise individual sites due to the stochastic nature of dips. However, monitoring is needed to adjust the stochastic methods. • Stochastic assessment of dips combines deterministic results obtained from short-circuit calculations with stochastic information about the probability of faults around the system. Two methods have been reported: method of critical distances
19
•
• •
and method of fault positions. Considering typical fault clearing times, duration of dips can be included. In the method of fault positions, several faults are simulated around the system. The residual voltage during the fault is then combined with the fault rates to obtain a stochastic evaluation of dips. Uncertainties are taken into account by means of average values or by means of Monte Carlo simulation. It seems that no research has been published in which monitoring and stochastic assessment are combined to profile the performance of an entire network.
1.9 The Project The first stage of this project started in September 2001 and ended in September 2003. During this stage stochastic methods for voltage dips characterisation of large transmission systems were introduced. The project also resulted in the definition of an optimisation problem that allows us to find the minimum number of monitors in order to describe the dip performance of a large transmission system. The second stage started in September 2003. The main scope is the application and further development of the methods developed during the first stage of the project. The techniques for optimal location of power-quality monitors is combined with stochastic prediction methods resulting in a method for voltage dip estimation. The results obtained from the project can be summarized in four points: • Further knowledge on the relation between system design and voltage-dip performance. • Better understanding of strengths and weaknesses of the method of fault positions for stochastic assessment of voltage sags. • Better understanding of the strengths and weaknesses of different voltage-dip indices; especially as far as the relation with monitor locations is concerned. • Methods for estimating voltage-dip frequency on busses not directly monitored. A list of publications resulting from the first and second stage of the project is given in Section 1.9.2.
20 1.9.1 Industrial Relevance Voltage dips are a serious concern for many industrial customers. For example, a sag to 50% 100 ms may lead to a 24-hour production stoppage for a paper mill. Voltage dips compete with long interruptions for the type of disturbance causing the largest annual economic impact. The recent occurrence of a number of large-scale blackouts has somewhat pushed power-quality disturbances into the background. However the average customer may experience one large-scale blackout every 10 or 20 years, but about 20 voltage dips per year. Performance assessment of the power supply is an essential part of any well-functioning electricity market. Nowadays, the emphasis in the discussions is still too much on the collection of statistics on voltage dips. This is in part due to the lack of proper methods for prediction of the performance beforehand. Stochastic prediction of voltage dips is such a method. Discussions in various international working groups on voltage dips confirm the need for such methods. Methods in which limited monitoring results are combined with stochastic prediction techniques not only are expected to give higher accuracy in the results but also to lead to a wider acceptance of the prediction techniques. Wind power is, next to hydro and biomass, the renewable source with the largest short-term potential. The developments in this area are clearly towards very large offshore installations. Contrary to small wind power sites, these large sites should not trip due to a voltage dip. It will however not be feasible, to make these installations immune to any disturbance. To judge the need for immunity requirements knowledge is required on the frequency of voltage dips with different characteristics, at the terminals of the wind turbines. Stochastic assessment of voltage dips may help to obtain such information without the need for expensive power quality monitoring programs. This project contributes towards the theoretical foundations of these methods, and further develops them. 1.9.2 List of Publications This dissertation is partially based on the work reported in the following publications. [1] Olguin, G. and Bollen, M.H.J. “Stochastic Prediction of Voltage Sags: an Overview”, Proceedings of 7th International Conference on
21 Probabilistic Methods Applied to Power Systems, PMAPS 2002, Vol. 2, pp. 551-556, September 22-26, Naples, Italy. [2] Olguin, G. and Bollen, M.H.J. “The Method of Fault Position for Stochastic Prediction of Voltage Sags: A Case Study”, Proceedings of 7th International Conference on Probabilistic Methods Applied to Power Systems, PMAPS 2002, Vol. 2, pp. 557-562, September 22-26, Naples, Italy. [3] Olguin, G. and Bollen, M.H.J. “Stochastic Assessment of Unbalanced Voltage Dips in Large Transmission Systems” Power Tech Conference Proceedings, 2003, IEEE Bologna, Vol.4, 23-26 June 2003. [4] Olguin, G. and Bollen, M.H.J. “Optimal Dips Monitoring Program for Characterization of Transmission System”, Power Engineering Society General Meeting, 2003, IEEE, Vol.4, 13-17 July 2003 pp. 2484-2490. [5] Olguin, G., Vuinovich, F., Bollen, M.H.J. “An Optimal Monitoring Program for Obtaining Voltage Sag System Indices” IEEE Transaction on Power Systems, manuscript number TPWRS00257-2004.R1, in print. [6] Olguin, G. Leborgne, R. Coelho, J. “Ensuring Electromagnetic Compatibility by Analytic Study of Voltage Dips Caused by Faults”. Proceedings of IEEE Induscon Conference 2004, October 12-15, Joinville, Brazil. [7] Olguin, G., Bollen M., Karlsson D. “Voltage Sag Estimation in Power Systems via Optimal Monitoring and Stochastic Assessment”, submitted to IEEE Transactions on Power Systems, manuscript number TPWRS-00181-2005. [8] Olguin, G., Karlsson, D. Leborgne, R. “Stochastic Assessment of Voltage Sags (Dips): The Method of Fault Positions versus a Monte Carlo Simulation Approach”. To appear in Conference Proceedings of IEEE St. Petersburg Power Tech 2005, 27-30 June 2005, St. Petersburg, Russia. [9] Olguin, G. “An Optimal Trade-off between Monitoring and Simulation for Voltage Dips Characterization of Transmission System”. Submitted to IEEE PES Transmission and Distribution Conference and Exhibition, August 14-18 2005, Dalian, China. [10] Olguin, G., Aedo, M., Arias, M., Ortiz, A. “A Monte Carlo Approach to the Method of Fault Positions for Stochastic Assessment of Voltage Dips (Sags)”. Submitted to IEEE PES Transmission and Distribution Conference and Exhibition, August 14-18 2005, Dalian, China.
22
The author has also participated in the following publications not fully addressed in this dissertation. [11] Bollen, M. H. J., Olguin, G., Martins, M. “Voltage Dips at the Terminals of Wind Power Installations”. Proceedings of Nordic Wind Power Conference, NWPC 2004, Gothenburg, Sweden March 2004. [12] Di Perna, C., Olguin, G., Verde, P., Bollen, M.H.J. “On Probabilistic System Indices for Voltage Dips”. Proceedings of International Conference on Probabilistic Methods Applied to Power Systems, 2004, 12-16 Sept. 2004 Pages: 796-800. [13] Leborgne, R., Olguin, G., Bollen, M. H. J. “Sensitivity Analysis of Stochastic Assessment of Voltage Dips”. Proceedings of International Conference on Power System Technology 2004, POWERCON 2004, November 21-24, Singapore. [14] Leborgne, R., Olguin, G., Bollen, M.H.J. “The Influence of PQMonitor Connection on Voltage Dip Measurements” Proceedings of 4th Mediterranean Conference on Power Generation, Transmission and Distribution 2004, MedPwer 2004, November 14-17, Lemesos, Cyprus. [15] Leborgne, R., Karlsson, D., Olguin, G. Analysis of Voltage Sag Phasor Dynamic”. To appear in Conference Proceedings of IEEE St. Petersburg Power Tech 2005, 27-30 June 2005, St. Petersburg, Russia. The author of this dissertation has also participated in the preparation of the following CIGRE report to be released by December 2005. [16] CIGRE TF C4.1.02 J. A. Martinez-Velasco (Convenor) “Voltage Dips Evaluation and Predictions Tools”
1.10 Dissertation Outline The dissertation is organised in ten chapters. Chapter 1 has introduced the general background of the work. The rest of the dissertation is organised as follows. Chapter 2: Modelling and Tools The aim of this chapter is to present the tools that are needed to develop the stochastic assessment of voltage dips via the method of fault positions. It presents a discussion regarding the stochastic nature
23 of voltage dips and the meaning of fault rate in power systems. Basic concepts of stochastic processes are also discussed. The impedance matrix of a power system is studied. The focus is on how to build the impedance matrix and on the meaning of its elements. The chapter also presents the symmetrical component technique for short-circuit calculations. Chapter 3: Magnitude and Classification of Voltage Dips This chapter derives equations for calculating the magnitude of dips caused by faults in meshed systems. A classification of dips is presented. The characteristic voltage for different type of dips is introduced. Equations for unbalanced dip magnitude are derived. Phasor diagrams are used to illustrate the dip types. The effect of transformers on the type of dip is discussed and the equations that take into account this effect are derived. Chapter 4: Propagation and Counting of Voltage Dips in Power Systems This chapter introduces the method of fault positions for stochastic assessment of voltage dips in large transmission systems. A hypothetical transmission system is used to introduce the method. The area affected by a fault is graphically described. Similarly, the exposed or area where the occurrence of faults leads to severe dips at a given observation bus is described on the one-line diagram of the network. Chapter 5: Method of Fault Positions: Simulations and Results Results of the stochastic assessment of voltage dips via the method of fault positions are presented. An existing large transmission system is used to illustrate the method. Results are presented by using tables and graphs. The exposed and affected areas are determined for some selected buses. Chapter 6: Optimal Monitoring Programs This chapter introduces an integer optimisation model in order to determine the optimal locations for a limited number of monitors. The monitor reach area is introduced to describe the area that can be monitored from the meter position. A number of cases are solved for different monitor thresholds. System indices are calculated based on a limited number of monitors optimally located.
24 Chapter 7: Analytic Approach to the Method of Fault Positions This chapter presents an analytic approach to the method of fault positions. The aim of the approach is to solve the issue of finding the right number of fault positions. The analytic method is based on the algebraic description of the residual voltage at an arbitrary observation when a moving fault node is considered at any line. Chapter 8: Comparing Stochastic Assessment and Measurements Chapter 8 shows that the results from the method of fault positions are for long-term and that comparisons with actual measurements require adjustments. Fault scenarios are arbitrary created to simulate the outcome of a monitoring program, and results are compared against the prediction via the method of fault positions. A Monte Carlo approach to the method of fault positions is implemented to better describe the potential outcome of a monitoring program. Chapter 9: Voltage Dip (Sag) Estimation This chapter presents a method to estimate the dip performance at buses not being monitored. Finding fault positions likely to cause the residual voltages seen at some buses through power quality meters (limited monitoring program) and performing stochastic assessment around triggered monitors, the results of monitoring are extended to non-monitored buses. The algorithms for practical implementation are presented and tested in a 87-bus test system showing the applicability of the proposed method. Chapter 10: Conclusions and Future Work The chapter presents conclusions derived from this work. Several research issues are identified and proposed for future work.
1.11 Main Contributions of this Work This dissertation reports the research work developed by the author during the past four years. It introduces the causes of voltage dips and their effects on sensitive loads. It provides a basic review of fault analysis in power systems to better understand the method of fault positions for stochastic assessment of voltage dips. The main contributions of the work can be summarised as follows: 1. It derivates the equations needed to calculate the complex residual voltage during the occurrence of faults in a power system. It models the effect of power transformers on the dip
25
2.
3. 4.
5. 6.
type and presents clear algorithms to perform stochastic assessment of voltage dips via the method of fault positions. It presents applications of the method of fault positions to an existing power system. It investigates the contribution of symmetrical and unsymmetrical faults to the total number of dips seen at an observation bus. It proposes an analytic approach to the method of fault positions that overcomes the issue of the appropriate number of fault positions. It discuses the drawbacks of the method of fault positions, in particular it raises the fact that the method cannot be used to predict the dip performance during a particular year. It proposes an alternative approach via Monte Carlo simulation that provides the complete spectrum of possible outcomes. It proposes a method for optimal monitoring programs that makes it possible to obtain voltage dips indices to characterise the complete network with a minimum number of monitors. It introduces a method for voltage dip estimation that extends results from limited monitoring to buses not being monitored.
The dissertation is self-contained and provides complementary references to issues not fully addressed in this work.
26
27
2 Modelling and Tools This chapter presents the modelling chosen for the stochastic assessment of voltage dips. The stochastic nature of voltage dips and the meaning of the fault rate of transmission lines and buses are discussed. The bus impedance matrix is presented as a suitable modelling of the network for dip simulation. The well-known impedance-building algorithm is presented and discussed. Symmetrical and unsymmetrical faults are described and their equations are used to qualitatively describe the during-fault voltages.
2.1 System Modelling The first step in the analysis of a system-disturbance interaction is the development of a suitable mathematical model to represent the reality. A suitable mathematical model is a compromise between the mathematical difficulty attached to the equations describing the system-disturbance interaction and the accuracy desired in the result. Voltage dips can be studied from different perspectives and the model used to describe the disturbance needs to satisfy the study objectives. Depending on the objective of the study the modelling must be able to give a reasonable representation of the reality.
Approximation used in this thesis
Figure 2.1: Sliding-window rms voltage versus time, for the three phases.
The objective of this work is the development of techniques for obtaining statistics on the magnitude of fault-originated sags. For that objective, a modelling based on phasors is considered suitable. It should be noted that the use of phasors restricts our model to the context of steady state alternating linear systems. The modelling used
28 in this dissertation is intended to give us the residual voltage during the fault and not the evolution as function of time. Figure 2.1 shows a three-phase unbalanced voltage dip in an 11 kV distribution network and the approximation considered in this dissertation. Depending on the fault type the shape of the rms voltage evolution will show different behaviours. A detailed discussion about this issue is contained in (Styvaktakis, 2002). To introduce the basic ideas, consider a radial distribution feeder supplied from a busbar that also supplies a sensitive load. Suppose that we are interested in finding the residual voltage at the bus feeding the sensitive load during a fault at some point along the feeder. Assuming a no load condition, the voltage during the fault can be calculated by means of the voltage divider model shown in Figure 2.2. PCC E
Load or Monitor
Zs
ZF
Figure 2.2: Voltage divider for dip magnitude calculation
In Figure 2.2 PCC is the point of common coupling between the load current and the fault current. It is the point where the magnitude of the dip needs to be estimated. ZS is the source impedance and ZF is the impedance between the PCC and the fault point. If the voltage behind the source impedance is assumed 1 p.u., then the voltage during the fault at the PCC is given by 2.1. __ (2.1) __ ZF Vdip = __ __ (p.u.) ZF + ZS Equation (2.1) is suitable to analyse radial systems and is the basis of the method of critical distances discussed in section 2.3. For more complicated networks as meshed transmission systems, matrix calculation is more appropriate. In that case, the impedance matrix is used to represent the system. The admittance matrix could also be used to describe the system. However, the computational effort involved in the during-fault voltage calculation is larger when using the admittance matrix than when using the impedance matrix
29 (Anderson, 1973). In this work, the impedance matrix is used to model the system. Faults in power systems can be symmetrical and unsymmetrical leading to balanced and unbalanced dips, respectively. For symmetrical faults only the positive sequence network is required to analyse the during-fault voltage. However the majority of the faults are single-phase-to-ground faults requiring the use of symmetrical components in the analysis. As stated above, the main objective of this work is the development of techniques for obtaining statistics on magnitude of fault-originated voltage dips. The proposed modelling allows determining the magnitude of the dip for a given fault, however nothing has been said about the frequency of the event. For the stochastic assessment of dips one is interested in the expected number of events and their characteristics. To take into account this, the likelihood of the fault needs to be considered. The most important reliability data required for this is the fault rate, given in terms of a mean value of faults per year for each power system component. Summarising the modelling chosen can be described by: • The system is supposed to be composed of lines, power transformers, generation machines and buses. • The system is balanced before the occurrence of the disturbance. This allows the independence of component sequences. • The sequence impedance matrices are used to model the power system. • Unsymmetrical faults are modelled by symmetrical components. • The likelihood of faults is represented by the fault rate. The coming sections present a review of the theoretical background. The material presented here is easily available in most textbooks on power systems. The discussion focuses on the application of these theories to the stochastic assessment of voltage dips.
2.2 The Stochastic Nature of Voltage Dips For the purpose of this dissertation, a voltage dip is caused by a fault. Here it is worth noting the difference between failure and fault. Failure is the termination of the ability of an item to perform its required function whereas faults are short circuits caused by dielectric breakdown of the insulation system. A failure does not need to be fault, but a fault usually leads to a failure.
30 Faults can be categorised as self-clearing, temporary, and permanent. A self-clearing fault extinguishes itself without any external intervention. A temporary fault is a short circuit that will clear after the faulted component (typically an overhead line) is de-energized and reenergized. A permanent fault is a short circuit that will persist until repaired by human intervention (Brown, 2002). Faults can be observed at the customer’s premises as long interruptions, short interruptions, dips and swells. Swells are a temporary increase in the rms voltage. Outages occur when permanent faults take place in the direct path feeding the customer. Short interruptions are the result of temporary faults cleared by the successful operation of a breaker or recloser. Dips and swells occur during faults on the system that are not in the direct path supplying the load. Faults are of a stochastic nature and so are the dips caused by these faults. Several random factors are involved in the analysis of voltage dips. An extensive list is presented in (Faired, 2002). • Fault type. Three-phase faults are more severe than single-phase faults, but the latter are much more frequent. • Fault location. Faults originated in transmission systems cause dips that can be seen tens of kilometres away. Faults at radial distribution systems are more frequent but have a localer effect. • Fault initiation angle or point on wave. This uncertainty has an important effect on the ability of some equipment to tolerate the dip (ride-through). It affects the transient behaviour of the fault current, but it does not have much relevance for the counting of events. • Fault impedance. Bolted or solid faults cause more severe dips than impedance faults. In transmission systems, however the fault resistance plays a minor role. • Fault clearing time. A voltage dip lasts for the time the shortcircuit current is allowed to flow throughout the system. Protection devices allow different settings causing dips of different duration. Line protection in transmission grids is usually implemented by using distance protection. If the fault is located in the first zone then the fault duration is typically less than 100 ms, however if the faulted node is in the second zone, then a longer duration (about 400 ms) can be expected. Duration is not study in this work. • Reclosing time. It is common practice to set one or two reclosing attempts in radial distribution feeder protections. This practice is
31 known as fuse saving and has an important impact on the frequency of dips originating at distribution levels. Reclosing can also be found in transmission lines. Some utilities implement only one attempt to clear the fault by means of single or three poles reclosing whereas others use more than one attempt. • Fault duration. The duration of a dip caused by a self-cleared fault depends on the fault itself and not on the protection setting. Most faults in transmission and distribution systems are single-phaseto-ground and self-clearing faults. They may occur due to lightning and over-voltages created by switching and other phenomena. • Power system modifications. The impedance between the point of observation and the fault point affects the residual voltage during a fault. However the system is not static and changes that affect this impedance are continuous. A new line can be built, a transformer can be taken out of the system or a new power station can be put into operation. • Severe weather. The occurrence of faults and hence of dips is notoriously higher during severe weather, which can take many forms as wind, rain, ice, snow, lightning, etc. The previous list of random factors is not complete but is sufficient to illustrate the stochastic nature of voltage dips. Having in mind that dips are of a stochastic nature, our description of the disturbancesystem interaction needs to be probabilistic. The main two factors to be considered in this probabilistic approach are the fault rate and the fault position. The following section gives a discussion about the fault rate. 2.2.1
Fault Rate and Stochastic Models
Reliability of power systems is a well-developed area of power system knowledge (Billinton, 1983). In order to estimate the reliability performance, the analysed power system has to be represented by stochastic components. A stochastic component is a component-model with two or more states. The transition from the present state is selected randomly from the possible next states. The basic variable in reliability evaluation is the duration for which a component stays in the same state. This is a stochastic quantity because its precise value is unknown. However, the mean duration value of staying in each state can be used to give the average performance of the system. For the purpose of this dissertation, two states of a power system component can be identified: operative and
32 faulted state. During the faulted state, the component is submitted to reparation and so this state is known as repair state. Figure 2.3 shows a two-state model and their transitions.
Operative
D1
D2
D3
D4
Faulted T
Time
Figure 2.3: Single component system: Mean time diagram.
The diagram presented in Figure 2.3 may represent the behaviour of a transmission line or a bus of a transmission system. In that case, Di is the time the line is in operation without a fault being present. The average value of Di (within the cycle time T) is called mean time to fault. In this work, the interest is in the expected number of faults that may lead to a dip and for that purpose the transition rate between the operative and faulted state is useful. This transition rate is called fault rate λ and is the rate at which faults occur in a healthy component. Numerically, it is given by the reciprocal of the mean time to fault. When the cycle time T is much longer than the mean time to fault, the fault rate is numerically similar to the frequency of encountering a system state. Power system components have a high availability, meaning that the time in the operative state is much longer than the time in the faulted state. In this case the frequency of encountering a state and the fault rate have approximately the same value. In practical terms the fault rate is calculated by examining the historical performance in terms of faults occurring on a component of the system. The average number of faults during a period of some years, is used as an indicator of the fault rate.
2.3 Method of Critical Distance Bollen (1999) proposed the method of critical distances as a fast assessment method for voltage dips in distribution systems. The method uses the simple voltage divider model shown in Figure 2.2 to estimate voltage dips due to short circuit faults in distribution feeders. Despite the fact that the method is based on simplifications as no load and a unique feeder, it facilitates the understanding of key concepts related to the matter of this work. A brief review of it is presented here.
33 In equation (2.1) ZF is a function of the fault point whereas ZS is a function of the point of common coupling, PCC. This means that for a given PCC the source impedance ZS is fixed whereas the feeder impedance to the fault ZF depends upon the location of the fault along the feeder. Equation (2.1) shows that the residual voltage becomes lesser for faults electrically closer to the PCC. A critical residual voltage Vcrit that depends upon the sensitivity of the load is used to estimate the expected number of trips due to voltage dips. It is assumed that the load will certainly trip if the residual voltage goes below Vcrit. To find out the number of dips with residual voltage below than Vcrit we write (2.1) for Vcrit and get: ____ (2.2) __ Z Fcrit Vcrit = ____ __ Z Fcrit + Z S In (2.2) we have replaced Vdip by Vcrit and ZF by ZFcrit to emphasize that there is a point on the feeder (critical point) where the impedance to the PCC is the critical impedance ZFcrit. Faults on the critical point will cause residual voltages equal to the critical voltage, faults between the PCC and the critical point will cause dips with less residual voltage. The critical distance is defined as the length of line exposed to faults that may lead to tripping of sensitive loads. To find the critical distance we express ZFcrit in terms of the length of the feeder measured from the PCC to the fault point. In addition, we introduce the following approximation: the X/R ratios of source and feeder impedances are equal. This assumption may not be valid for different voltages levels and will be corrected latter. Thus, we find an approximate expression for the critical distance. (2.3) Z Vcrit Lcrit = S ⋅ z F (1 − Vcrit ) where zF is the feeder impedance per unit of length (km) and Vcrit is the critical voltage in p.u. The frequency of occurrence is calculated by using the long-term average fault rate. If the fault rate of the feeder is λ faults per kmyear, then the expected number of trips due to voltage sags Fsagcrit can be calculated by multiplying Lcrit by λ. (2.4) Z Vcrit ⋅λ Fsag crit = S ⋅ z F (1 − Vcrit ) Equation (2.4) does not give the total number of sags expected at PCC but only the critical ones, those that will cause equipment trips.
34 To fully describe the PCC in terms of voltage sags it is necessary to segment the residual voltage range and estimate the frequency in each range. Equation (2.4) can also be used for that. We make Vcrit variable and plot Fsag versus residual voltage. Figure 2.4 shows that relation in qualitative terms and corresponds to the cumulative frequency of residual voltages (dips) up to a given magnitude. From Figure 2.3 it is clear that in radial systems the expected number of less severe sags (0.8 < Vsag < 0.95) is much higher than the number of severe ones.
number of events
Dip Frequency
0
0.1
0.2
0.3
0.4
0.5
0.6
0.7
0.8
0.9
1
Residual voltage in pu
Figure 2.4: Relative voltage dip frequency
2.3.1 Phase-Angle Jump and More Accurate Expressions Along with the depression of the magnitude of the voltage, a fault also leads to a change in the voltage phase angle. Phase-angle jumps affect the angle at which thyristors are fired and are therefore of serious concern for some equipment. Under the no load assumption, the phase-angle jump φ is found from (2.1) by taking the argument of Vdip. __ __ __ (2.5) φ = arg(Z F ) − arg(Z F + Z S ) The phase-angle jump is equal to the angle between the feeder impedance ZF and the total impedance up to the fault point ZS + ZF. This is shown in Figure 2.5, where α is the “impedance angle” between ZS and ZF. In mathematical terms: (2.6) ⎛ XS ⎞ ⎛ XF ⎞ ⎟⎟ ⎟⎟ − arctan⎜⎜ α = arctan⎜⎜ R R ⎝ F ⎠ ⎝ S⎠
35 where X and R are the reactance and resistance of feeder (F) and source (S) impedances.
ZS + ZF ZS
ZF Figure 2.5. Phasor diagram with complex impedances
In order to get an expression of the phase-angle jump as function of the distance the cosine rule can be used twice in the lower triangle of Figure 2.5 to give: __ __ 2 __ 2 __ 2 __ __ (2.7) Z S + Z F = Z S + Z F − 2 Z S Z F cos(180 − α )
and: __ 2
ZS
__
__ 2
__ 2
__
__
__
= Z S + Z F + Z F − 2 Z S + Z F Z F cos(φ )
(2.8)
Inserting (2.7) into (2.8) gives an expression for the phase-angle jump as a function of the distance L. (2.9) ρ + cos α cos(φ ) = 1 + ρ 2 + 2 ρ cos α where ρ is a measure of the electrical distance to the fault (2.10) and α the impedance angle (2.6). __ (2.10) L ⋅ zF ρ = __ ZS Accurate expressions for the residual voltage and the critical distance can be derived by considering that the X/R ratios of source and feeder impedance may be different. We now derive such expressions. Taking the modulus of both sides of (2.1) we get (2.11), where the
36 feeder impedance is expressed in terms of the per-unit of length impedance zF. __ (2.11) L ⋅ zF Vdip = __ __ L ⋅ zF + Z S With (2.7) and some algebraic manipulations, the following expression for the residual voltage can be written: (2.12) 1 ρ ⋅ Vdip = (1 + ρ ) 2 ρ (1 − cos α ) 1− (1 + ρ )2 The first factor in the right hand-side of (2.12) gives de dip magnitude when the difference in X/R ratio is neglected (i.e. α=0), the same expression as (2.1). The second factor takes into account the difference in X/R ratio through a value α greater than zero. For α small, the dip magnitude can be calculated with the approximate expression (2.1) without introducing a significant error. To obtain a more accurate expression for the critical distance related to the critical voltage we need to solve ρ from (2.12) and then L from (2.10). Equation (2.12) can be written as a second order polynomial expression in ρ. (2.13) ρ 2 V 2 − 1 + 2 ρV 2 cos α + V 2 = 0 Taking the positive solution of (2.13) and solving for Lcrit the critical distance for a given critical voltage can be found. (2.14) ⎧⎪V cosα + 1 − V 2 sin 2 α ⎫⎪ Vcrit ⋅ Z S crit crit ⋅⎨ Lcrit = ⎬ (1 − Vcrit ) ⋅ z F ⎪ Vcrit + 1 ⎪⎭ ⎩ Note that the expression (2.3), derived assuming equal X/R ratios, differs from (2.14) only in a factor k, defined by: (2.15) 2 Vcrit cos α + 1 − Vcrit sin 2 α k= Vcrit + 1 The more this k factor deviates from one, the larger the error made by using the simplified expression (2.3). The simplified expression (2.3) overestimates the critical distance, but the error is small, with the exception of systems with very large phase-angle jumps.
(
)
37
2.4 The Impedance Matrix This dissertation focuses on dips caused by short-circuit faults. An electrical network under short-circuit fault conditions can be considered as a network supplied by generators with a single load connected at the faulted bus. The pre-fault load currents can usually be ignored since they are small compared to the fault current. Usually they are considered by means of the superposition theorem if needed. It was recognised very early that if the bus impedance matrix Z, with its reference bus chosen as the common bus behind the generator reactance is available, the complete fault analysis of the network can be readily obtained with a small amount of additional computation (Brown, 1985). The use of the impedance matrix provides a convenient means for calculating fault currents and voltages. The main advantage of this method is that once the bus impedance matrix is formed the elements of this matrix can be used directly to calculate the currents and voltages associated with various types of faults. In this section key concepts regarding the impedance matrix are discussed. 1 2 Ii
k i
Vi
General n-port passive linear network
n reference
Figure 2.6: A general n-port network.
Consider the general n-port passive linear network of Figure 2.6. Equation (2.16) expresses the network-node voltages. v1 = z11 ⋅ i1 + z12 ⋅ i2 + ........z1n ⋅ in
: vk = zk1 ⋅ i1 + zk 2 ⋅ i2 + ........zkn ⋅ in : vn = zn1 ⋅ i1 + zn 2 ⋅ i2 + ........znn ⋅ in
(2.16)
38 It should be noted that (2.16) is valid for the voltages and currents as indicated in Figure 2.6. In other words node currents entering into the network and voltages are measured with respect to the reference node. Also note that we are dealing with complex variables. Equation (2.16) can be written in matrix notation. V = Z⋅I (2.17) where Z is the bus impedance matrix of the network. The impedance matrix contains, in its diagonal, the driving point impedance of every node with respect to the reference node. The driving point impedance of a node is the Thevenin’s equivalent impedance seen into the network from that node. Hence the diagonal elements of the impedance matrix allow determining the short-circuit current of every potential fault at buses of the system. The off-diagonal elements of the impedance matrix are the transfer impedances between each bus of the system and every other bus with respect to the reference node. Both the driving point impedance and the transfer impedance can be calculated from (2.16) making the relevant current equal to 1 p.u. and the rest equal to zero. For instance, (2.18) would give a general entry (k,j) of Z. (2.18)
z kj =
vk ij
i1 =i2 .....=in = 0 i j ≠0
From (2.18) it can be seen that the transfer impedance gives the voltage at bus k when a unity current is injected at node j. Hence the transfer impedance allows us to find the during-fault voltages due to the fault currents. In contrast to the admittance matrix, which is a sparse matrix, the positive-sequence impedance matrix is a full matrix for a connected network. It contains zeros only when the system is subdivided into independent parts. Such sub-networks arise in the zero-sequence networks of the system because of the delta-connected transformer windings or other discontinuity in the zero-sequence network. For a connected network all elements of the impedance matrix are nonzero. However the matrix is diagonal dominant. Diagonal dominance of the impedance matrix Z, mathematically resulting from diagonal dominance of the admittance matrix Y, insures that the transfer impedances are smaller in magnitude than their diagonal counterparts in the same row and column. In turn, the causative diagonal dominance of the admittance matrix Y is assured by the nature of our practical power networks usually involving series impedance
39 corresponding to lines but little shunt capacitance. One could in theory obviate diagonal dominance by increasing shunt capacitance, but this does not occur in practice. The relevance of the transfer impedance zkj is that it can be seen as a measure of the electrical closeness between the buses involved (k,j). Electrical closeness is a measure of the effects of a disturbance. The smaller in magnitude the transfer impedance, the less the impact a change at bus k has on the voltage at bus j. Machine reactances play a major role in the impedance matrix. Since the Thevenin impedances effectively become shunt or Norton admittances at the buses, they have a relevant effect on the complete matrix. In fact, a change in any network impedance will in general affect every term of the impedance matrix. Equation (2.18) suggests that a general entry (k,j) of Z can be calculated by injecting a unity current at j and determining the voltage at node k, when all other currents are zero. Although conceptually correct, this is not a suitable way to determine Z for a big network. The well-known Z building algorithm is presented in the next section for being a useful way to build the matrix and modifications of it. 2.4.1
Bus Impedance Matrix Building Algorithm
The bus impedance matrix can be built element by element by using three algorithms, which represent three potential additions or modifications to the network (Brown, 1985 and Stevenson, 1982): a) Addition of a branch impedance from the reference node to a new bus. b) Addition of a radial branch impedance from an existing node to a new bus. c) Addition of a link impedance between two existing nodes. The building process of the impedance matrix needs to be started with a branch connected to the reference node. The first branch connected to the reference node results in a 1 by 1 impedance matrix formed by the added impedance. The addition of an impedance ξ from a new bus p to the reference node does not affect the elements of the already built impedance matrix. As the new node p is directly connected to the reference through the impedance ξ a current injected into the new node p will produce no voltage on any other bus. The voltage at the new node p will not be affected by any current injected in nodes other than p. All off-diagonal elements of the new row and column, needed to consider
40 the new node, are therefore zero (2.19a). The injection of an unity current in p will cause a voltage equal to ξ at node p. Hence the driving point impedance is equal to the added impedance (2.19b). (2.19a) zip = zip = 0, i ≠ p
z pp = ξ
(2.19b) Once the first impedance connected to the reference node has been assembled into the impedance matrix additional branches can be added. The addition of a radial branch between an already assembled node k and a new node q through an impedance ξ increases the dimension of the impedance matrix. A new row and column need to be added to Z to consider node q. Off-diagonal elements of row and column q can be found realising that a current injected into node q produces voltages on all other buses of the system that are identical to the voltages that would be produced if the current was injected into node k. Hence the transfer impedances of the new node are the same as the transfer impedances of the node at which it is connected (2.20a). The driving point impedance can be found by realising that an injected current into node q produces a voltage at that node that is equal to the voltage at node k plus the voltage drop in the added impedance ξ connecting q and k. Hence the diagonal element in row and column q is given by driving point impedance of node k plus the impedance of the branch being added (2.20b). (2.20a) zqi = ziq = zik , i ≠ q
zqq = zkk + ξ
(2.20b) The third modification considers adding a link between two existing nodes j and k by means of an impedance ξ. In this case no new node is created in the original impedance matrix (old) but all its elements need to be recalculated due to the current flowing through the added impedance ξ between nodes j and k. The current between j and k can be expressed in terms of the added link impedance and nodal voltages, which are functions of the nodal currents. This creates a new equation that needs to be eliminated by a Kron reduction. Equations (2.21) show the new impedance matrix. (2.21a) 1 Znew = Zold − ⋅ M C (2.21b) C = z jj + zkk + ξ − 2 z jk
41 T
⎡z1j − z1k ⎤ ⎡z j1 − zk1 ⎤ ⎥ ⎢ ⎥ ⎢ z z z z − − M= ⎢ kj kk ⎥ × ⎢ jk kk ⎥ ⎢ zij − zik ⎥ ⎢ z ji − zki ⎥ ⎥ ⎥ ⎢ ⎢ ⎢⎣z jj − z jk ⎥⎦ ⎢⎣ z jj − zkj ⎥⎦
(2.21c)
The impedance matrix algorithm is a useful way to model modifications of the original system. For instance, the effect of a new parallel line in the magnitude of the expected dip can easily be taken into account by means of the last modification.
2.5 Symmetrical Components and Fault Calculation Power systems are usually analysed assuming symmetrical and balanced operation. Under this condition, the system and its behaviour can be studied using a single-phase model of the network. When the network itself, the sources, or the loads are not symmetrical and balanced, the single-phase representation is not enough and threephase models are needed. The method of symmetrical components provides a means of extending the single-phase analysis for symmetrical systems subject to unbalanced load conditions or faults (Anderson, 1973). Symmetrical components theory allows analysing an unbalanced set of voltages and currents by means of two symmetrical three-phase systems having opposite phase sequences (positive and negative) plus a third set of three identical vectors having zero phase displacement (zero sequence). The technique requires describing the system by means of its sequence networks: positive, negative and zero. Each sequence network represents the behaviour of the system to that sequence source: voltage or current. Sequence networks are built by means of sequence impedances that represent the element response to each sequence voltage. When a voltage of a given sequence is applied to a device (line, transformer, motor, etc.) a current of the same sequence flows. The device may be characterised as having a definite impedance to this sequence. Special names have been given to these impedances: positive-sequence impedance, negative-sequence impedance, and zero-sequence impedance (Wagner and Evans, 1933). In this work the technique is used to calculate short-circuit currents and the voltages during the fault. For symmetrical faults only the positive-sequence impedance matrix is needed. For non-symmetrical faults the three sequence networks are needed.
42 Equation (2.22) gives the basic transformation for currents, where the superscript z, p, and n identify zero, positive and negative sequence currents and a is the Fortescue transformer a-operator, given by (2.22b). The same equation is valid for voltage transformation. (2.22a) iz 1 1 1 ia 1 i p = ⋅ 1 a a2 ib 3 in 1 a2 a ic a=e
j
2π 3
(2.22b)
From (2.22) it can be seen that any symmetrical component variable current or voltage- is completely determined by its phase components and the other way around. This means that at the observation bus an unbalanced dip can be described by three phase voltages or by three sequences voltages. 2.5.1 Sequence Impedances The impedance encountered by the sequence currents depends on the type of power system equipment: generator, line, transformer, etc. Sequence impedances are needed for component modelling and analysis. In this work, it is assumed that three types of components form the system: transmission lines, power generators and power transformers. The impedance of symmetrical non-rotating apparatus is the same for both positive and negative sequences. Hence the positive and negative sequence series-impedances and shunt-capacitance of transposed lines are equal. The zero-sequence impedance of a transmission line is of different character from either positive or negative-sequence impedance because it involves the impedance to currents that are in phase in the three conductors, which necessitates a return path either in a neutral or ground wire (Wagner and Evans, 1933). The zerosequence impedance of overhead lines depends on the presence of ground wires, tower footing resistance, and grounding and it is between two and six times the positive sequence impedance. The positive and negative-sequence impedances of a transformer are equal to its leakage impedance. As the transformer is a symmetrical static apparatus, the sequence impedances do not change with the phase sequence of the applied balanced voltages. The zero sequence impedance can, however, vary from an open circuit to a low value depending on the transformer winding connection, method of neutral grounding and the core construction (Das, 2002). If there is no path
43 for the zero-sequence current the corresponding zero-sequence impedance is infinite. Delta and ungrounded wye windings present infinite impedance to zero-sequence current. An impedance in a neutral wire or ground connection is zero-sequence impedance, but its value needs to be multiplied by three in the zero sequence model to obtain the equivalent value for phase to neutral. For a synchronous machine three different reactance values are specified (Wagner and Evans, 1933). In positive sequence, Xd’’ indicates the subtransient reactance, Xd’ the transient reactance and Xd the synchronous reactance. These direct axis values are necessary for calculating the short-circuit current at different times after the fault occurs. The positive sequence synchronous reactance, Xd, is the value that is commonly used for problems involving steady state calculations of machine performance. Manufacturers specify negative and zero-sequence impedances for synchronous machines on the basis of test results. The negative-sequence impedance is measured with the machine driven at rated speed and the field windings short-circuited. A balanced negative-sequence voltage is applied and the measurements are made. The negative-sequence reactance is usually approximated to one halve of the direct plus the quadrature axis subtransient reactances. An explanation of this averaging is that the reactance per phase measured varies with the position of the rotor. The zero-sequence impedance is measured by driving the machine at rated speed, field windings short-circuited, all three phases in series and a single-phase voltage applied to circulate a single-phase current. The zero-sequence reactance of generators is low. In general it is much smaller than the positive and negative-sequence reactance. A practical approximation for short-circuit studies is to take the zerosequence reactance of synchronous machines in the range of: 0.15Xd’’ < Xz < 0.6Xd’’ (Anderson, 1973). 2.5.2
Sequence Networks and their Impedance Matrix
If the system is assumed to be symmetrical up to the point of fault, where an unsymmetrical fault occurs, then the three sequence components are independent of each other. Independence of symmetrical components is usually assumed in short circuit studies. The relation that must be satisfied to obtain symmetry of the network is that for every set of self or mutual impedances, the values for each phase must be equal. In transmission lines this is obtained by transposition of phase conductors.
44 Assuming sequence independence, three single-phase sequencenetwork diagrams are required for individual consideration: one for positive, one for negative and one for zero-sequence. These sequence diagrams are single-phase models of the power system and the impedance matrix can be used to model them. For a power system consisting of lines, transformers and generators, the negative-sequence network is a duplicate of the positive-sequence with two exceptions: the negative-sequence network does not contain a source and the negative-sequence reactance of the generator may be different from the positive one. The positive-sequence impedance matrix Zp is structurally equal to the negative one Zn, but numerically different. This numerical difference is small and can be neglected. The zero-sequence network (and its impedance matrix) is in general quite different from positive and negative ones. It has no voltage source, it has discontinuities due to transformer winding connections and the impedance values are different from positive ones. 2.5.3 Fault Current Calculation Once the sequence networks have been built the calculation of the fault currents can be performed. Fault currents are calculated in the sequence component domain and transformed back to phase values. The sequence networks are interconnected in the point of unbalance to describe the border conditions imposed by the fault to the phase quantities. These border conditions are derived from the three-phase diagram corresponding to the fault under consideration. Four shortcircuit faults are considered in this work. It should be noted that equations consider complex variables, however a simplified notation is adopted. The superscripts z, p and n over the variables indicate the zero, positive, and negative sequence components. Three-phase fault. Since the three-phase fault is symmetrical the negative-sequence and zero-sequence currents are zero. Only the positive-sequence network, which is the normal balanced diagram for a symmetrical system, and its impedance matrix are needed to determine the fault current. The fault current, i, is equal to the positive-sequence current. The impedance looking into the network from the faulted bus f is given by diagonal element zff of the positive-sequence impedance matrix. The pre-fault voltage is of positive-sequence and is equal to the pre-fault
45 voltage at the faulted bus. Hence, (2.23) gives the short circuit current and Figure 2.7a shows the sequence network connection. (2.23) v apref ( f ) p i=i =
z ffp z p ff
a) + V
a
b) +
+
V
Vp
pref
z p ff
a
+ Vp
pref
z n ff z n ff
z p ff
c) +
+
V a pref
d)
Vp
+ Vz
z p ff
+ V
z z ff
Vn
+ a
+ Vn
Vp
z n ff
+
+
Vn
Vz
z z ff
pref
Figure 2.7:Sequence-networks diagrams for calculation of short-circuit fault. a) Three-phase fault; b) Single-phase-to-ground fault; c) Phase-tophase fault; d) Two-phase-to-ground fault.
Single phase-to-ground fault (phase a) A single phase-a to ground fault implies the relations described by (2.24) for phase voltages and phase currents at the fault point. Note that the pre-fault currents are neglected. (2.24a) ib = ic = 0 (2.24b) va = 0 Applying the sequence transformation (2.22) to voltages and currents in (2.24) it can be shown that the sequence networks need to be connected in series (Figure 2.7b) to satisfy these conditions in the domain of symmetrical components. The addition of the sequence voltages is equal to va, the faulted-phase voltage, and hence zero. The sequence currents are the same and equal to the reciprocal of the
46 summation of the impedances seen from the fault point of each sequence network. Thus (2.25) gives the sequence currents and fault current. (2.25a) v apref z p n i =i =i = i =
z zff + z ffp + z nff
(2.25b)
3 ⋅ v apref
a
z zff + z ffp + z nff
Phase-to-phase fault(phases b and c) Equations (2.26) describe the border conditions for a phase-to-phase fault. (2.26a) ia = 0 i b = −i c
(2.26b) vb = vc By applying the transformation to sequence components the connection between the sequence networks can be found. The zerosequence current is zero because the fault does not provide a path for the zero-sequence current to flow. Thus the zero-sequence network does not intervene in the analysis. The summation of the sequence currents is equal to ia which is zero for this fault. Hence the negativesequence current is equal to the positive-sequence current but it has opposite direction. The positive and negative-sequence networks need to be connected in parallel to satisfy the fault conditions. Equation (2.27) shows the sequence and fault currents. Figure 2.7c shows the sequence networks connection. (2.27a) v apref z p n i = 0;
i =i =
i = −i = − j ⋅ 3 ⋅ b
c
z ffp + z nff
v apref
(2.27b)
z ffp + z nff
Two-phase-to-ground fault (phases b and c) A two-phase-to-ground fault is similar to a phase-to-phase fault, but in this case there exists a path for the zero-sequence current to flow. The fault can be described in phase domain by (2.28). (2.28a) ia = 0 b c (2.28b) v =v =0 The application of the transformation indicates how the sequence networks need to be connected. The summation of the three sequence
47 currents is equal to ia, which is zero. From (2.28b) it follows that the three sequence voltages are equal indicating the parallel connection of the sequence networks. Equations (2.29) show the sequence and fault currents. Figure 2.7d shows the connection of the sequence networks. (2.29a) v apref p i =
z zff ⋅ z nff z + z z ff + z nff p ff
i = −i ⋅ z
p
i = −i ⋅ n
i =
p
z nff + z zff z nff + z zff
z zff ⋅ z nff z + z z ff + z nff p ff
i =
v apref
c
z zff ⋅ z nff z + z z ff + z nff p ff
2.5.4
(2.29c)
z zff v apref
b
(2.29b)
z nff
⎛ − z nff − a ⋅ z zff 2 ⋅⎜ z +a + z ⎜ z + zn z ff + z nff ff ⎝ ff
⎞ ⎟ ⎟ ⎠
(2.29d)
⎛ − z nff − a 2 ⋅ z zff ⎜ ⋅ z +a+ z ⎜ z + zn z ff + z nff ff ⎝ ff
⎞ ⎟ ⎟ ⎠
(2.29e)
Neutral System Grounding
Power systems are said to be solidly grounded if the neutral of transformers or generators are connected directly to ground; impedance grounded if an impedance (resistor or reactor) is connected between the neutral and ground, and ungrounded if there is no intentional connection to ground. Grounding practices have an important effect on the fault currents. When considering earth or ground faults (single-phase-to-ground and two-phase-to-ground faults) it has so far been considered that the network was solidly grounded, meaning that the transformer neutral point is directly connected to ground. Equations developed in the previous section are valid for solidly grounded systems but they are easily extensible to impedance grounded systems adding the triple value of the grounding impedance in the zero sequence network (Wagner and Evans, 1933). They can also be extended to ungrounded systems. For that purpose, it is worth noting that although called ungrounded, this type of system is in reality coupled to ground through the distributed capacitance of its phase conductors. Hence the
48 distributed line capacitance should appear in the positive, negative and zero sequence networks (Lakervi, 1989). Different policies for grounding the neutral of a system affect the system behaviour. In particular grounding affects the maximum levels of earth fault currents and the overvoltages. When earth fault current and overvoltages are of concern a classification of systems into grounded or ungrounded, without any further restrictions, is unsatisfactory because it takes into account only the impedance between the neutral point and the ground, instead of the total effective zero-sequence impedance which includes line and apparatus impedance as well as that of the grounding impedance. In fact, the zero-sequence impedance of a solidly-grounded system may actually be higher than that of a system grounded through a neutral impedance of low value. A more accurate classification is based on the ratios of zero and positive-sequence impedances and is known as the degree of grounding, low values of this ratio corresponding to solidly-grounded systems and high values to ungrounded systems. An effectively-grounded system will have a ratio: Xz/Xp ≤ 3 and Rz/Xp ≤ 1. The magnitude of the ground fault current as compared to three-phase fault current can also be used to determine the degree of grounding. The higher the ground fault current in relation to the three-phase fault current the greater the degree of grounding (IEEE Std 142, 1991). Effectively-grounded systems will have a line-to-ground fault current at least 60% of the three-phase fault current. In general maximum values of fault currents are obtained for low values of Xz and Xn. However this is not the case for the zerosequence resistance Rz. The effect of adding zero-sequence resistance to a system having no resistance is, first, to increase the line current in a two-phase-to-ground fault; subsequent increase in zero-sequence resistance reduces line currents as well as ground currents. 2.5.5 During Fault Voltages: a Qualitative Discussion The equations in the preceding section provide sequence and fault currents for four different faults. During-fault voltages can be derived from the sequence currents and network impedances. During-fault voltages are voltage dips and their expressions will be derived in the next chapter. Here a qualitative discussion is presented based on Figure 2.8 in which a transmission line is fed by two ideal generators. The resistive part of impedances is neglected.
49 Under a balanced condition only positive-sequence currents and voltages are present in every point of the network. Under an unbalanced load or fault there may exist the three sequence voltages and currents. On an ungrounded system (three-phase three-wire), there is no intentional path for the zero-sequence current to flow, but the distributed capacitance of lines may provide a high-impedance path for the zero-sequence current to flow. However the zerosequence current in a ungrounded system is usually neglected. The phase voltages at any point of the network can be calculated by determining its sequence-component voltages. During a fault the change in voltages at a given bus can be expressed as in (2.30). Depending on the type of fault, voltage changes of negative and zerosequence may be present. A positive-sequence voltage change will always be present. (2.30) Δv a 1 1 1 Δv z Δv b = 1 a 2
a Δv p
Δv c
a 2 Δv n
1
a
During a solid three-phase fault only positive-sequence current flows through the network. The sudden increase in the current causes a depression in the bus voltages, which are of the same sequence as the currents that cause them. Thus for a three-phase fault the depression in the rms voltage contains only a positive sequence. The voltage at the fault point becomes zero but does not change in the ideal sources until the regulators act to change the generator fields. By this time the fault should be cleared by the protective relays. Thus the voltage profile is as shown in Figure 2.8a. During a single-phase-to-ground fault, positive and negativesequence currents flow through the network and cause voltage drops that correspond to the sequence currents. A zero-sequence current flows only if there is a path for the current to flow to a ground or neutral point. The changes in the voltage at a remote bus will be of positive and negative-sequence voltage. Voltage changes of zerosequence may exist or not depending on the existence of a zerosequence path (zero-sequence transfer impedance greater than zero) from the fault point to the bus of observation. At the fault point, the voltage in the faulted phase (symmetrical phase) becomes zero and is equal to the summation of the three sequence voltages. The pre-fault voltage only contains a positive-sequence component. Hence during the fault at the observation bus the positive-sequence voltage is of opposite sign compared to the negative and zero-sequence. Figure
50 2.8b presents the voltage profile when the zero-sequence impedance is slightly larger than the positive one.
h
k j
a) 1.0pu
m
f V
p
V
0 j
h
f
b) 1.0pu 0
V j
h
c) 1.0pu 0.5pu
V z V
V f
m
k
m
k
p
V z V
n
p
V
V n V
0 d) 1.0pu
z
V =V h
p
V
k
p
n
j
n
m
f V
0.5pu
p
V j
h
0
n
p
p
z
V =V f
m
n
k
Figure 2.8: Sequence phase-a voltage profiles during faults: a) three-phase fault; b) single-phase-to-ground fault; c) phase-to-phase fault; d) twophase-to-ground fault.
The phase-to-phase fault does not provide a path for the zerosequence current to flow. The symmetrical phase voltage (healthy phase a) is equal to the addition of positive and negative-sequence voltages, which are equal at the fault point. The flow of positive and
51 negative-sequence current causes voltage-changes of the corresponding sequence. Figure 2.8c shows the sequence voltage profile for Zp = Zn. Positive, negative and zero-sequence current can flow when a twophase-to-ground fault occurs. The three sequence currents are present at the faulted point. The negative and zero-sequence voltages are equal at the fault point. Figure 2.8d shows the voltage profile. The fundamental concept illustrated in Figure 2.8 is that negative and zero-sequence voltages are maximum at the fault point and minimum at the sources. Zero-sequence voltage is zero at the generators and at the grounded neutral. Negative-sequence voltage is zero at the generators. Positive-sequence voltage is greatest at the generators and minimum at the fault point (Blackburn, 1998).
52
53
3 Magnitude and Classification of Voltage Dips In this chapter, equations for determining the voltage dip magnitude due to symmetrical and unsymmetrical faults are derived. The characteristic voltage and positive-negative factor are presented. Voltage dip classification is presented. Equations to take into account the effect of power transformers on the residual voltage are derived.
3.1 Voltage Dip Magnitude and Classification The residual voltage during the fault gives the magnitude of a voltage dip. Depending on the type of fault that causes the dip the voltage during the event may be equal or different in the three phases. According to the symmetrical-component classification (Bollen, 2003) three dip types can be recognised: A, C and D. Three-phase faults cause dips called type A. They are balanced dips meaning that the phase voltages during the fault are equal in the three phases. For this kind of dips only one complex vector is needed to characterise the magnitude and phase angle of the dip. An unsymmetrical fault may cause dips type C or D. Phasor diagrams corresponding to these dips will be presented in Section 3.3 where the magnitude of unbalanced voltage dips is derived. Dips type D are dips with the main drop in one phase. To identify the sagged phase a subscript is added, hence Da would be a dip with the main drop in phase a. Dips type C are dips with a main drop between two phases. A subscript identifies the less sagged phase. Hence Ca would be a dip with the main drop between phase b and c. Dips C and D are unbalanced dips meaning that the retained phase voltages during the fault are different in each one of the phases. Thus, it is not possible to characterise the dip with a single magnitude and the three different voltage magnitudes need to be calculated. An alternative approach has been proposed by Zhang (1999) that is based on symmetrical components and the assumption that the positive sequence impedance is equal to the negative-sequence impedance. Additionally the zero sequence voltage is treated as a separate characteristic. The method will be examined at the end of this chapter, but first the general equations for voltages during the fault will be derived for symmetrical and unsymmetrical faults. For the
54 latter ones the effect of transformer winding connections will be considered in Section 3.5.
3.2 Balanced Voltage Dip Magnitude Three-phase faults cause balanced dips, type A. Consider a network with N+1 nodes (N buses plus a reference node) and its impedance matrix Z. The reference node is named zero and is chosen to be the common generator node. According to the superposition theorem the voltage at node k during a three-phase fault at node f is given by (3.1a). (3.1a) vkf = v pref ( k ) + Δvkf The voltage during the fault is the pre-fault voltage at the observation bus plus the change in the voltage due to the fault. In (3.1a) vpref(k) is the pre-fault voltage at node k and Δvkf is the voltage-change at node k due to the fault at node f. It should be noted that we are dealing with complex variables of the type a+jb, however the bar over the variables has been omitted to simplify the notation. Equation (3.1a) can be interpreted as matrix relation (3.1b) in which case vkf is the (k,f) element of a matrix named here “dip matrix” Vdfv. The dip matrix contains all the during-fault voltages. For example row k of Vdfv contains the residual voltages at that node when faults occur at nodes 1,2,..k,..N, while the column f of Vdfv contains the residual voltage at nodes 1,2,..k,..N for a fault at node f. Vpref is the pre-fault voltage matrix and because the pre-fault voltage at node k is the same for a fault at any node, the pre-fault voltage matrix is conformed by N equal columns. ΔV is a matrix containing the changes in voltage due to faults everywhere. This matrix-based approach is useful for computational implementation of the stochastic assessment. (3.1b) Vdfv = Vpref + ΔV The voltage changes Δvkf can be calculated by means of the impedance matrix. As stated in Chapter2, the impedance matrix, Z, contains the driving-point impedances zff and the transfer impedances zkf between each bus of the system and every other bus with respect to the reference bus. During a three-phase short-circuit at node f, the current “injected” into the node f is given by (3.2), where vpref(f) is the pre-fault voltage at the faulted bus f, zff is the impedance seen looking into the network at the faulted node f, and the minus sign is due to the direction of the
55 current. Only positive sequence values are needed to perform the calculations. (3.2) − v pref ( f ) if = z ff Once the “injected” current, due to the fault at node f, is known the change in voltage at any bus k can be calculated using the transfer impedance zkf between bus k and node f. The transfer impedance is the voltage that exists on bus k, with respect to the reference, when bus f is driven by an “injection” current of unity. Then (3.3a) gives the change in voltage due to the current expressed by (3.2). The matrix version for this equation is given in (3.3b), where inv(diagZ) is the inverse of the matrix containing the diagonal elements of the impedance matrix, the asterisk (*) denotes element-element multiplication and the T over Vpref indicates transposition of the prefault voltage matrix. (3.3a) v Δvkf = − zkf ⋅ pref ( f ) z ff T (3.3b) ΔV = − Z ⋅ inv(diagZ) ∗ Vpref It should be noted that ΔV is a non-symmetric matrix, i.e. Δvkf ≠ Δvfk because zff ≠ zkk. The dips for a three-phase fault are found applying (3.1), this is adding to (3.3) the pre-fault voltage as shown in (3.4). v vkf = v pref ( k ) − zkf ⋅ pref ( f ) (3.4) z ff
Equation (3.4) can be simplified by neglecting the load, which allows taking the pre-fault voltages equal to 1 p.u. This may appear an unacceptable approximation here, but as we will use the expression for stochastic prediction of the magnitude of voltages during the fault, the approximation is allowed. On the other hand, as the pre-fault voltages are unknown (depends on load, generator scheduling, transformer tap-changers and capacitor banks) we take the expected value (1p.u.) in the calculations. Equation (3.4) shows that the voltage change at a bus k due to a threephase fault at node f is given by the quotient between the transfer impedance and the driven point impedance at the fault node. The positive-sequence impedance matrix Z is a diagonal dominant full matrix for a connected network. This means that every bus in the network is exposed to dips due to faults everywhere in the network, however the magnitude of the voltage drop depends on the transfer
56 impedance between the observation bus and the faulted point. In general the transfer impedance decreases with the distance between the faulted point and load bus. Hence load points will not seriously be affected by faults located far away in the system. The voltage change also depends on the driving impedance at the faulted bus. The driving impedance determines the weakness of the bus. The stronger the faulted bus the larger the voltage drop at another bus and vice versa. 3.2.1 Phase Angle Jump Along with the depression of the voltage magnitude, a remote fault also leads to a variation in the phase angle of the voltage. This phase angle variation is known as phase-angle jump (Bollen, 1995) and is caused by the angular difference between the impedances involved in the dip calculation. From (3.4) it can be seen that for a no-load condition, the phase-angle jump is the angular difference between the transfer impedance and the driving impedance at the fault point. In other words a phase-angle jump occurs when the quotient zkf/zff is not a real number. Equation (3.4) also shows that the angular difference between the pre-fault voltages play an important role in the phase angle jump. At transmission levels, this angular difference may be larger than the phase-angle jump due to the difference in impedances, particularly if the observation bus is heavily loaded and the fault occurs at a generation bus.
3.3 Unbalanced Voltage Dip Magnitudes Unbalanced voltage dips are caused by unsymmetrical faults requiring the use of symmetrical components for their analysis. However the same principles and approach presented in Section 3.2 can be used to determine the during-fault voltages. The superposition theorem is valid allowing the use of (3.1) both in phase and symmetrical component domain. Because of the independence of sequences in symmetrical systems, we can write (3.1) for each sequence network and determine the during-fault voltage for each of the sequence components. Before the fault, node voltages only contain a positive-sequence component, thus pre-fault voltage matrices of zero and negative sequences are zero. z (3.5a) Vdfv = 0 + ΔV z p p (3.5b) Vdfv = Vpref + ΔV p
57 n (3.5c) Vdfv = 0 + ΔV n Once the sequence during-fault voltages are determined, the phase voltages can be calculated applying the symmetrical components transformation. Thus (3.6) gives the phase voltages considering phase a as the symmetrical phase. a z p n (3.6a) Vdfv = Vdfv + Vdfv + Vdfv b z p n Vdfv = Vdfv + a 2 ⋅ Vdfv + a ⋅ Vdfv
(3.6b)
c z p n Vdfv = Vdfv + a ⋅ Vdfv + a 2 ⋅ Vdfv Inserting (3.5) into (3.6) we can write (3.7) a p Vdfv = Vpref + ΔV z + ΔV p + ΔV n
(3.6c)
b p Vdfv = a 2 ⋅ Vpref + ΔV z + a 2 ⋅ ΔV p + a ⋅ ΔV n
(3.7b)
c p Vdfv = a ⋅ Vpref + ΔV z + a ⋅ ΔV p + a 2 ⋅ ΔV n
(3.7c)
(3.7a)
Equation (3.7) gives the residual phase voltages during the fault and is valid independent of the fault type. The only missing part is the change in voltage during the fault ΔV for each sequence. The following sections derive these expressions. Equations will be derived for a general element (k,f) but matrix expressions can be derived from them. All the analysis is for phase a as the symmetrical or reference phase. 3.3.1
Voltage Changes caused by a Single-phase-to-ground Fault
A single-phase-to-ground fault causes unbalanced dips that will propagate through the system. As shown in Chapter 2, the short circuit current is found by connecting the sequence networks in series. The current flowing through the three sequence networks is the same. Thus (3.8) gives the injected current into the positive, negative and zero sequence networks. (3.8) − v apref ( f ) z p n p i = i = i if = p ; f f f z ff + z nff + z zff
To find the changes in voltage we apply the meaning of the transfer impedance in each sequence network: the sequence voltage at node k due to a unity current injected at node f is given by the sequence transfer-impedance between k and f. The sequence voltage-changes at bus k due to the phase-to-ground fault at node f are given by (3.9). (3.9a) v apref ( f ) p p Δvkf = − zkf ⋅ p z ff + z nff + z zff
58 Δv = − z ⋅ n kf
n kf
Δv = − z ⋅ z kf
z kf
(3.9b)
v apref ( f ) z ffp + z nff + z zff
(3.9c)
v apref ( f ) z ffp + z nff + z zff
The pre-fault voltage at the load point k, vpref(k), only contains a positive-sequence component and is equal to the pre-fault voltage in phase a. The during-fault sequence voltages at node k are given by (3.10). (3.10a) v apref ( f ) p a p vkf = v pref ( k ) − zkf ⋅ p z ff + z nff + z zff v = −z ⋅ n kf
n kf
v = −z ⋅ z kf
z kf
(3.10b)
v apref ( f ) z ffp + z nff + z zff
(3.10c)
v apref ( f ) z ffp + z nff + z zff
The residual phase-voltages are obtained by transforming back to phase components. (3.11a) v apref ( f ) a a z p n vkf = v pref ( k ) − ( zkf + zkf + zkf ) ⋅ p z ff + z nff + z zff v = a ⋅v b kf
2
v = a ⋅v c kf
a pref ( k )
a pref ( k )
− (z + a ⋅ z + a ⋅ z ) ⋅ z kf
2
p kf
n kf
− (z + a ⋅ z + a ⋅ z ) ⋅ z kf
p kf
2
n kf
v apref ( f )
(3.11b)
z ffp + z nff + z zff v apref ( f )
(3.11c)
z ffp + z nff + z zff
From 3.10c it is clear that phase voltages at node k will not contain a zero sequence component if the transfer impedance zzkf is zero. This is particularly true when the load and the fault point are at different sides of a transformer with delta winding or when the user’s device is connected in delta or ungrounded star. Equations 3.11 give the residual phase-voltage for a general case. If the zero sequence voltage can be neglected (or if zzkf is zero) and the positive-sequence impedance-matrix is equal to the negativesequence, (3.11) can be simplified as indicated in (3.12). (3.12a) v apref ( f ) a a p vkf = v pref ( k ) − zkf ⋅ z zff p z ff + 2
59 a (3.12b) 1 p v pref ( f ) v = a ⋅v + ⋅ zkf ⋅ z zff 2 p z ff + 2 a (3.12c) 1 p v pref ( f ) c a vkf = a ⋅ v pref ( k ) + ⋅ zkf ⋅ z zff 2 p z ff + 2 Note that (3.12) shows that the residual phase voltages at the observation point can be calculated using a balanced short circuit algorithm by adding a fault impedance equal to half of the value of the zero-sequence driving-point-impedance at the fault point. This means that a single-phase-to-ground fault is less severe than a threephase fault in terms of the depression in the voltage seen at the load bus. Due to the zero-sequence impedance, the faulted phase shows a smaller drop compared to a dip originated by three-phase fault. Figure 3.1 shows a phasor diagram of this kind of dips. The non-faulted phases show the same magnitude and direction in their voltage change. These voltage changes are half of the value of the magnitude of the voltage change in the faulted phase. The voltage change in the non-faulted phases has the same direction to the pre-fault voltage of phase a. These expressions only hold when the zero sequence voltage can be neglected and the positive-sequence impedance is equal to the negative-sequence impedance. b kf
2
a pref ( k )
v c pref
v c kf
v a kf v b pref
v a pref
v b kf
Figure 3.1: Phasor diagram of a single-phase-to-ground fault caused dip, for Zp=Zn and zzkf =0
The voltage dip shown in Figure 3.1 is a Da dip. One could conclude that a single-phase-to-ground fault involving phase a causes a Da dip,
60 however as we will see in Section 3.5, a transformer between the faulted point and the observation bus may change the character of three-phase unbalanced dips. What we can conclude is that a singlephase-to-ground fault is seen as a dip D as long as there is no transformer or phase shifting device between the observation bus and the fault point. 3.3.2 Voltage Changes caused by a Phase-to-phase Fault For a phase-to-phase fault only the positive and the negativesequence networks take part in the analysis. The zero sequencecurrent is zero and so is the zero-sequence voltage. As shown in Chapter 2, Figure 2.7c, the positive-sequence current at the fault location is equal in magnitude to the negative-sequence current, but in opposite direction. Equation (3.13) gives the injected currents in the sequence networks. (3.13) − v apref ( f ) p p n ; i = − i if = p f f z ff + z nff The change in positive- and negative-sequence voltage is given by (3.14). The zero-sequence voltage-change is zero. a (3.14a) p p v pref ( f ) Δvkf = − zkf p z ff + z nff (3.14b)
v apref ( f ) Δv = z p z ff + z nff n kf
n kf
The residual phase-voltages are obtained by adding the pre-fault voltage to (3.14a) and transforming back to phase components. (3.15a) v apref ( f ) a a n p vkf = v pref ( k ) + ( zkf − zkf ) ⋅ p z ff + z nff v = a ⋅v b kf
2
v = a⋅v c kf
a pref ( k )
a pref ( k )
v apref ( f ) + (−a ⋅ z + a ⋅ z ) ⋅ p z ff + z nff 2
p kf
n kf
v apref ( f ) + (−a ⋅ z + a ⋅ z ) ⋅ p z ff + z nff p kf
2
n kf
(3.15b) (3.15c)
If the positive-sequence impedance matrix is equal to the negativesequence impedance matrix, (3.15) takes the form indicated in (3.16). (3.16a) vkfa = v apref ( k )
61 v = a ⋅v 2
b kf
v = a⋅v c kf
a pref ( k )
a pref ( k )
(3.16b)
v apref ( f ) + j ⋅ 3 ⋅z ⋅ 2 ⋅ z ffp p kf
(3.16c)
v apref ( f ) − j ⋅ 3 ⋅z ⋅ 2 ⋅ z ffp p kf
Figure 3.2 shows the phasor diagram for a dip caused by a phase-tophase fault when the positive-sequence impedance is equal to the negative-sequence. The non-faulted phase does not see any change in the voltage. The change in the voltages of the faulted phases is equal in magnitude but opposite in direction. In the faulted phases, the voltages drop along the direction of pre-fault line-to-line voltage between the faulted phases. This kind of dip is called type C. Hence a phase-to-phase fault is seen as a dip C as long as there is no transformer or phase shifting device between the observation bus and the fault point.
v c pref v c kf v b kf
v a kf
v a pref
v b pref Figure 3.2: Phasor diagram of a phase-to-phase fault caused dip, for Zp=Zn
3.3.3
Voltage Changes caused by a Two-phase-to-ground Fault
The sequence networks need to be connected in parallel to derive the fault current in a two-phase-to-ground fault. The three sequence currents are different. Equation (3.17) gives the injected currents in each one of the sequence networks. (3.17a) − v apref ( f ) − v apref ( f ) ⋅ ( z zff + z nff ) p if =
z + p ff
z zff ⋅ z nff z zff + z nff
=
z ffp ⋅ z zff + z nff ⋅ z ffp + z zff ⋅ z nff
62 i = n f
i = z f
z zff z ffp ⋅ z zff + z nff ⋅ z ffp + z zff ⋅ z nff z nff z ffp ⋅ z zff + z nff ⋅ z ffp + z zff ⋅ z nff
(3.17b)
⋅ v apref ( f )
(3.17c)
⋅ v apref ( f )
Once the currents injected into each sequence network are known the changes in nodal voltages can be determined by means of the transfer impedances in the corresponding sequence. The only sequence voltage present before the fault is the positive-sequence voltage and is equal to the pre-fault voltage at phase a. Thus (3.18) gives the duringfault sequence voltages. (3.18a) z nff z z a vkf = zkf ⋅ v =v p kf
a pref ( k )
v =z ⋅ n kf
z ffp ⋅ z zff + z nff ⋅ z ffp + z zff ⋅ z nff
n kf
+z ⋅ p kf
⋅ v pref ( f )
− ( z zff + z nff ) z ffp ⋅ z zff + z nff ⋅ z ffp + z zff ⋅ z nff
z zff z ffp ⋅ z zff + z nff ⋅ z ffp + z zff ⋅ z nff
(3.18b)
⋅ v apref ( f )
(3.18c)
⋅ v apref ( f )
Finally the retained phase voltages are found by applying the symmetrical component transformation. (3.19a) v apref ( f ) ⋅ {( zkfn − zkfp ) ⋅ z zff + ( zkfz − zkfp ) ⋅ z nff } a a vkf = v pref ( k ) + z ffp ⋅ z zff + z nff ⋅ z ffp + z zff ⋅ z nff v = a ⋅v b kf
2
v = a⋅v c kf
a pref ( k )
a pref ( k )
+
+
{
v apref ( f ) ⋅ (a ⋅ z kfn − a 2 ⋅ z kfp ) ⋅ z zff + ( z kfz − a 2 ⋅ z kfp ) ⋅ z nff
{
z ffp ⋅ z zff + z nff ⋅ z ffp + z zff ⋅ z nff
v apref ( f ) ⋅ (a 2 ⋅ z kfn − a ⋅ z kfp ) ⋅ z zff + ( z kfz − a ⋅ z kfp ) ⋅ z nff
}
}
(3.19b) (3.19c)
z ffp ⋅ z zff + z nff ⋅ z ffp + z zff ⋅ z nff
From (3.19) it can be seen that two effects govern the change in the voltage of the non-faulted phase a: 1) the difference between the transfer impedances of positive and negative sequence, and 2) the difference between the transfer impedances of positive and zero sequence. For both effects the non-faulted phase drops when the positive-sequence impedance increases. At transmission levels the positive and negative-sequence impedances are similar and the zerosequence impedance is usually larger than the positive one, so we expect a rise in the non-faulted phase-voltage.
63
3.4 The Characteristic Voltage and Positive-Negative Factor The set of three sequence-component voltages fully determines the three-phase voltages everywhere in the network. For the symmetrical phase (phase a in our analysis) the phase-voltage is given by the addition of zero, positive and negative-sequence voltages. For the non-symmetrical phases a rotation of the negative and positive sequence components are needed before adding these components to the zero sequence. This is shown in equation (3.7). Sequence voltages are a function of the sequence impedances and their connections in the sequence networks. The three sequence networks are needed to determine the three sequence voltages. However, under the assumption of equal positive and negative sequence impedance the number of variables is reduced to two. This is what the two-component method does (Anderson, 1973). The method takes the positive sequence impedance equal to the negative one and defines two new positive sequence variables: the sum and subtraction of the positive and negative sequence voltages (and currents). By this change in variables the number of networks needed to perform the calculations is reduced from three to two, since both the sum and subtraction of positive and negative-sequences are defined as variables of the positive-sequence network. Hence a new transformation matrix is defined as indicated in (3.20). Va 1 1 0 Vz V Σ =V p +V n (3.20) b Σ −j 3 1 − V =1 2 2 V ; V Δ = V p −V n c Δ −j 3 1 − V 1 2 2 V In (3.20) VΣ and VΔ are a new set of sequence variables associated with the positive-sequence network and called sigma and delta respectively. The equality between positive and negative-sequence impedance does not mean equality between positive and negative-sequence voltages, but reduces the number of relevant variables needed to characterise the three phase voltages and thus the dip. This idea was used by Zhang (1999) to define a single characteristic to describe the magnitude of a three-phase unbalanced dip: the characteristic voltage, Vkf. The characteristic voltage and positive-negative factor, Fkf, was introduced in (Zhang, 1999) as a characterisation methodology of three-phase unbalanced dips.
64 The method is based on the assumption that the positive-sequence impedance is equal to the negative-sequence one. The zero-sequence voltage is treated as a separate characteristic and is sometimes neglected. This is particularly valid if the observation bus k and the fault point f are located at different sides of a delta or ungrounded wye winding. Under these considerations unbalanced voltage dips can, mainly, be characterised by one vector: the characteristic voltage. The additional vector, positive-negative factor, is introduced to take into account the fact that positive and negative sequence impedances might not be equal. The positive-negative factor also quantifies the effect of motor load on dips and the difference between dips due to phase-to-phase and due to two-phase-to-ground faults. For singlephase-to-ground and phase-to-phase faults the positive-negative factor is equal to the pre-fault voltage at the observation bus if the equality between positive and negative-sequence impedances applies. In order to derive equations for the new transformation one needs to analyse the fault type, its boundary conditions and apply the new transformation equation (3.20) in the same way as we did when deriving the during fault voltages. However, it is possible to get the same results by calculating sigma and delta quantities from the expressions for the positive and negative-sequence voltages and introducing the equality between positive and negative-sequence impedances. Three-phase fault A three-phase fault causes a balanced dip, type A. There is neither negative nor zero-sequence voltage. The dip is fully characterised by its phase-residual voltage, which is of positive-sequence. For this dip the characteristic voltage can be defined both as the sum, sigma, or subtraction, delta, of positive and negative-sequence voltages. Equation (3.4) shows the residual voltage that is the same for positive sequence. This is also the characteristic voltage for a balanced dip. Single-phase fault A single-phase-to-ground fault causes unbalanced dips D with residual sequence voltages as shown in (3.10). For this dip type, the characteristic voltage is defined as sigma, whereas the positivenegative factor is defined as delta. From (3.10) taking the sum and subtraction of positive and negative-sequence voltages and considering positive-sequence impedances equal to negative ones, we get (3.21):
65 Vkf = v
a pref ( k )
v apref ( f )
−z ⋅ p kf
z ffp +
Fkf = v
z
(3.21a)
z ff
2
(3.21b)
a pref ( k )
Note that the characteristic voltage Vkf is exactly the retained voltage in the faulted phase (3.12a) and the positive-negative factor Fkf is the pre-fault voltage at the observation bus k. Phase-to-phase fault This fault is fully determined by the during-fault positive- and negative-sequence voltages. The changes in sequence voltages due to a phase-to-phase fault are given in (3.14). The fault generates dips type C. For this kind of dip the characteristic voltage is defined as the residual positive-sequence voltage minus the residual negativesequence voltage, i.e. delta. The positive-negative factor is defined as sigma. (3.22a) v apref ( f ) a p Vkf = v pref ( k ) − z kf ⋅
z ffp
(3.22b)
Fkf = v apref ( k ) b −c kf
V
=v
b −c pref ( k )
−z ⋅ p kf
−c v bpref (f)
(3.22c)
z ffp
Again the positive-negative factor Fkf is the pre-fault voltage at the observation bus k. The characteristic voltage Vkf is the same as for a three-phase fault. From (3.16) it can be seen that the characteristic voltage is also equal to the magnitude of the phase-to-phase duringfault voltage between the faulted phases divided by √3. In other words (3.22a) can be read as the during-fault voltage between faulted phases, as indicated in (3.22c). Two-phase-to-ground fault For this fault the characteristic voltage is defined in the same way as for phase-to-phase fault. The difference of positive and negativesequence voltages is the characteristic voltage and the positivenegative factor is given by the sum of them. Equation (3.18) shows the residual voltage in sequence components. From (3.18) and the additional assumption that the pre-fault voltage at the load point is equal to the pre-fault voltage at the faulted bus, it can be shown that (3.23) gives the characteristic voltage and the positive-negative factor.
66 Vkf = v
a pref ( f )
Fkf = v
a pref ( f )
−z ⋅ p kf
−
(3.23a)
v apref ( f ) z
p ff
z kfp z ffp + 2 ⋅ z zff
v apref ( f )
(3.23b)
Again the resulting characteristic voltage is equal to the characteristic voltage for a three-phase fault. The positive-negative factor is less than the pre-fault voltage. It is interesting to note that for two-phaseto-ground faults in a high-impedance-grounded system the positive– negative factor is close to the pre-fault voltage. In other words, phaseto-phase and two-phase-to-ground faults result in the same dips in a high-impedance-grounded system.
3.5 Effect of Power Transformers on the Dip Type In the previous section equations for calculating the residual voltages during the fault have been developed. Four different fault types were considered: three-phase fault, single-phase-to-ground fault, two-phase fault and two-phase-to-ground fault. Those equations are general and consider the pre-fault voltages at the faulted and load bus but do not consider the effect of power transformers. Power transformers affect the phase voltages. Two effects can be identified: re-labelling of phases at the secondary of the transformer and phase shift due to winding connection. The effect introduced by re-labelling can be considered by changing the symmetrical component in the corresponding equation. The only effect here is a changing in variables. The dip does not change its type. Depending on the winding connections of the transformer the retained voltages seen at the secondary side due to an unsymmetrical fault at the primary side may be modified. This means that the dip type may change when going through the transformer. A delta or ungrounded wye winding removes the zero-sequence voltage component. This zero-sequence blocking is taken into account by modelling the zero-sequence impedance of the transformer. Positive and negative-sequences (voltages and currents) pass through the transformer, and in the sequence networks, the impedance is the same independently of the winding connections. In case of delta-wye transformers, a phase shift is introduced by the winding connections of the transformer that need to be considered to calculate the correct during fault voltages. Such a phase shift is seen in practice as a transformation between fault types. In other words a
67 phase-to-phase fault at one side of the transformer is seen as a phaseto-ground fault at the other and this effect has not been modelled yet in our equations. Delta-wye connections are discussed, as these are the most commonly used. For transformers manufactured according to the ANSI/IEEE standard (ANSI/IEEE, 1988), the low voltage side, whether in wye or delta, has a phase shift of 30o lagging with respect to the high voltage side phase-to-neutral voltage vector. These phase displacements are applicable to positive-sequence voltages. Hence in passing through the transformer from the fault side to the observation side, the positive-sequence phase voltages of the corresponding phase are shifted 30o in one direction, and the negative-sequence quantities are shifted in the other direction. These phase shifts can be incorporated into the dip equations to consider the effect of transformers. However, from the point of view of dip characterisation what is important is the complex during-fault voltage with respect to the pre-event voltage at the same bus, see (3.1a). At the observation point the pre-fault phase voltage is of positive-sequence and is the reference for the dip at that point. Hence the positive-sequence voltage does not need to be shifted, but the negative one needs to be shifted ±60o to take into account the effect of the transformer. To clarify, consider an IEEE standard power transformer between two sectors of a transmission system, as shown in Figure 3.3.
Sector I
p(HV)
V o
30 o -30
p(LV)
V
n(HV)
V
HV
LV
Sector II
Delta-wye or Wye-delta
Vn(LV) o
30 o -30
Vp(HV) p(LV)
V
Figure 3.3: A Delta-wye power transformer between two sectors of a transmission system
Sector I is the high voltage sector while sector II is the low voltage sector. According to (ANSI/IEEE, 1988) the positive-sequence phase
68 to neutral voltage at sector II has a phase shift of -30o with respect to the positive-sequence phase to neutral voltage of sector I. In terms of dips, this phase shift is seen as a ±60o phase shift in the negative sequence with respect to the positive sequence voltage of the same sector. The direction of the rotation, the sign, depends on the observation bus, the reference, and on the fault point, the origin of the event. For unbalanced dips originated at the HV sector and observed at the LV sector the rotation in the negative sequence is +60o. For unbalanced dips originated at the LV sector and observed at the HV sector a -60o shift needs to be considered in the negative sequence. The phase angle shift introduced by the transformer in the negative sequence can be written in terms of the Fortescue a-transformer operator. (3.24a) + 60 o = −a 2 o (3.24b) − 60 = −a Now consider a phase-to-phase fault involving phase b and c in the HV sector. The dip caused by this fault is seen at the HV sector as a Ca dip and it was described in Section 3.3.2. In the HV sector, there is no need for shifting the negative-sequence because the fault point and the observation bus are located at the same sector. The same fault causes a dip at the LV, but in this case a phase shift of +60o is introduced into the negative-sequence as shown in (3.25). Equation (3.25) has been derived shifting the negative sequence of equation (3.15). (3.25a) v apref ( f ) a a n p 2 vkf ( LV − HV ) = v pref ( k ) + (− a ⋅ zkf − zkf ) ⋅ p z ff + z nff b kf ( LV − HV )
= a ⋅v
c kf ( LV − HV )
= a⋅v
v v
2
a pref ( k )
a pref ( k )
+ (− a ⋅ z − a ⋅ z ) ⋅ p kf
2
n kf
3
+ (−a ⋅ z − a ⋅ z ) ⋅ p kf
4
n kf
v apref ( f )
(3.25b)
z ffp + z nff
v apref ( f )
(3.25c)
z ffp + z nff
Using basic relations of the Fortescue a-operator, (3.25) can be written as shown in (3.26). (3.26a) a ⋅ v apref ( f ) a a n 2 2 p vkf ( LV − HV ) = a ⋅ a ⋅ v pref ( k ) + (−a ⋅ zkf − a zkf ) ⋅ p z ff + z nff
69 b kf ( LV − HV )
= a⋅a⋅v
c kf ( LV − HV )
= a⋅v
v
v
a pref ( k )
a pref ( k )
+ (−a ⋅ z − a ⋅ z ) ⋅ p kf
2
+ (− z − z ) ⋅ p kf
n kf
n kf
a ⋅ v apref ( f )
(3.26b)
z ffp + z nff
a ⋅ v apref ( f )
(3.26c)
z ffp + z nff
Expressing the vpref(k) of phase c in terms of phase a, we can write (3.27). (3.27a) v cpref ( f ) a c n 2 2 p vkf ( LV − HV ) = a ⋅ v pref ( k ) − (a ⋅ zkf + a zkf ) ⋅ p z ff + z nff b kf ( LV − HV )
= a⋅v
c kf ( LV − HV )
=v
v
v
c pref ( k )
c pref ( k )
− (a ⋅ z + a ⋅ z ) ⋅ p kf
− (z + z ) ⋅ p kf
n kf
2
n kf
v cpref ( f )
v cpref ( f )
(3.27b)
z ffp + z nff
(3.27c)
z ffp + z nff
Comparing (3.27) with (3.11) we conclude that the Ca dip is seen at the other side (low voltage) of the transformer as a Dc dip the only difference being the zero-sequence component. The similarity can be made clearer taking the positive and negative-sequence impedances equal and neglecting the zero-sequence component. In this case we get (3.28) which we compare with (3.12). c (3.28a) 1 p v pref ( f ) a c 2 vkf ( LV − HV ) = a ⋅ v pref ( k ) + ⋅ zkf ⋅ 2 z ffp b kf ( LV − HV )
= a⋅v
c kf ( LV − HV )
=v
v
v
c pref ( k )
c pref ( k )
c 1 p v pref ( f ) + ⋅ zkf ⋅ 2 z ffp
−z ⋅ p kf
v cpref ( f )
(3.28b) (3.28c)
z ffp
The same phasor diagram of Figure 3.1 is applicable with phase c as the symmetrical phase. Note that the previous analysis shows that a Ca dip at the HV sector is seen as a Dc dip at the LV, but also that a Dc dip at the LV sector is seen as a Ca dip at the HV sector. A similar analysis shows that a Da dip at the LV sector is seen as a dip Cb at the HV sector. Although the previous analysis allows identifying the phases involved in the dip type, in practice the phases involved depend on the re-labelling of phases. Hence what can be concluded is that delta-wye transformers change the dip type from D to C and the other way around. This means that the total number of dips type D seen at one sector are
70 caused by single-phase faults at the same sector plus the ones caused by phase-to-phase and two-phase-to-ground faults at the other sector.
71
4 Propagation and Counting Voltage Dips in Power Systems
of
This chapter introduces the method of fault positions for stochastic assessment of dips. It also describes graphical ways to present the effect of a fault on the system and the area where faults cause severe dips on a given load: affected area and exposed respectively. A hypothetical system is used to illustrate the ideas.
4.1 Prediction and Propagation of Voltage Dips Voltage dips associated with faults have many predictable characteristics. In this work, magnitude and frequency of the dip are of main concern. It was shown in Chapter 3 that predicting the magnitude of the dips requires a model of the network and the application of short circuit techniques in order to calculate duringfault voltages at buses of the system. The rms voltage depression caused by a fault propagates through the network and is seen as a dip at remote observation buses. Predicting dip characteristics a sensitive load will see during several years of operation requires a probabilistic approach. It is impossible to predict exactly where each fault will occur, but it is reasonable to assume that many faults will occur throughout the network. Faults might occur on buses or lines leading to different dip magnitudes. Faults on lines are more frequent than faults on buses. The voltage seen at a remote bus k due to a fault at node f can be expressed by the general equation (3.1b) presented in Chapter 3. For a three-phase fault the dip-matrix is given by (4.1) where Z is the impedance matrix, Vpref is the pre-fault voltage matrix and inv(diagZ) is the matrix formed by the inverse of the diagonal elements of the impedance matrix. T (4.1a) Vdfv = Vpref − Z ⋅ inv(diagZ) ∗ Vpref If the pre-fault load can be neglected, then voltages before the fault can be considered 1 p.u. Under this assumption, (4.1a) can be written as (4.1b) where ones is a matrix full of ones and such that its dimension is equal to the dimension of Z. As explained in Chapter 3, this approximation is allowed because we use the expressions for stochastic prediction. (4.1b) Vdfv = ones − Z ⋅ inv(diagZ) ∗ ones
72 The square N by N matrix Vdfv contains the dips observed at each bus of the network caused by a fault at each one of the buses. The during fault voltage at a general bus j when a fault occurs at that bus is contained in the diagonal of Vdfv and is zero for a solid three-phase fault. Off-diagonal elements of Vdfv are the residual voltages at a general bus k caused by a fault at a general position f. Hence, column f contains the residual voltages at buses 1,2…f,…N during the fault at node f. This means that the effect, in terms of dips, of a fault at a given bus of the system is contained in columns of the dip matrix. This information can be graphically presented on the one-line diagram of the power system and it is called affected area. The following section presents this concept in details. The dip matrix can also be read by rows. A given row k identifies that bus in the system and the potential dips to which the load connected at this bus is exposed due to faults in the system. This information can also be presented in a graphical way on the one-line diagram and is called exposed area. Section 4.1.2 presents this idea. 4.1.1 Affected Area Consider the hypothetical power system of Figure 4.1 and its impedance matrix. The power system contains 19 buses plus the reference node that is chosen to be the common generator node.
Vdfv
z1, 2 ⎡ 0 1 − ⎢ z2, 2 ⎢ ⎢ z2,1 0 ⎢1 − z 1,1 ⎢ : ⎢ : ⎢ 1 − z8,1 1 − z8, 2 =⎢ z1,1 z2, 2 ⎢ : ⎢ :z ⎢1 − 11,1 1 − z11, 2 ⎢ z1,1 z2, 2 ⎢ : : ⎢ z z ⎢1 − 19,1 1 − 19, 2 z1,1 z2, 2 ⎢⎣
z1,8 z8 , 8 z .. 1 − 2,8 z8 , 8 0 :
.. 1 −
.. :
0
: z .. 1 − 11,8 z8 , 8 .. : z .. 1 − 19,8 z8 , 8
z1,11 z11,11 z .. 1 − 2,11 z11,11 : : z .. 1 − 8,11 z11,11 0 :
.. 1 −
.. ..
0
: z19,11 .. 1 − z11,11
z1,19 ⎤ z19,19 ⎥ ⎥ z2,19 ⎥ .. 1 − z19,19 ⎥ ⎥ : : ⎥ z .. 1 − 8,19 ⎥ z19,19 ⎥ (4.2) ⎥ : : ⎥ z .. 1 − 11,19 ⎥ z19,19 ⎥ 0 : ⎥ ⎥ .. 0 ⎥ ⎥⎦ .. 1 −
Applying (4.1b) we get the during fault voltages for the 19 buses due to faults at each one of the 19 buses. Equation (4.2) shows the
73 resulting dip matrix. It can be seen that column 11 of the dip matrix contains the during fault voltages at each one of the 19 buses when a three-phase fault occurs at bus 11. Column 11 of the dip matrix contains the information to identify the area of the network affected by a fault at bus 11 and is called affected area. Affected area is the region of the network where the residual voltage during a fault at a given point is less than a threshold value. 1 2
3 4
V k 11