2015 IEEE Power, Communication and Information Technology Conference (PCITC) Siksha ‘O’ Anusandhan University, Bhubaneswar, India.
Application of Dynamic Voltage Restorer in Microgrid for Voltage Sag/Swell Mitigation M.T.L.Gayatri
Dr. Alivelu M. Parimi
A.V. Pavan Kumar
Department of EEE BITS Pilani-Hyderabad Campus Hyderabad, TS, India
[email protected]
Department of EEE BITS Pilani-Hyderabad Campus Hyderabad, TS, India
[email protected]
Department of EEE BITS Pilani-Hyderabad Campus Hyderabad, TS, India
[email protected]
Abstract—Microgrids are becoming increasingly attractive to consumers as it allows utilization of freely available renewable energy sources. They are usually installed at consumer’s sites i.e the distribution end. Due to high penetration of distributed generation units with different types of loads, microgrids can cause power quality and power control issues. Some of them are voltage swells and sags, and low power factor which further require reactive power compensation. This paper presents the utilization of the custom power device specifically Dynamic Voltage Restorer (DVR) in mitigating the problem of voltage sags and swells occurring in microgrid. A microgrid is modeled and simulated with different loading conditions causing power quality problems. The performance of DVR, installed in microgrid, is analyzed for reactive power compensation to overcome these concerned issues. The control logic of DVR is designed using phase locked loop (PLL) technique and its effectiveness is observed in Matlab/Simulink. Keywords-Microgrid, Dynamic Voltage Restorer, Voltage sag, Voltage swell.
I.
INTRODUCTION
Electrical power generation in the world is dominated by combustion of fossil fuels (coal, oil and gas), nuclear and hydro power where the power is delivered over long distances to consumers. Conversely, microgrid technology is an alternative technique for requirement of the future power system. A microgrid is a small-scale power supply network mainly based on renewable energy sources combined with power electronic system is designed to provide power supply for a small community [1]. It is a portion of the lowvoltage power distribution network that is managed independently from the rest of the network [2]. The key advantages are better quality of the service, increased efficiency, and specific economic interests. The surplus power from the microgrid can be exchanged with the utility grid. The microgrid can be operated in two modes: the Grid connected mode where the microgrid exchanges power with the conventional power grid and the Islanded mode where the microgrid is operated independent of the conventional grid to serve the power requirement of a small community/island. A microgrid system shown in Fig. 1 comprises of Distributed Energy Resources (DERs) such as photovoltaic, wind and solar cell generators, immediate energy storage, loads, controller with power electronic
978-1-4799-7455-9/15/$31.00 ©2015 IEEE
converters and Point of Common Coupling (PCC) where microgrid is coupled to the power distribution system.
Fig. 1.
Microgrid Architecture
The microgrid power quality problems comprise of wide range of disturbances such as voltage sags/swells, flicker, harmonic distortion, impulse transients and interruptions [3]. Voltage sags usually occur at any instant in an event of disturbance, with amplitude ranging from 10-90% and a duration lasting for half a cycle to one minute [4]. Whereas, a voltage swell, is defined as an increase in rms voltage or current for durations from 0.5 cycles to 1 minute at the power frequency. Typical magnitudes are in between 1.1 and 1.8 rise [4-6]. Disturbances such as sudden switching of a bulky inductive load or energizing a huge capacitor banks in a typical system causes sag and swell. Voltage sag and swell can cause sensitive equipment to fail, or shutdown creating unbalanced large current that could cause in blowing fuses or tripping breakers. Such effects can be very detrimental for the customer, ranging from minor quality discrepancies to production downtime and equipment damage [7-9]. There are different methods to mitigate voltage sags and swells. Latest is the usage of FACTS devices such as TCR, SVC and STATCOM which has revolutionized the power industry. However the use of custom power device i.e. Dynamic Voltage Restorer (DVR) is considered to be the most efficient method. DVR has been studied extensively in mitigating disturbances in supply voltages such as voltage sags, swells, unbalance and harmonics in the conventional power system [10]. Its usage has also been investigated in the fault ride through, with the wind generation source connected to the grid on the occurrence of a fault in the grid [11]. Fault current limiting function of the DVR connected in conventional distribution has also been investigated in [12]. In [13], a series compensator is designed to provide fault protection at each source constituting the microgrid. To
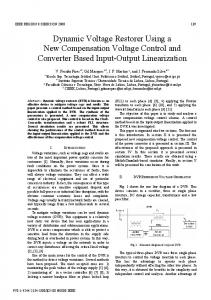
2015 IEEE Power, Communication and Information Technology Conference (PCITC) Siksha ‘O’ Anusandhan University, Bhubaneswar, India. improve power quality in microgrid advanced dynamic voltage restorer is proposed in [14] where its DVR is based on photovoltaic (PV) generation/battery units. In this paper the microgrid is modeled and incorporated with DVR, whose control logic based on dq0 transformation is designed. The microgrid is modeled as a combination of PV and Wind generation source with different loading conditions causing power quality problems. The performance of DVR, installed in microgrid, and its effectiveness is investigated in compensating voltage sag/swell in the microgrid. This paper is organized as follows. Section II provides conventional dynamic voltage restorer, Section III provides structure of microgrid and the control strategy of the DVR applied in microgrid. Section IV provides the simulation results using MATLAB/SIMULINK for different cases and proves the effectiveness of the system. CONVENTIONAL DYNAMIC VOLTAGE RESTORER
VDVR ZDVR
Zline
Iload
Load
II.
two modes of operation: standby mode and injection mode. In standby mode the injection transformer’s low voltage winding is shorted through the converter such that ( VDVR = 0). The individual converter legs are triggered such as to establish a short-circuit path for the transformer connection. No switching of semiconductors occurs in this mode of operation. Consequently low conduction losses of the semi converter only contribute to the losses in this current loop. The DVR will most of the time be idle in this mode. The DVR in injection mode ( VDVR > 0), injects a compensation voltage when there is a voltage difference through the injection transformer [15].
VSource
VDVR
Vload
DVR is a series connected device to maintain a constant RMS voltage value across a sensitive load. The DVR considered consists of a/an: Fig. 3.
a. Series injection transformer b. Harmonic filter c. Voltage Source Converter (VSC) d. Control unit Impedance Load Series injection transformer
VSource
VDVR
Control Unit
Fig. 2.
Fig. 3 indicates the equivalent circuit of the DVR. In the event when the source voltage drops or increases, the DVR injects a series voltage VDVR through the injection transformer so that the desired load voltage magnitude Vload is maintained. The series injected voltage of the DVR can be written as
VDVR = Vload − Vs
Vload
Harmonic Filter
VSC
Schematic diagram of DVR
The primary function of a DVR is preventing the effect of voltage sags/swells on sensitive loads connected to the network. Therefore as shown in the Fig. 2, the DVR is located near the sensitive loads. If a voltage disturbance occurs in the line, DVR injects a series voltage VDVR thus compensating load voltage to a reference value. The three injected phase voltages momentary amplitudes are controlled to eliminate detrimental effects of actual voltage to the load voltage VL. This ensures that any differential voltages caused by transient disturbances in the ac feeder will be compensated by an equivalent voltage injected through the injection transformer, generated by the converter. The DVR functions independently to the type of fault or any event that occurs in the system, provided that the whole system remains connected to the supply grid. The DVR has
Equivalent circuit of DVR
(1)
where Vload is the desired load voltage magnitude, VS is the source voltage during sag/swell condition. Z line is the line impedance and Z DVR is the impedance of DVR. The load current I load is given by,
⎛P ± jQload I load = ⎜⎜ load V load ⎝ III.
⎞ ⎟ ⎟ ⎠
(2)
MICROGRID STRUCTURE
A system containing a microgrid with two DERs along with a battery storage connected to a common AC reference is considered. Loads (resistive, inductive and capacitive) are delivered from the AC bus which acts as a source. The electrical parameters are mentioned in the table. A. Microgrid Modeling A microgrid containing two DERs, one as a wind generation and the other one as a PV generation, along with a storage device is considered. The block diagram of microgrid is shown in the Fig. 4 and the basic modeling of each DER is explained.
2015 IEEE Power, Communication and Information Technology Conference (PCITC) Siksha ‘O’ Anusandhan University, Bhubaneswar, India. DC BUS-BAR
WIND SPEED
WIND TURBINE WITH AC GENERATOR
SPEED (ωm )
RECTIFIER AND BOOST CONVERTER
VOLTAGE SOURCE CONVERTER (VSC)
CENTRALIZED CONTROLLER CONTROL SIGNAL TO THE CONVERTER
V&I MEASUREME NT SOLAR IRRADIANCE
BOOST CONVERTER WITH MPPT CONTROLLER
PV PANEL
CELL TEMPERATU RE
Fig. 4.
Block diagram of microgrid
i. Modeling of Photovoltaic modules in Microgrid General mathematical models of PV cell were proposed by various researchers. A two-diode model of PV cell is selected whose equivalent circuit diagram is shown in Fig. 5. The mathematical model of two-diode PV cell performance is better as compared with the numerous models of single-diode model of PV cell and also under low illumination levels, the two-diode model of PV cell exhibits better performance. The two-diode PV cell shown in Fig. 5 consists of Photo-generated current (IPH), two diodes with diode currents (ID1, ID2), shunt current ISH, Series Resistance (Rs), Shunt Resistance (Rp), output voltage (V) and PV current (I or IPV). The relation between the output current and voltage can be obtained by using Kirchhoff’s Current Law (KCL) as given by equation (3).
I pv = I PH − I D1 − I D 2 − I SH
(3)
where, ID1, ID2 are the diode currents due to diffusion and are given by (4), (5).
RS ID1
IPH
Fig. 5.
ID2
AC BUS-BAR
I= IPV
ISH RP
V
⎞ ⎤ ⎟⎟ −1⎥ ⎠ ⎦⎥
⎡ ⎛ q ×V I D 2 = I s 2 ⎢exp⎜⎜ ⎢⎣ ⎝ N 2 × k ×T
⎞ ⎤ ⎟⎟ −1⎥ ⎠ ⎥⎦
⎡ ⎛ V + Rs × I I D1 = I s1 ⎢ e ⎜⎜ ⎢⎣ ⎝ N × V t
⎞ ⎤ ⎟ − 1⎥ ⎟ ⎠ ⎥⎦
⎡ ⎛ V + Rs × I I D 2 = I s 2 ⎢e ⎜⎜ ⎣⎢ ⎝ N 2 ×Vt
⎞ ⎤ ⎟⎟ − 1⎥ ⎠ ⎦⎥
(6)
(7)
Ns × k × T is the thermal voltage of the module q with Ns being number of cells connected in series, current in the shunt resistance is given by (8): where, Vt =
I SH =
(
V + Rs × I pv
)
Rp
(8)
Substituting (6), (7), (8) in (3) we get the relation between the voltage and current of the two diode equivalent of the PV cell as (9).
Equivalent circuit of two-diode model of PV cell
⎡ ⎛ q ×V I D1 = I s1 ⎢exp⎜⎜ ⎣⎢ ⎝ N1 × k ×T
where, Is1, Is2 are the reverse saturation currents of diode D1, D2, q is the charge on electron (1.602*10-19 C), V is the cell output voltage, N1, N2 are the quality factors of diode D1, D2, k is the Boltzmann constant (1.38*10-23), and T is the junction temperature. The practical PV modules have the Rs and Rp as indicted in Fig. 5. These parameters are incorporated to build the mathematical model of PV cell to replicate the practical PV cell. This is achieved by rewriting (4), (5) as (6), (7).
(4)
⎡ ⎛ V + Rs × I I = I ph − I s ⎢ e ⎜⎜ ⎣⎢ ⎝ N × V t
⎞ ⎤ ⎟⎟ − 1⎥ − ⎠ ⎦⎥
⎡ ⎛ V + Rs × I I s 2 ⎢ e ⎜⎜ ⎣⎢ ⎝ N 2 × V t
(5)
⎞ ⎤ V + Rs × I ⎟ − 1⎥ − ⎟ Rp ⎠ ⎦⎥
(9)
Equation based implementation of the two-diode model is developed in MATLAB, Simulink in order to study the non-linear characteristics of PV Panel. The simulations are
2015 IEEE Power, Communication and Information Technology Conference (PCITC) Siksha ‘O’ Anusandhan University, Bhubaneswar, India. carried and validated using the equivalent circuit parameters that are extracted from the data sheet mentioned in [16]. ii. Modeling of Wind generator in microgrid Modeling of wind turbine and PMSG is presented in [17]. The output power of the wind turbine is given by (10)
1 3 Po = ρ AVwind C p (λ ,θ ) 2
(10)
where Po is the mechanical power output of the turbine, Cp is the power coefficient of the turbine, λ is the tip speed ratio of the rotor blades, θ is the blade pitch angle, ρ is the air density, A is the area of swept of turbine, Vwind is the wind speed .The power co-efficient of the turbine Cp (λ, θ) is given by (11) 1
⎛ ⎞ −C 6 1 C p (λ ,θ )= C1 ⎜⎜ C 2 − C 3 βθ − C 4θ x − C 5 ⎟⎟ e β β ⎝ ⎠
1
=
1
λ + 0.08θ
−
The control scheme for the proposed system is based on the comparison of reference and the actual voltages from load side. The voltage sag is detected when actual voltage drops below 90% of the reference value while voltage swell is detected when actual voltage increases more than 25%. The error signal between the actual and reference voltage is used as a modulation signal, that allows, to generate a commutation pattern for the power switches (IGBT’s) which comprise the voltage source converter (VSC). The commutation pattern is generated by means of the sinusoidal pulse width modulation technique (SPWM). Injected voltage magnitude and phase are controlled through this modulation. The PLL circuit developed as shown in Fig. 6 is used to generate a unit sinusoidal wave in phase that maintains voltage [18-20].
(11)
where the values of the coefficients C1 – C6 and x depend on turbine type, θ is defined as the angle between the plane of rotation and the blade cross section chord, and β is defined by (12)
β
illustrates the block diagram of the dq0 transformation for voltage sags/swells detection. The detection is carried out in each of the three phases.
PWM Genera tor
Inverter
_
abc/dq
Vabc,actual
+
3-Phase Discret e PLL
dq/abc
X
Sin_Cos Sin_Cos
÷
Delay
0.035 1+θ 3
abc/dq
(12)
1
Vabc,ref Sin_Cos
The equation base modeling of PMSG in MATLAB, Simulink is implemented using Eqs. (10)-(12), the parameters of the PMSG under consideration are from [17]. In the dynamic modeling and Simulink implementation of wind turbine the parameters values are R = 1.25 m, length of blade L = 2.5 m, A= 6.25 m2, ρ = 1.225 kg/m2. The simulations are carried and validated using the equivalent circuit parameters that are extracted from the data sheet mentioned in [17]. B. DVR Control Strategy The major functions of a controller in a DVR are as follows: detection of voltage sag/swell events in the system and computation of the correcting voltage. It is followed by generation of gate pulses to the sinusoidal PWM generator. Further correction of any differences in the series voltage injection and termination of the gate pulses when the event has passed. The controller may also be used to shift the DCAC inverter into rectifier mode to charge the capacitors in the DC energy link in the absence of voltage sags/swells.
The control of DVR is based on the dq0 transformation [18-20]. The dq0 method gives the depth of the sag and phase shift information with starting and ending times of the disturbance. The quantities obtained are expressed as the instantaneous space vectors. Initially convert the voltage from a-b-c reference frame to d-q-0 reference. For simplicity zero phase sequence components are ignored. Fig. 6,
Fig. 6.
Block diagram of DVR control strategy
A control system using PLL with dq0 transformation technique is used to give a scaled error between microgrid reference and actual load during sag/swell condition. Equation (13) defines the transformation from three phase system a, b, c to dq0 stationary frame. In this transformation, phase A is aligned to the d-axis that is in quadrature with the q-axis. The theta (θ) is defined by the angle between phase A to the d-axis. ⎡ ⎢ cos θ ⎡Vd ⎤ ⎢ ⎢V ⎥ = ⎢− sin θ ⎢ q⎥ ⎢ ⎢⎣V0 ⎥⎦ ⎢ ⎢ 1 ⎣⎢ 2
2π ⎞ ⎛ cos⎜θ − ⎟ 3 ⎠ ⎝ 2π ⎞ ⎛ − sin ⎜θ − ⎟ 3 ⎠ ⎝ 1 2
⎤ 1⎥ ⎥ 1 ⎥⎥ 1 ⎥⎥ 2 ⎦⎥
⎡Va ⎤ ⎢V ⎥ ⎢ b⎥ ⎢⎣Vc ⎥⎦
(13)
C. Proposed Method The proposed application of DVR to mitigate voltage sag/swell problems in microgrid is shown in Fig. 7. The sequence of operations for the control of DVR in microgrid is represented in flow chart as shown in Fig. 8.
2015 IEEE Power, Communication and Information Technology Conference (PCITC) Siksha ‘O’ Anusandhan University, Bhubaneswar, India.
Start VSource
Read data Vsource , Vload
Load
Impedance
If V source = Vload
Vload
VDVR
Yes
No Vdiff = Vsource ± Vload PLL
No injection to the line VDVR = 0
PWM Generator
Stop
VSC Vinj
Fig. 7.
Vload = Vload ± Vinj Vinj=VDVR=Vdiff
Proposed DVR in microgrid Fig. 8.
IV.
Flow chart for the control using DVR in microgrid
SIMULATION & RESULTS
A microgrid model is developed with 2 DERS, a PV generator and a wind generator along with storage to deliver an output voltage of 415V, phase to ground voltage of 340V which is at common AC bus in MATLAB Simulink. The PV generator is simulated based on Eq. (9) and the wind generator is simulated based on Eq. (10). The system parameters with constants are listed in Table. 1.
With the application of DVR the voltage sag is mitigated as shown in Fig. 11 and Fig. 12.
Table.1. System parameters and Constants System parameters Microgrid voltage PWM Generator DC capactior
Constants
415V
Fig. 10.
Double 3-arm bridge(12 Pulses) 100V
Load 1
2000W Resistive
Load 2
100 W, 1000VAR inductive
Load 3
100 W, 1500VAR capacitive
Fig. 11.
Fig. 9.
Voltage sag in microgrid
Load voltage with compensation using DVR in microgrid
Reference voltage of the microgrid
The reference voltage of the microgrid is shown in Fig. 9. The inductive load is applied during the period 0.2 -0.6 sec. due to which voltage sag is observed shown in Fig. 10.
Fig. 12.
Load voltage compensation using DVR in microgrid
2015 IEEE Power, Communication and Information Technology Conference (PCITC) Siksha ‘O’ Anusandhan University, Bhubaneswar, India. Similarly the capacitiveve load is applied during the period 0.2 -0.6 sec. due to which voltage sweell is observed shown in Fig. 13. With the application of DVR the voltage sag is mitigated as shown in Fig. 14 and Fig. 15. Thus it is observed that the DVR mitigated the voltage sag/swell in microgrid.
REFERENCES [1]
[2]
[3] [4]
[5] [6]
[7] Fig. 13.
Voltage swell in microgrid
[8]
[9]
[10]
[11]
Fig. 14.
Load voltage with compensation using DVR in microgrid
[12]
[13]
[14]
[15]
[16] Fig. 15.
Load voltage compensation using DVR in microgrid
V.
CONCLUSION
A microgrid has been modeled and developed consisting of PV and Wind generators. DVR in microgrid is modeled and simulated. A control system using PLL with dq0 transformation technique that gives a scaled error between microgrid reference and actual load voltages during sag/swell condition is applied for controlling DVR in microgrid. The simulation shows that the DVR performance is satisfactory in mitigating voltage sags/swells with quick response and excellent voltage regulation. The DVR handles the unbalanced conditions of the microgrid without any difficulties and is able to inject the voltage effectively.
[17]
[18]
[19]
[20]
T. Ackermann, G. Andersson, and L. Söder, “Distributed generation: A definition,” IEEE Transl.J. Electr.Power Syst. Res., vol. 57, pp. 195–204, 2001. R. Majumder and E. Engineering, “Modelling, Stability Analysis and Control of Microgrid,” Ph.D.Dissertation, school of energy systems, Queensland University of Technology, Queensland, Australia, February, 2010. N.G. Hingorani, “Introducing Custom Power,” IEEE Spectrum, Vol.32, pp. 4l-48, 1995. P. Boonchiam, and N. Mithulananthan, “Understanding of Dynamic Voltage Restorers through MATLAB Simulation,” Thammasat Int. J. Sc. Tech., Vol. 11, No. 3, July-Sept 2006. IEEE Std. 1159 – 1995, “Recommended Practice for Monitoring Electric Power Quality,” 1995.. J. G. Nielsen, M. Newman, H. Nielsen, and F. Blaabjerg, “Control and testing of a dynamic voltage restorer (DVR) at medium voltage level,” IEEE Trans.Power Electron., vol. 19, pp.806-813, May 2004. A. Ghosh, and G. Ledwich, “Power Quality Enhancement Using Custom Power Devices,” Kluwer Academic Publishers, 2002. S. Chen, G. Joos, L. Lopes, and W. Guo, "A nonlinear control method of dynamic voltage restorers," in 2002 IEEE 33rd Annual Power Electronics Specialists Conference, 2002, pp.88- 93. R. Buxton, "Protection from voltage dips with the dynamic voltage restorer," in IEE Half Day Colloquium on Dynamic Voltage Restorers – Replacing Those Missing Cycles, 1998, pp.3/1- 3/6. P. Kanjiya, B. Singh, A. Chandra, and K. Al-Haddad, “SRF Theory Revisited” to Control Self-Supported Dynamic Voltage Restorer (DVR) for Unbalanced and Nonlinear Loads," IEEE Transal. J. Industry Applications, vol.49, pp.2330-2340, Sept.-Oct. 2013. Kyung-Min Jin, Quach Ngoc Thinh, and Eel-Hwan Kim, "DVR control of DFIG for compensating fault ride-through based on stationary and synchronous reference frame," 7th International Power Electronics and Motion Control Conference(IPEMC), vol.2, pp.3004,3009, 2012. F. Badrkhani Ajaei, S.Farhangi, and R. Iravani, "Fault Current Interruption by the Dynamic Voltage Restorer," IEEE Transal. J. Power Delivery, vol.28, pp.903,910, April 2013. D. M. Vilathgamuwa, Poh Chiang Loh, and Yunwei Li, "Protection of Microgrids During Utility Voltage Sags," IEEE Transal. J. Industrial Electronics, vol.53, pp.1427-1436, Oct. 2006. Xiaoqing Han, Ruifen Cheng, Peng Wang, and Yanbing Jia, “ Advanced dynamic voltage restorer to improve power quality in microgrid”, IEEE power and Energy Society Meeting(IEEEPESMG), pp.1-5, 2013. Rosli Omar, Nasruddin Abd Rahim, and Marazian Sulaiman, “ Modellind and simulation for voltage sag/swell mitigation using dynamic voltage restorer (DVR)”, J. Theoritical and applied information tecchnology, pp.464-470, 2009. A. V .Pavan Kumar, Alivelu M. Parimi, and K. Uma Rao, “ Performance analysis of a two-diode model of a PV cell for PV based generation in MATLAB,” IEEE International conference on advanced communication control and computing technologies( ICACCT), pp.68-72, 2014. Pavan Kumar, A.V., Parimi, A.M., Rao, K.U., "Implementation of MPPT control using fuzzy logic in solar-wind hybrid power system," 2015, IEEE International Conference on Signal Processing, Informatics, Communication and Energy Systems (SPICES), pp.1-5, 19-21, Feb. 2015. H. Awad, J.Svensson, and M. Bollen, “Mitigation of Unbalanced Voltage Dips Using Static Series Compensator”, IEEE Transl. J. Power Elec, Vol. 19, May 2004. B. Singh, A. Adya, and J. Gupta, “Power Quality Enhancement with DSTATCOM for small Isolated Alternator feeding Distribution System,” Power Electronics and Drive System 2005 (PEDS 2005), Vol.1, pp. 274-27, 2005. C. Hochgraf, and R. Lasseter, “Stacom controls for Operation with Unbalanced Voltages “ IEEE Transl. J. Power delivery, Vol. 13, April 1998.