May 8, 2010 - Sangmin Park, Richard W. Vuduc, and Mary Jean Harrold. College ... E-mail: 1sangminp|richie|[email protected]. 245 ...... T. Anderson.
Falcon: Fault Localization in Concurrent Programs
∗
Sangmin Park, Richard W. Vuduc, and Mary Jean Harrold College of Computing Georgia Institute of Technology
E-mail: {sangminp|richie|harrold}@cc.gatech.edu
ABSTRACT
on development and testing for major software vendors. For example, a 2007 survey of concurrency usage among nearly 700 developers and testers at Microsoft revealed that concurrency is prevalent, with nearly two-thirds of respondents reporting that they have had to deal with concurrency issues [11]; and of these people, over half have had to detect, debug, and/or fix concurrency bugs1 on at least a monthly basis. Not only were these bugs reported as being among the most difficult to find, reproduce, and fix, but over 60% of these bugs took at least a few days to repair, accounting for “thousands of days of work” in aggregate. Besides productivity loss, the ultimate consequences of shipping concurrent software with defects can be devastating; the oft-cited 2003 Northeastern U.S. electricity blackout, which left 10 million people without power, has been attributed in part to a race condition in multi-million line monitoring software [27]. Testing and debugging concurrent software can be even more challenging than for sequential programs, for at least two reasons [19]. First, concurrent programs exhibit more nondeterministic behavior, which can make it difficult to even reproduce the faults. Second, concurrent faults typically involve changes in program state due to particular interleavings of multiple threads of execution, making them difficult to find and understand. These faults most frequently manifest as data races, atomicity violations, and order violations, which are consistently ranked as the most common and difficult source of concurrency faults [4, 16, 31].
Concurrency fault are difficult to find because they usually occur under specific thread interleavings. Fault-detection tools in this area find data-access patterns among thread interleavings, but they report benign patterns as well as actual faulty patterns. Traditional fault-localization techniques have been successful in identifying faults in sequential, deterministic programs, but they cannot detect faulty data-access patterns among threads. This paper presents a new dynamic fault-localization technique that can pinpoint faulty data-access patterns in multi-threaded concurrent programs. The technique monitors memory-access sequences among threads, detects data-access patterns associated with a program’s pass/fail results, and reports dataaccess patterns with suspiciousness scores. The paper also presents the description of a prototype implementation of the technique in Java, and the results of an empirical study we performed with the prototype on several Java benchmarks. The empirical study shows that the technique can effectively and efficiently localize the faults for our subjects.
Categories and Subject Descriptors D.1.3 [Programming Techniques]: Concurrent Programming—Parallel programming; D.2.5 [Software Engineering]: Testing and Debugging—Debugging aids, Diagnostics, Monitors, and Tracing
General Terms
Prior work. Numerous efforts have discovered principles and methods to pinpoint these most frequent concurrent faults. The earliest work applies static and dynamic analysis to detect data races, in which multiple threads perform unsynchronized accesses to shared data [7, 20, 22, 28, 29, 30]. However, benign data races are common and can yield high false-positive rates [16]. More recent work has instead tried to identify and detect constructs that correspond directly to faults. Such constructs include atomicity violations, in which a region of code that should execute atomically does not, and order violations, in which an unintended sequence of operations among threads occurs. Early work in this area focused on atomicity violations, relying on the developer to explicitly annotate atomic regions for subsequent static or dynamic verification by a tool [8, 10]. To relieve this annotation burden, a recent trend is to apply dynamic pattern analysis [13, 17]. The technique characterizes faults by likely interleaved sequences of operations,
Algorithms, Reliability
Keywords Concurrency, Debugging, Fault Localization, Atomicity Violation, Order Violation
1.
INTRODUCTION
The widespread deployment of parallel systems based on multicore processors [2] is already having a tangible impact ∗
Patent pending.
Permission to make digital or hard copies of all or part of this work for personal or classroom use is granted without fee provided that copies are not made or distributed for profit or commercial advantage and that copies bear this notice and the full citation on the first page. To copy otherwise, to republish, to post on servers or to redistribute to lists, requires prior specific permission and/or a fee. ICSE ’10, May 2-8 2010, Cape Town, South Africa Copyright 2010 ACM 978-1-60558-719-6/10/05 ...$10.00.
1
245
We use fault and bug interchangeably.
and then searches for these patterns in an execution. A pattern-based approach can in principle be applied to both atomicity and order violations, although existing methods have thus far considered only atomicity [16]. Furthermore, current methods may report many patterns, only some of which might directly identify the fault. These methods do not presently have any way to rank or prioritize the patterns. Many existing effective ranking techniques for fault localization are based on code coverage. Examples include prior work on Tarantula for sequential programs [14], and recent work for statement and expression (predicate) ranking for concurrent programs [18, 32]. These methods work by associating the number of occurrences of a target coverage criterion with passing and failing executions, and use these data to compute suspiciousness scores. However, thus far this approach has not been applied to concurrency patterns.
Table 1: Conflicting interleaving patterns. 1 2 3
Interleaving R1 -W2 W1 -R2 W1 -W2
Description Unexpected value is written. Unexpected value is read. The result of remote write is lost.
Table 2: Unserializable interleaving patterns.
Approach and contributions. We propose a new patternbased dynamic analysis technique for fault localization in concurrent programs that combines pattern identification with statistical rankings of suspiciousness of those patterns. We apply our technique to both atomicity and order violations. During testing, our technique detects access patterns from actual program executions, which either pass or fail. For each pattern, the technique uses the pass/fail statistics to compute a measure of suspiciousness that is used to rank all occurring patterns, in the spirit of Tarantula in the sequential case [14]. We also describe Falcon, a prototype implementation of the technique in Java, that is designed to have reasonable storage and execution time overheads, so that it may be deployed in realistic testing environments. We used Falcon to perform an empirical study on several Java benchmarks. The empirical study shows that the technique can effectively and efficiently localize the bug locations for our subjects. The technique has several advantages over existing tools. First, the technique captures not only order violations but also atomicity violations: existing tools focus only on either of the bugs. Second, the technique reports the real violation patterns with high priority, unlike other techniques that report benign and real violations without priority. Third, the technique is more efficient than previous techniques in terms of time and space. In short, our approach provides the same benefits of prior dynamic pattern analysis methods, and contributes an explicit prioritized ranking of those patterns to guide the developer toward the most likely cause of a fault. The main contributions of the paper are
1
Interleaving R1 -W2 -R1
2
W1 -W2 -R1
3
W1 -R2 -W1
4 5
R1 -W2 -W1 W1 -W2 -W1
Description Two local reads expect to get the same value. A local read expects to get the result of a local write. A temporary result between local writes (in one thread) is not supposed to be seen to other thread. The result of remote write is lost. The result of remote write is lost.
2. MOTIVATING EXAMPLE In this section, we define our target concurrency violations and present an example that we use throughout the paper. We then use this example to illustrate the limitations of existing techniques.
2.1 Concurrency Violations We begin by introducing our formal notation and then defining the key concurrency violations of interest in this paper: atomicity violations and order violations. Notation. We denote a memory access to a shared variable by bt,s , where b is the memory access type, either read (R) or write (W); t is the thread that performs the access; and s is the program statement containing s. For example, R1,S2 indicates a read access to a shared variable in statement S2 of thread 1. We can often abbreviate this notation (e.g., by R1 if the statement is understood from the context). Data race. A data race occurs when two or more threads access a shared memory location, where at least one of the accesses is a write, and there is no locking to synchronize the accesses. For example, any of the pairs R1 -W2 , W1 -R2 , W1 -W2 are, in the absence of synchronization, data races. As is well-known, a data race does not always imply a fault. For example, barriers, flag synchronization, and producerconsumer queues are common concurrency constructs that are implemented with deliberate data races [17]. Therefore, we do not focus on data race detection in this paper, though our method can include it.
• To the best of our knowledge, our approach is the first to localize malicious interleaving patterns in concurrent programs. The aim is to help the developer more quickly identify the source of a concurrency fault. • Our technique detects both atomicity and order violations. In particular, we believe our work is the first to effectively identify order violations. • We have implemented this technique in a Java-based toolset, called Falcon, which can be applied to any concurrent program with test cases. • We evaluate Falcon experimentally, and show that it is both effective and efficient in localizing concurrency faults in our subjects. We compare Falcon to the most closely related tools [13, 17, 32].
Order violation. Two sequential thread accesses to a shared memory location is a conflicting interleaving pattern if at least one of the accesses is a write, as shown in Table 1. An order violation occurs when a conflicting interleaving pattern appears that leads to unintended program behavior. The following is an example of this violation: Thread 1 1: lock (L); 2: A = new MyObject(); 3: if (A) { /* ... */ } 4: unlock (L);
246
Thread 2 1: lock (L); 2: x = A.getValue(); 3: unlock (L);
Initially x=0; y=0;
Trace (statement) 1 1-6-4-2-7-5-3
Thread1 1: if(x==0) x=1; 2: if(y==0) y=1; 3: if(x==2 and y==2) assert(false);
(b)
2 1-6-4-2-5-7-3 3 1-4-6-2-7-5-3
Thread2
4 1-4-6-2-5-7-3
4: if(x==1) x=2; 5: if(y==1) y=2;
Trace (x-access) R1,1 -W1,1 -R3,6 W3,6 -R2,4 -R1,3 R1,1 -W1,1 -R3,6 W3,6 -R2,4 -R1,3 R1,1 -W1,1 -R2,4 W2,4 -R3,6 -R1,3 R1,1 -W1,1 -R2,4 W2,4 -R3,6 -R1,3
Thread3 6: if(x==1) x=3; 7: if(y==1) y=3;
(c) (a)
Pattern Pattern Pattern Pattern Result:
for for for for
x: x: y: y:
W1 -W3 -R1 W1 -W2 -R1 W1 -W3 -R1 W1 -W2 -R1
Trace (y-access) R1,2 -W1,2 -R3,7 W3,7 -R2,5 -R1,3 R1,2 -W1,2 -R2,5 W2,5 -R3,7 -R1,3 R1,2 -W1,2 -R3,7 W3,7 -R2,5 -R1,3 R1,2 -W1,2 -R2,5 W2,5 -R3,7 -R1,3 Run1 ∗ ∗ P
Run2 ∗ ∗ P
Trace (simplified x) W1,1 -W3,6 R2,4 -R1,3 W1,1 -W3,6 R2,4 -R1,3 W1,1 -W2,4 R3,6 -R1,3 W1,1 -W2,4 R3,6 -R1,3
Run3
Run4
∗ ∗
∗
P
∗ F
Trace (simplified y) W1,2 -W3,7 R2,5 -R1,3 W1,2 -W2,5 R3,7 -R1,3 W1,2 -W3,7 R2,5 -R1,3 W1,2 -W2,5 R3,7 -R1,3 Suspciousness 0 0.5 0 0.5
Figure 1: Motivating example: (a) a three-threaded buggy program example, (b) three passing and one failing executions of the program with different level of traces, and (c) unserializable interleaving patterns associated with suspiciousness scores computed by a statistical method. and y that occur during each execution. The fifth and sixth columns show the simplified data accesses of variables x and y of the third and fourth columns. The simplification will be discussed in Section 3.1. Columns 3 through 6 use the notation of Section 2.1. Figure 1(c) shows the ranking of identified unserializable interleaving patterns. The second to the fifth rows show all four unserializable interleaving patterns identified from the four executions. In this example, we consider only unserializable interleaving patterns (as opposed to conflicting interleaving patterns) because the program has atomicity violations that consists of two unserializable interleaving patterns. The second to the fifth columns show the four runs from Figure 1(b). If a pattern appears in a run, the overlapped cell is marked with *. For example, W1 -W3 -R1 pattern for x appears in runs 1 and 2. The sixth row shows the passing/failing result of each run; runs 1–3 are passing and run 4 is failing. The sixth column shows the suspiciousness scores for the four patterns. The suspiciousness scores of W1 -W2 -R1 patterns for x and y are 0.5, and suspiciousness scores for other two patterns are 0. Existing atomicity violation detectors fail to precisely identify the patterns that cause the fault. Most detectors will find all or some of the four distinct unserializable interleaving patterns shown in the first column of the table in Figure 1(b) after four executions [8, 13]. AVIO reports patterns that appear only in failing executions [17]; it fails to report any pattern in our example because all four patterns appear in at least one passing execution. Only Falcon reports the two W1 -W2 -R1 patterns for x and y, with the highest suspiciousness scores. We discuss the technique in detail in Section 3.
The correct order of the execution is executing the code in Thread 1 and then Thread 2. However, variable x gets an unexpected value when the code in Thread 2 is executed before Thread 1. Here, R2,S2 -W1,S2 is an order violation. Note that the example is synchronized by a lock L, so it is neither a data race nor an atomicity violation (see below). Atomicity violation. An atomic method or a code block is a sequence of statements whose execution is not interrupted by the execution of statements in different threads. Atomicity is often referred to as serializability, and is satisfied if the resulting state of data in a concurrent execution is the same as that of a serialized execution. In Table 2, we show unserializable interleaving patterns. For example, R1 -W2 R1 is an unserializable interleaving pattern where Thread 1 first reads a shared-memory variable, then another thread, Thread 2, writes to the shared-memory variable, and finally Thread 1 reads the shared-memory variable. The pattern is unserializable because a serial execution R1 -R1 -W2 has a different value for the second read access. An atomicity violation occurs when an unserializable interleaving pattern leads to unintended program behavior. Note that, as with order violations, an atomicity violation can occur without a data race [16, 25]. We give an example of an atomicity violation in the following section.
2.2 A Running Example As our example, we use the three-threaded program shown in Figure 1(a). The program has shared variables x and y, which are initialized to 0. Thread 1 sets the values of x and y to 1 if their values are 0, and checks whether the values of both x and y are 2. If the values of x and y are 2, the program fails with an assertion violation. Thread 2 and Thread 3 set the values of x and y to 2 and 3, respectively, if the values of x and y are 1. To raise the assertion violation, two conditions for x and y must be satisfied: for x, statements 1 and 4 consecutively executed without intervention of statement 6; for y, statements 2 and 5 consecutively executed without intervention of statement 7. Figure 1(b) shows the results of four executions. The first column numbers each execution. The second column shows statement traces for the four executions. The third and fourth columns show the data accesses for variable x
3. OUR TECHNIQUE Our technique for identifying concurrency bugs in Java threads consists of two main steps. In Step 1, our technique monitors shared-memory accesses online, detecting and recording patterns of such accesses that correspond to unserializable and conflicting interleaving patterns.2 Step 1 associates these patterns with test cases and pass/fail results 2 Recall that these two classes of patterns are associated with atomicity violations and order violations, respectively.
247
Input : m: shared memory location b: memory access type t: thread ID s: memory access location P t: current set of patterns (initially null) Output: P t: updated set of patterns
(a): x access: R1,1 -W1,1 -R3,6 -W3,6 -R2,4 -R1,3
(b): y access: R1,2 -W1,2 -R2,5 -W2,5 -R3,7 -R1,3 Figure 2: Memory access and sliding windows—(a) and (b) are shown in the trace of the second execution (third row) in Figure 1 (b).
of the executions. In Step 2, our technique applies statistical analysis to the results of Step 1 to compute a suspiciousness value for each detected pattern, as described in Section 3.2. Using these suspiciousness values, Step 2 ranks the patterns from most to least suspicious, and presents this ordered list to the user. The remainder of this section describes these steps in detail.
1 2 3 4 5 6 7 8 9 10 11 12 13 14 15 16 17 18
if m does not yet have any window then w=createWindow (); w.insert(b,t,s); registerWindow (w,m); else w=getWindow (m); (b2,t2,s2)=w.getLastAccess(); if t=t2 then w.update(b,s); else if w is full then P t+=getPatterns (w); w=slideWindow (w); end w.insert(b,t,s); end end return P t;
Algorithm 1: GatherPatterns.
3.1 Step 1: Online Pattern Identification Step 1 of the technique identifies unserializable and conflicting interleaving patterns (described in Section 2.1) during the program’s execution. Like other fault-localization techniques, our technique records program entities and subsequently associates them with passing and failing runs. However, our technique differs from prior fault-localization work in two ways. First, instead of running the program with many test cases, our technique runs the program many times (i.e., k times) with the same test case. The program is non-deterministic; thus, different and possibly faulty interleavings of access to shared variables can occur in different executions of the same test cases. (We also apply random delays (or irritators) to increase the likelihood of different interleavings [5, 34].) Second, instead of gathering coverage of simple entities, such as statements, branches, or predicates, our technique tracks patterns (i.e., sequences of shared variable references). An instrumented version of the program, which we call P � , executes each test case k times. During these executions, our technique uses a fixed-sized sliding-window mechanism to identify patterns. For each execution, our technique associates patterns with program-execution behavior: passing (i.e., the program behaved as expected) or failing (i.e., the program exhibited unexpected behavior). After all k executions, the set of suspicious patterns and the number of passing and failing executions associated with each pattern is passed to Step 2 of the algorithm.
execution of our running example in Figure 1(b). We show the two reference streams for the two shared variables, x and y. We represent a reference to a shared variable with a circle, labeled by bt,s (see Section 2.1). The window size is the maximum number of references tracked for each shared variable. When any thread references the variable, our technique updates its associated window. Initially, the window is empty so our technique always records the first reference. If a new reference occurs in a different thread from the previously recorded reference—a thread-remote access—our technique records the new reference in the next slot. Otherwise, the threads are the same—a thread-local access—and our technique replaces the previous reference. One exception to this replacement is when the new reference is a read and the last reference was a write, in which case we keep the write. That is, we heuristically prefer writes, largely because we know that both order and atomicity violations require at least one write. For example, Figure 2(a) shows the x references and their sliding window for the second execution in Figure 1(b). The complete accesses are shown in the third column and the simplified accesses used in the sliding window are shown in the fifth column of Figure 1(b). Consider the first two consecutive accesses R1,1 -W1,1 from Thread 1. When Thread 1 performs R1,1 , our technique records it because it is the first x reference of Thread 1. Our technique then observes W1,1 with no interleaved access from another thread, and it overwrites the R1,1 slot with W1,1 . When the window becomes full, our technique evicts the oldest reference. In Figure 2(a), the window of size 3 becomes full once R2,4 occurs; the subsequent R1,3 causes the window to “slide,” thereby evicting W1,1 . This scheme is approximate in the sense that it may prematurely evict references that are part of some pattern, owing to the limited capacity of the window. Tuning the window size allows our technique to trade accuracy for time and storage overhead.
Windowing scheme and update policy. As P � executes with a test case, it maintains a set of fixed-size windows that store memory-access information. There is one window for each shared-memory location. When tracking patterns, using a fixed-size data structure for each memory location reduces the time and storage overheads compared to recording all shared-memory accesses. For example, in Figure 1(b), the trace (column 3) is tracked by two windows—one for variable x and the other for variable y. With fixed-size windows, the storage overhead grows with the number of shared variables rather than the number of memory accesses. We illustrate how our scheme maintains the window using the example in Figure 2, which corresponds to the second
248
O(n2 ) in the worst possible case, since the O(n) bound applies to just a single thread. We investigate the relationship between window size and number of threads empirically in Section 4.3.
The online pattern gathering algorithm. Our overall pattern-collection algorithm, shown in Algorithm 1, is invoked whenever there is a new reference (b, t, s) to sharedmemory location m, and that also includes the window update policy described above. Because this algorithm is gathering patterns online, it assumes there is some current set of patterns, P t, and updates this set. The algorithm first checks whether a window exists for m (line 1). If not, it creates one (lines 2–4). Otherwise, it retrieves the window w from a global table, extracts the last access (lines 6–7), and updates the window (lines 8–17) using the window-update policy described previously. If, during the window update, the algorithm discovers that the window is full (line 11), then it scans the window for patterns (lines 12), and finally slides the window (line 13). When extracting patterns, the algorithm checks the window for all of the unserializable interleaving patterns in Table 2, where the first access in the pattern indicates the oldest slot. If there is no unserializable interleaving pattern, the algorithm checks the window for conflicting interleaving patterns in Table 1. That is, the algorithm does not doubly count a pair (conflicting interleaving pattern) that is already detected as a triplet (unserializable interleaving pattern). To see how pattern extraction works, recall execution trace 2 of Figure 1(b). This trace contains two reference streams: one each for variables x and y as shown in Figures 2(a) and 2(b), respectively. In Figure 2(a), recall that the window becomes full at the fifth reference, R2,4 . At the sixth reference, R1,3 , lines 12–13 of Algorithm 1 are executed as follows. In the window, there are no unserializable interleaving patterns because the first and third slots of the window (W1,2 and R3,7 circles) do not have matching thread IDs. However, there is a conflicting interleaving pattern, W1 -W3 , where the first element is the oldest slot. Thus, the algorithm slides the window, adds the R1,3 reference, and emits a pattern. Figure 2(b) shows this same process repeated for the shared variable y. Importantly, observe that a window size of 4 is required to detect the unserializable interleaving pattern in this case. The thread of the oldest slot matches the thread of the fourth slot, so in the window, the algorithm can detect the W1 -W2 -R1 pattern with the first, second, and fourth slots. It is in this sense that windowing may not capture all patterns, and so tuning the window size is a critical engineering consideration. Theoretically, if we want to guarantee that our technique does not miss any patterns, we can argue bounds on the necessary window size as follows. A trivial lower bound on the window size for detecting the unserializable interleaving patterns is the maximum length of any pattern. For the patterns in this study (Table 2), the longest pattern has 3 references, so a lower bound on window size for our patterns is 3. However, the upper bound should also be proportional to the number of threads (without any compression). To see this bound, suppose we wish only to gather patterns of the form Ri -Wj -Ri , and that there are n threads of execution. Consider an actual execution with the reference stream, R1 W2 -W3 -· · · -Wn -R1 . Clearly, we need at least O(n) slots to capture all n − 1 patterns of the form R1 -Wj -R1 . Thus, we might expect that as n increases, we need to increase the window size accordingly. Moreover, we might expect that this window size might need to grow by as much as
3.2 Step 2: Pattern Suspiciousness Ranking Step 2 of the technique uses the results of Step 1—the gathered patterns and their association with passing and failing executions—and computes a suspiciousness score using statistical analysis. Basic approach: Suspiciousness scores for patterns. There is a body of research on statistical analysis for fault localization for sequential or deterministic programs [1, 14, 15]. These approaches assume that entities (e.g., statements, branches, and predicates) executed more often by failing executions than passing executions are more suspect. Thus, they associate each entity with a suspiciousness score that reflects this hypothesis. For example, Tarantula uses the following formula, where s is a statement, %passed(s) is the percentage of the passing test executions that execute s, and %f ailed(s) is the percentage of the failing test executions that execute s [14]: suspiciousnessT (s) =
%failed(s) %failed(s) + %passed(s)
(1)
For concurrent programs, we can apply the same methodology, including the Tarantula formula, to score patterns. This approach works in a reasonable way most of the time, but sometimes produces unexpected suspiciousness values. The problem arises from the non-determinism inherent in concurrent programs. It is possible that a pattern occurs in only one failing execution and no passing executions, but is not related to the real fault in the program. In this case, the Tarantula formula (1) gives this pattern a suspiciousness value of 1—the highest suspiciousness value. To account for this case, the formula should assign a higher score to patterns that appear more frequently in failing cases. Our scoring approach: Jaccard Index. The Jaccard index addresses this weighting issue by comparing the similarity of the passing and failing sets [1]. We use this measure in our technique. For a pattern s, where passed(s) is the number of passing executions in which we observe s, f ailed(s) is the number of failing executions, and totalf ailed is the number of total failures, we use the following score: suspiciousnessJ (s) =
failed(s) totalfailed + passed(s)
(2)
Again, consider the example in Figure 1. There are three passing and one failing executions in Figure 1(b), making totalf ailed = 1. The suspiciousness scores for the four patterns computed by (2) are presented in Figure 1(c). The two W1 -W2 -R1 patterns for x and y are ranked highly. Indeed, they are the main causes of the bug in this example.
4. EMPIRICAL STUDY We implemented a prototype of our fault-localization technique in a tool, called Falcon. In this section, we empirically evaluate Falcon, including comparisons to existing approaches, on a suite of faulty multithreaded Java programs. In particular, we conducted four evaluation studies, whose key findings are summarized as follows.
249
Table 3: This table describes the subject, lines of code, failure rate, and violation type.
1. We study how the window size needed to find a faulty pattern varies as a function of the number of threads (Section 4.3). We find that a constant window size, rather than one linear or quadratic in the number of threads, works well. Thus, windowing is space-efficient and does not miss critical patterns in practice. 2. We assess the effectiveness of our ranking algorithm (Section 4.4). On our benchmark suite, we find that the patterns directly corresponding to a fault always rank at or near the top of the observed patterns. This result implies that a programmer can quickly hone in on the source of a fault. 3. We measure the run-time overheads of our approach, showing a median slowdown of 2.6× across our benchmarks (Section 4.5). Thus, it is feasible to incorporate Falcon into realistic testing environments. 4. We compare to the most closely related approach— Cooperative Crug Isolation (CCI) (Section 4.6). CCI gathers predicate entities rather than patterns, so it only ranks individual accesses. Moreover, in CCI’s rankings, the accesses involved in a faulty pattern often do not end up at the top.
Program
Contest Benchmarks
Java Collection
Miscellaneous
We implemented Falcon in Java. Not counting other software that it uses, Falcon consists of 7224 lines of code. The first main component of Falcon is its instrumentation and monitoring capabilities. For the instrumentation component of Falcon, we used the Soot Analysis Framework,3 which analyzes programs in Java bytecode format. Falcon performs a static thread-escape analysis [12] to determine which variables might be shared among multiple threads, and instruments the program to observe and record shared accesses at runtime. Falcon also instruments methods, to provide detailed stack-trace information in subsequent bug analysis. Moreover, Falcon provides an option to inject artificial-delays that can increase the number of interleavings that occur, thereby increasing the chance of eliciting concurrency bugs [5, 34]. We use this option in our experiments. The Falcon dynamic monitor executes in a separate thread as the instrumented program executes. This monitor dynamically receives memory-access information generated from multiple threads in a non-blocking concurrent queue, which maintains memory accesses in a sequential order. The accesses are obtained from this queue to construct windows for extracting patterns (Section 3.1). The second main component of Falcon computes suspiciousness values for each pattern (Section 3.2), and reports the list of ranked suspicious patterns in a text format. Within the Falcon toolset, each suspicious pattern can be represented in dotty4 graphical format.
4.2 Empirical Setup Table 3 describes the set of subject programs we used in our study. The first and second columns list the subject programs, classified into three categories: Contest benchmarks, Java Collection Library, and Miscellaneous (Misc) programs. The third column shows the size of the subject program in lines of code. The fourth column displays the empirically 4
Failure Rate 3% 54% 69% 14% 43% 84% 2% 2% 3% 3% 3% 2% 3% 1% 0% 14% 0%
Violation Type Atomicity Atomicity Atomicity Atomicity Atomicity Atomicity Atomicity Atomicity Atomicity Atomicity Atomicity Atomicity Order Atomicity Atomicity Atomicity Atomicity
observed failure rate, to give a rough sense of the difficulty of eliciting a fault. The fifth column classifies concurrency violation type for the known bug as either an atomicity or an order violation. The Contest benchmark suite is a set of small programs (fewer than 1KLOC) created by students as a homework assignment in a class on concurrency [6]. The programs contain various kinds of concurrency bugs, such as data races, atomicity violations, and deadlock. We selected the subset known to have atomicity violations [13]. Although these programs are small, we include them because they have been used in other studies of concurrency bugs [13]. Each program comes with a test harness that determines whether an execution passed or failed. The Java collection library classes, from JDK 1.4.2., include ArrayList, LinkedHashSet, StringBuffer, TreeSet, and Vector. These classes have atomicity violations that can result in a program crash or memory corruption [13, 25, 35]. We wrote multi-threaded test cases that can yield buggy interleavings. The test cases create two or more objects of the collection, pass the objects to multiple threads, and concurrently call methods of the objects. If any child thread halts, the main thread catches an exception and memory corruption to determine whether the program passes or fails. The set of Miscellaneous programs contains additional programs: Cache4j, a simple and fast cache implementation for Java objects; Hedc, a Web crawler application developed at ETH [33]; Philo, a dining philosophers’ problem solver; RayTracer, a benchmark program from Java Grande Forum5 ; and Tsp, a Traveling Salesman Problem solver [33]. Every program has concurrency violations: Cache4j has an order violation [30] and the other programs have atomicity violations [3, 35, 36]. Philo and Tsp actually never failed, even though we executed the programs for six hours; though conflict interleaving and unserializable interleaving patterns are present, they appear to be benign. We ran our experiments on a desktop computer with a 2.66 GHz Intel Core 2 Duo processor and 4GB RAM, using Windows Vista and Sun’s Java 1.5.
4.1 Implementation
3
Account AirlinesTickets BubbleSort2 BufWriter Lottery MergeSort Shop ArrayList HashSet StringBuffer TreeSet Vector Cache4j Hedc Philo RayTracer Tsp
Lines of Code 155 95 130 255 359 375 273 5866 7086 1320 7532 709 3897 29947 110 1924 720
http://www.sable.mcgill.ca/soot/ http://www.graphviz.org/
5
250
http://www.javagrande.org/
���
4.4 Study 2: Effectiveness
���
The goal of this study is to investigate how well our technique ranks patterns by determining whether highly ranked patterns correspond to true bugs. To do this, we used the Falcon prototype with artificial delays and window size 5 to get the ranked patterns. We used the benchmark programs with their default number of threads, and executed each program k=100 times. Columns 2–6 in Table 4 summarize the results of this study for the programs listed in the first column. Column 2 reports the highest observed suspiciousness value; column 3 reports the number of patterns identified; column 4 reports the number of patterns appearing in at least one failing execution; and column 5 reports the number of patterns appearing only in failing executions. We only report either the number of conflicting interleaving patterns or the number of unserializable interleaving patterns, according to the program’s violation type (see Table 3). For instance, in Cache4j, the number of patterns indicates the number of conflicting interleaving patterns since it contains an order violation; in the other programs, the number of patterns indicates the number of unserializable interleaving patterns. Column 6 shows the highest rank of the first pattern found by Falcon that corresponds to a true violation. For example, the Account program has 11 patterns typical of atomicity violations, among which 10 patterns appeared in at least one failing execution, seven patterns appeared only in failing executions, and the highest rank assigned by Falcon to any pattern corresponding to a true bug was 2. We observe that Falcon is effective for our subjects because it identifies a true bug as either its first or its second ranked pattern. This result implies that a programmer need only look at the first or second pattern reported by Falcon to find an actual bug. By contrast, other atomicity violation detectors that do not rank and report more patterns, implying potentially more programmer effort to examine the report. Several of these approaches [8, 13] will report the number of patterns shown in Column 3, without additional filtering. The AVIO technique [17] would reduce these patterns, instead reporting the number of patterns shown in Column 5. However, this number of patterns still implies more programmer’s effort than with Falcon. Falcon also works effectively even if the program has multiple concurrency bugs, which is the case with the Contest benchmarks. For the Contest benchmarks, Falcon reports different patterns as the most suspicious pattern from different experiments, but the most suspicious pattern was always a real bug. There are three special cases in our data. Philo and Tsp did not fail at all during our many runs of the programs, and thus, we cannot report any suspicious patterns for them. (That is, we detect all patterns but all suspiciousness scores will be 0 if there are no failing cases.) Hedc is the only case in which we cannot pinpoint the real bug, because the bug is hidden in the library code. The bug is triggered when a shared object concurrently calls a library method from multiple threads. Because the bug location is in uninstrumented library code, bug detection tools including Falcon cannot pinpoint the bug location. We are planning to address the problem by adding probes before and after library method calls and monitoring the method call interruption.
������� � ��
��� ��� ��� ��� ��� ��� ��� �� �� ��
��
� �
���
��
� ������������
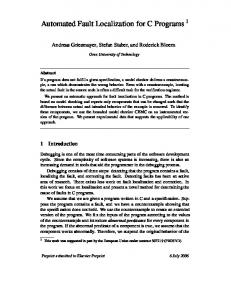
Figure 3: Results of Study 1: Relationship between window size and number of threads.
4.3 Study 1: Window Size The goal of this study is to investigate the relationship between the number of threads and the window size required to capture the target unserializable interleaving patterns shown in Table 2. To do so, we computed a histogram of the window size for each pattern detected. For example, for the pattern, R1 -W2 -R1 , within the reference stream, R1 -R3 W2 -R3 -R1 , we would increment the frequency for minimum window size 5 in the histogram. We built this histogram for each number of threads p, where p ∈ {4, 8, 16, 32, 64}. We set the window size to 50 for this experiment, so we compute a histogram of the window size for patterns detected within 50 reference streams. We executed the benchmark programs k=100 times for each p with artificial delays, and aggregate the data over all benchmarks. Figure 3 shows the results as a boxplot.6 The horizontal axis is the number of threads, ranging from 4 to 64, and the vertical axis shows the observed distribution of window sizes. For example, for p = 8 threads, Figure 3 shows that the window sizes ranged from 3 to 38, with 75% of the window sizes no more than 6 (top of the 3rd quartile, which is the top of the solid box). Interestingly, we observe in Figure 3 that the minimum and median window sizes are constant and always coincide at the value 3, independent of the number of threads. This median value indicates that a window size of 3 was sufficient half the time. Moreover, the 3rd quartile is always at most 9, meaning that 75% of the time, a window size of at most 9 is sufficient to capture the target patterns. Thus, we may conclude that even though the worst case window size should grow linearly with the number of threads, as discussed in Section 3.1, in practice it does not. In particular, there is 50% chance that we will catch the patterns of interest even with the minimum window size of 3, and with a window of no more than 10 we will capture them roughly 75% of the time. Thus, we can expect only a modest increase in the number of test runs required to accurately rank these patterns with a small window size. Moreover, a small window size implies that monitoring the patterns should incur relatively small storage overhead. 6 A boxplot consists of five numbers: the smallest observation, the lower quartile, the median, the upper quartile, and the largest observation. The lower quartile, median, and upper quartile consist of the box, and the minimum and maximum observations are linked to the box by lines.
251
Table 4: Results of Study 2 (effectiveness) and Study 3 (efficiency). Program
Account AirlinesTickets BubbleSort2 BufWriter Lottery MergeSort Shop ArrayList HashSet StringBuffer TreeSet Vector Cache4j Hedc Philo RayTracer Tsp
Highest suspiciousness score
0.8 0.33 1 0.33 0.1 0.9 0.16 1 1 1 1 1 0.51 0.01 0 1 0
Study 2 (Effectiveness) Number of Number of Number of patterns patterns patterns apidentified appearing pearing only in at least in failure one failure 11 10 7 4 1 0 4 4 1 105 71 25 4 4 4 76 63 42 10 2 0 1 1 1 7 3 3 2 1 1 9 5 3 1 1 1 23 12 2 2 2 0 9 0 0 14 14 14 24 0 0
4.5 Study 3: Efficiency
Ranking of bug by Falcon
Slowdown
2 1 1 1 1 1 2 1 1 1 2 1 1 0 0(*) 2 0(*)
Study 3 (Efficiency) Number of Number of accesses memory locations
2 1.1 1 6.6 4.9 2.6 3.8 8.3 1.4 8.2 1.4 3.2 1.4 1 2.5 58.1 61.4
79 44 136270 20830 94 70 298 162 202 25 651 132 210835 7556 87 147724 451264
12 3 402 1007 14 23 34 49 68 11 129 44 8059 706 7 1142 15059
For this study, we implemented the CCI technique in the Falcon toolset (based on our understanding of CCI) and executed it for our benchmarks. The CCI toolset is similar to Falcon in that both collect dynamic information from concurrent programs and report lists of entities with suspiciousness scores. However, CCI differs in that it collects shared variable accesses (predicates) and Falcon collects patterns. CCI designs predicates to check whether a previous access is thread-local or thread-remote. Using the predicates with pass/fail results, CCI computes suspiciousness scores using statistical analysis [15] to report suspicious predicates (i.e., suspicious memory access locations). Table 5 compares what the two techniques report, for the benchmarks listed in Column 1. Column 2 shows the most suspicious bug pattern that Falcon reports. The notation is “Bug:Rank”, where Bug represents the pattern of the true bug and Rank is Falcon’s rank of that pattern. Columns 3–5 show CCI’s ranking of the same accesses identified by Falcon. For CCI, the notation is “Access:Rank”. For example, for Account Falcon reports a real bug as an R-W-R pattern with rank 2; CCI’s ranking of the individual accesses from this pattern are 6th, 4th, and 6th, respectively. We make two observations from this study. First, the results show that CCI tends to rank individual accesses of a real bug much lower than Falcon ranks its patterns. This observation suggests that Falcon may more effectively pinpoint the real bug. Second, CCI gives less context for understanding the actual currency bug than Falcon. That is, order and atomicity violations involve multiple accesses, which means a programmer using CCI must be able to manually construct the right pattern, whereas Falcon reports it directly.
The goal of this study is to investigate the efficiency of the Falcon toolset by analyzing the slowdown caused by instrumentation and dynamic analysis. For this study, we implemented two counters to collect the number of shared memory accesses and shared memory locations. We computed the slowdown factor by comparing normal program execution and Falcon-instrumented program execution. Columns 7–9 in Table 4 summarize the results, showing the slowdown factor, the number of shared memory accesses, and the number of shared memory locations, respectively. For example, when executed with the Falcon toolset, Account experiences 2× slowdown over execution without any instrumentation. Account has 12 shared memory locations, which are accessed 79 times during program execution. In terms of slowdown, Falcon matches or slightly improves on prior work. The average slowdown of Falcon is 9.9×, whereas AVIO reports 25× [17], while other atomicity violation detectors report 14× [13] and 10.3× [9]. Given improvements in machines over time, we consider these slowdowns to be comparable. In fact, Falcon may have less overhead because its sliding window data structure should result in less memory usage; by contrast, Hammer, et al. [13] construct data structures that are proportional to the number of shared memory accesses. RayTracer and Tsp show much greater slowdown than the other programs, where other techniques also experience exceptionally huge slowdown for the same programs [9, 35, 36]. We believe that a large number of small method calls makes the instrumentation effect worse than other programs.
4.6 Study 4: Comparison to CCI One of the most closely related studies of fault localization in concurrent programs with a ranking scheme is CCI [32].7 Thus, the goal of this study is to compare the effectiveness of Falcon to CCI [32].
5. RELATED WORK There is a large and growing body of work on fault analysis and detection for concurrent programs. In this section, we discuss the most relevant work to our own and contrast existing methods to the Falcon approach.
7
Bugaboo [18] is a study applying statistical ranking to concurrent programs. Because the paper was published after the submission of this paper, we do not empirically compare to Bugaboo.
252
Table 5: Results of Study 4 (comparison to CCI). Program Account AirlinesTickets BubbleSor2 BufWriter Lottery MergeSort Shop ArrayList HashSet StringBuffer TreeSet Vector Cache4j Hedc Philo RayTracer Tsp
Falcon Bug:Rank R1 -W2 -R1 :2 R1 -W2 -R1 :1 W1 -R2 -W1 :1 R1 -W2 -R1 :1 R1 -W2 -R1 :1 W1 -R2 -W1 :1 R1 -W2 -R1 :2 R1 -W2 -R1 :1 R1 -W2 -R1 :1 R1 -W2 -R1 :1 R1 -W2 -R1 :2 R1 -W2 -R1 :1 W1 -R2 :1 R1 -W2 -W1 :2 -
Hammer et al. [13] develop the notion of atomic-set-serializability, an extension of conflict-serializability [35], which can capture atomicity violations with more precision by considering atomic regions. Their tool records data access sequences at runtime. As with AVIO, Falcon improves on the Hammer, et al., technique by ranking patterns. Moreover, Falcon reduces space-time requirements, as discussed in Section 4.5.
CCI A1:Rank A2:Rank A3:Rank R1 :6 W2 :4 R1 :6 R1 :2 W2 :5 R1 :4 W1 :1 R2 :7 W1 :2 R1 :5 W2 :1 R1 :5 R1 :1 W2 :7 R1 :4 W1 :1 R2 :3 W1 :12 R1 :15 W2 :12 R1 :15 R1 :4 W2 :4 R1 :4 R1 :15 W2 :15 R1 :1 R1 :14 W2 :2 R1 :1 R1 :10 W2 :5 R1 :10 R1 :2 W2 :2 R1 :2 W1 :79 R2 :2 R1 :4 W2 :4 W1 :3 -
Bug eliciting techniques for concurrent programs. A drawback of any testing-based approach is that program failures may occur infrequently (if at all). Introducing random delays using irritators can increase the likelihood of a buggy interleaving [5, 34]. More focused (non-random) schemes exist as well. These include schemes that control the scheduler to elicit specific interleavings [30]; run-time monitoring and control of synchronization [25]; and analysis-based methods [26]. Musuvathi et al. published several papers [20, 21] for CHESS model checker, which reduces the interleaving space by bounding the number of preempting context switches. The technique is based on a theorem that limiting context switches only at synchronization points is sufficient to detect all data races in the program [20]. Thus, the tool investigates polynomial time interleaving space, while checking assertion violations, deadlock, livelock, and data races. In Falcon, we provide the option of introducing random delays, though we did not evaluate it experimentally. In general, we believe bug eliciting methods complement our approach, and combined schemes are possible.
Data race detection. Early work focused on static and dynamic approaches to detecting data races, which occur when multiple threads perform unsynchronized access to a shared memory location (with at least one write). Static techniques include those based on type systems [7], model checking [20], and general program analysis [22]. Dynamic techniques include happens-before (RecPlay [28]) and lockset algorithms (Eraser [29]). There are additional approaches [23, 30], including hybrid analysis [24], that feature improved overheads and reduce the number of false positive reports. The main drawback of data race detectors is that some races—like those used in barriers, flag synchronization, and producer-consumer queues—are common parallel patterns that rely on deliberate but benign races [17]. Programmers are left to sort out benign and problematic cases on their own. In Falcon, we focus on atomicity and order violations (though we can also handle data races) and provide additional information (suspiciousness scores) to help pinpoint a fault’s root cause.
Fault localization. There are a number of fault-localization techniques based on code coverage, particularly for sequential programs [1, 14, 15]. These methods instrument code predicates (e.g., statements or branches) and check coverage by counting the number of occurrences of the predicates in a number of passing and failing executions. These predicates are then assigned some suspiciousness score. Aside from Falcon, CCI [32] and Bugaboo [18] apply to fault localization. The main distinction of Falcon is that it ranks patterns, which can provide more contextual information than statement or predicate expression ranking as done in CCI or Bugaboo.
Atomicity violation detection. Researchers have suggested that atomicity (or serializability) is an alternative higher-level property that could be checked to detect concurrency faults. Atomicity violation detectors were first advocated by Flanagan and Qadeer [10]. Atomicity checkers rely on programmer annotations of atomic regions or other constructs, which the checkers can then verify or use to do additional inference. There are numerous static [10], dynamic [8, 9, 35, 36], and hybrid schemes [3]. The main practical drawback of atomicity violation detectors is the need for investigating synchronization keywords to infer atomic regions, which Falcon avoids by using pattern-analysis techniques.
6. CONCLUSION Our technique for fault localization in concurrent programs combines two promising approaches: (1) dynamic analysis to identify shared memory access patterns associated with order and atomicity violations, and (2) ranking these patterns statistically, using pass/fail test case data. We believe ours to be the first technique to both report and rank patterns. Our empirical study shows that our implementation, Falcon, is effective in ranking true fault patterns highly and efficient in storage and time overheads. Taken together, these observations suggest that a Falconlike approach could be deployed in real test environments. Though our initial study is promising, we need additional studies on more diverse subjects to determine whether our technique generalizes. In addition, our evaluation relied on only one test input and multiple runs. We plan additional studies considering multiple test inputs, input fuzzing, and more analysis of irritator techniques, to see if we can reduce the overall number of runs required to isolate a fault. Another area for future work involves the number of faults
Pattern analysis. Falcon is most closely related to the class of pattern-analysis techniques. These include AVIO, which learns benign data access patterns from “training” executions; during testing executions, AVIO reports as “malicious” any data access patterns not part of the training set [17]. As discussed in Section 4.4, Falcon improves on AVIO by computing suspiciousness scores. This approach prioritizes patterns and mitigates false positive cases. Moreover, it can reduce false negatives, since in AVIO a faulty patterns could appear in both passing and failing executions; in Falcon, our weighted ranking mitigates this effect.
253
that are identified in the program. For deterministic programs, a debugging approach would locate the first fault, fix it, and rerun the test cases again to determine whether the program still failed. For nondeterministic programs, this approach may not work because, after one fault is found and fixed, rerunning the test cases may not be sufficient to determine whether any faults remain. Thus, for concurrent programs, it might be useful to search for several faulty patterns at once. We believe that if several faulty patterns exist in the program, their suspiciousness values may all be high. We plan to investigate whether our hypothesis holds and what additional information we can provide to the developer to assist in locating multiple faults in the program. A third area for future work concerns the faulty patterns that our technique detects. There are additional types of atomicity violations, such as deadlock that can be investigated. Additionally, multiple variable related atomicity violations patterns may identify difficult-to-detect bugs. We plan to investigate extensions to our technique to handle these additional patterns.
7.
[13] C. Hammer, J. Dolby, M. Vaziri, and F. Tip. Dynamic detection of atomic-set-serializability violations. In ICSE, pages 231–240, 2008. [14] J. A. Jones and M. J. Harrold. Empirical evaluation of the tarantula automatic fault-localization technique. In ASE, pages 273–282, 2005. [15] B. Liblit, M. Naik, A. X. Zheng, A. Aiken, and M. I. Jordan. Scalable statistical bug isolation. In PLDI, pages 15–26, 2005. [16] S. Lu, S. Park, E. Seo, and Y. Zhou. Learning from mistakes: A comprehensive study on real world concurrency bug characteristics. In ASPLOS, pages 329–339, March 2008. [17] S. Lu, J. Tucek, F. Qin, and Y. Zhou. AVIO: detecting atomicity violations via access interleaving invariants. In ASPLOS, pages 37–48, 2006. [18] B. Lucia and L. Ceze. Finding concurrency bugs with context-aware communication graphs. In MICRO, pages 553–563, 2009. [19] C. E. McDowell and D. P. Helmbold. Debugging concurrent programs. ACM Computing Surveys (CSUR), 21(4):593–622, 1989. [20] M. Musuvathi and S. Qadeer. Iterative context bounding for systematic testing of multithreaded programs. In PLDI, pages 446–455, June 2007. [21] M. Musuvathi, S. Qadeer, T. Ball, G. Basler, P. Nainar, and I. Neamtiu. Finding and reproducing heisenbugs in concurrent programs. In OSDI, pages 267–280, 2008. [22] M. Naik and A. Aiken. Conditional must not aliasing for static race detection. In POPL, pages 327–338, 2007. [23] S. Narayanasamy, Z. Wang, J. Tigani, A. Edwards, and B. Calder. Automatically classifying benign and harmful data racesallusing replay analysis. In PLDI, pages 22–31, 2007. [24] R. O’Callahan and J. Choi. Hybrid dynamic data race detection. In PPoPP, pages 167–178, 2003. [25] C. Park and K. Sen. Randomized active atomicity violation detection in concurrent programs. In FSE, pages 135–145, 2008. [26] S. Park, S. Lu, and Y. Zhou. CTrigger: exposing atomicity violation bugs from their hiding places. In ASPLOS, pages 25–36, 2009. [27] K. Poulsen. Tracking the blackout bug. SecurityFocus, February 2004. http://www.securityfocus.com/news/8412. [28] M. Ronsse and K. D. Bosschere. RecPlay: a fully integrated practical record/replay system. Trans. Comput. Syst., 17(2):133–152, 1999. [29] S. Savage, M. Burrows, G. Nelson, P. Sobalvarro, and T. Anderson. Eraser: a dynamic data race detector for multithreaded programs. Trans. Comput. Syst., 15(4):391–411, 1997. [30] K. Sen. Race directed random testing of concurrent programs. In PLDI, pages 11–21, 2008. [31] M. S¨ uß and C. Leopold. Common mistakes in OpenMP and how to avoid them. In OpenMP Shared Memory Parallel Programming, volume LNCS 4315, pages 312–323, 2008. [32] A. Thakur, R. Sen, B. Liblit, and S. Lu. Cooperative crug isolation. In WODA, pages 35–41, 2009. [33] C. von Praun and T. R. Gross. Object race detection. In OOPSLA, pages 70–82, 2001. [34] R. Vuduc, M. Schulz, D. Quinlan, B. de Supinski, and A. Sæbjørnsen. Improving distributed memory applications testing by message perturbation. In PADTAD, pages 27–36, 2006. [35] L. Wang and S. D. Stoller. Accurate and efficient runtime detection of atomicity errors in concurrent programs. In PPoPP, pages 137–146, 2006. [36] J. Yi, C. Sadowski, and C. Flanagan. Sidetrack: Generalizing dynamic atomicity analysis. In PADTAD, 2009.
ACKNOWLEDGEMENTS
This work was supported in part by awards from NSF under CCF-0429117, CCF-0541049, and CCF-0725202, and Tata Consultancy Services, Ltd. to Georgia Tech.
8.
REFERENCES
[1] R. Abreu, P. Zoeteweij, and A. J. C. van Gemund. On the accuracy of spectrum-based fault localization. In TAIC PART, pages 89–98, 2007. [2] K. Asanovic, R. Bodik, B. C. Catanzaro, J. J. Gebis, P. Husbands, K. Keutzer, D. A. Patterson, W. L. Plishker, J. Shalf, S. W. Williams, and K. A. Yelick. The landscape of parallel computing research: A view from Berkeley. Technical Report UCB/EECS-2006-183, UC Berkeley, 2006. [3] Q. Chen, L. Wang, Z. Yang, and S. D. Stoller. HAVE: detecting atomicity violations via integrated dynamic and static analysis. In ETAPS, pages 425–439, 2009. [4] J. DeSouza, B. Kuhn, B. R. de Supinski, V. Samofalov, S. Zheltov, and S. Bratanov. Automated, scalable debugging of MPI programs with the Intel® Message Checker. In Proc. Int’l. Wkshp. Software Eng. for HPC System Applications, IEEE Int’l. Conf. Software Eng. (ICSE), pages 78–82, 2005. [5] O. Edelstein, E. Farchi, Y. Nir, G. Ratsaby, and S. Ur. Multithreaded java program test generation. In Java Grande, page 181, 2001. [6] Y. Eytani, K. Havelund, S. D. Stoller, and S. Ur. Towards a framework and a benchmark for testing tools for multi-threaded programs. Concurr. Comput. : Pract. Exper., 19(3):267–279, 2007. [7] C. Flanagan and S. N. Freund. Type-based race detection for java. In PLDI, pages 219–232, June 2000. [8] C. Flanagan and S. N. Freund. Atomizer: a dynamic atomicity checker for multithreaded programs. In POPL, pages 256–267, 2003. [9] C. Flanagan, S. N. Freund, and J. Yi. Velodrome: a sound and complete dynamic atomicity checker for multithreaded programs. In PLDI, pages 293–303, 2008. [10] C. Flanagan and S. Qadeer. A type and effect system for atomicity. In PLDI, pages 338–349, 2003. [11] P. Godefroid and N. Nagappan. Concurrency at Microsoft: An exploratory survey. In Workshop on Exploiting Concurrency Efficiently and Correctly, 2008. [12] R. L. Halpert. Static lock allocation. Master’s thesis, McGill University, 2008.
254