We thank Tim Sullivan and James Clements for providing us with needed data. ... Citation: Finn Christensen and James Manley and Louise Laurence, (2011) ...
Volume 31, Issue 2
The Allocation of Merit Pay in Academia: A Case Study
Finn Christensen Towson University James Manley Towson University
Louise Laurence Towson University
Abstract
This paper investigates whether the widespread awarding of faculty merit pay at a large public university accurately reflects productivity. We show that pairwise voting on a quality standard by a committee can in theory be consistent with observed allocation patterns. However, the data indicate only nominal adherence to a quality standard. Departments with more severe compression issues are more likely to award merit pay as a countermeasure and some departments appear to be motivated by nonpecuniary incentives. Much of the variance in merit pay allocation remains unexplained. These results suggest reform is needed to improve transparency in the merit system.
We thank Tim Sullivan and James Clements for providing us with needed data. Errors are our own. Citation: Finn Christensen and James Manley and Louise Laurence, (2011) ''The Allocation of Merit Pay in Academia: A Case Study'', Economics Bulletin, Vol. 31 no.2 pp. 1548-1562. Submitted: Jan 13 2011. Published: June 05, 2011.
Economics Bulletin, 2011, Vol. 31 no.2 pp. 1548-1562
1. Introduction Merit pay in organizations is designed to induce high effort by rewarding productivity, but in educational institutions often merit pay is awarded too broadly to be an effective incentive. At the University of Washington annual salary increases were called “merit pay” (Gravois 2007). In Florida in 1992 two-thirds of faculty members received merit pay (Anderson 1992). At the large public university we study, the typical department awarded the highest level of merit (“merit plus”) to two-thirds of its members (Table 1). Why is merit pay awarded so generously in academia? Are recipients deserving? Table 1: Merit plus Allocation by Tenure Status and Year Award Year 2007 2008 2009
# faculty Avg % Merit Avg % Merit plus Avg % Merit plus in sample plus – All faculty Tenured Faculty Untenured Professors 492 67% 77% 64% 519 68% 79% 59% 563 68% 80% 58% Both questions have important implications for the design and effectiveness of merit pay on college campuses. If merit pay reflects productivity, an increase in standards may elicit more effort from faculty. If merit pay fails to reflect productivity, faculty may be shifting effort from education to simple politicking to attain greater merit pay (Adnett 2003). Further, confused faculty may be frustrated by a perceived lack of clarity or consistency (cf. Quimby, Ross and Sanford, 2006). Better alignment of merit and productivity increase a merit system‟s effectiveness from the university‟s perspective. A unique aspect of academia is that professors decide on merit pay for their immediate colleagues. Since professors are the experts in their fields, no one else on campus is fully able to evaluate their work. However, asking them to assess their own productivity clearly represents a conflict of interest. Such conflicts are intolerable in most sectors; even CEOs are often required to make a show of obtaining outside evaluation, though they often exert de facto control of their salaries (Elhagrasey, Harrison, and Buchholz, 1999). That said, academic merit pay is not a free-for-all. Departments must justify merit decisions using a faculty member‟s scholarly activity, teaching performance, and service in the prior academic year. At some schools merit and retention raises may be substitutes or complements, but at the university we investigate there are separate policies for merit and retention. Based on this policy and for the sake of simplicity we assume these issues are independent. Each fall, every department is assigned a pool of merit money to allocate among its members. Merit money is allocated by a “merit committee” of tenured faculty members, who decide whether each department member has earned “base merit” or “merit plus” designation based on his or her activities during the preceding academic year (June – May). “Base merit” carries one share of the department‟s total award money, while “merit plus” represents two shares. According to written policy, these decisions should be made solely based on research, teaching, service, and in some departments “collegiality.” Given a fixed pool of merit money, if one person is awarded merit plus, the remaining department members receive less. Thus, each professor desires a standard of merit just loose enough that he is deemed meritorious. Any looser standard erodes the monetary and hedonic value of the designation. Given this structure, our theoretical model shows that sincere voting on an objective standard can result in a large share of the faculty receiving merit plus. With sincere pairwise majority voting, any standard may be chosen depending on the order in which the merit committee considers them (McKelvey 1976). Assuming that the committee proceeds through the available standards from strictest to loosest, we show that the committee will award merit plus to at least half its members. Further, use of a quality standard implies that the probability 1 1549
Economics Bulletin, 2011, Vol. 31 no.2 pp. 1548-1562
of getting merit plus should be increasing in and largely explained by observable output. Finally, under a quality standard, untenured professors will be awarded merit plus less often than tenured professors if and only if they are less productive. We test these theoretical predictions with anonymous university-wide data containing faculty rank, department, and merit status across three years. Additional anonymous data within the university contains merit decisions and productivity measures. The probability of merit does increase with productivity in the college-level data. However, little of the variation in awards is explained by observable output. Moreover, the way observable output influences decisions differs by tenure status. Untenured professors are on average as productive as tenured faculty members on observable measures, yet are awarded merit pay at significantly lower rates (see Table 1). Thus, the evidence indicates only nominal adherence to a quality standard. We identify two factors other than productivity which seem to influence decisionmaking. First, we see “warm glow” awarding in some departments in which all or nearly all members are awarded merit plus. There the hedonic value of deeming a colleague meritorious exceeds the monetary cost of doing so. A similar possibility is that decisionmakers award merit plus to avoid backlash from unhappy colleagues (COHE 2004). Second, we investigate whether merit is used to address compression (low salaries of some senior faculty relative to the salaries offered to new hires). We find some support for this hypothesis. Given the issue‟s inherent complexity and its immediate importance for many economists, surprisingly little has been written in the economics literature about merit pay at universities. Much more attention has been devoted to the tenure system (e.g., McPherson and Schapiro, 1999; Carmichael, 1988; Dnes and Garoupa, 2005). Like this paper, Euwals and Ward (2005) and Tuckman, Gapinksi, and Hagemann (1977) investigate the relationship between faculty remuneration and output. Both find that research output positively influences a professor‟s salary. However, Euwals and Ward find that quality teaching is an important determinant of salaries while Tuckman et al. find only a weak relationship. This paper differs in two key respects. First, we have data on both annual merit decisions and productivity; the others do not observe raises directly. Second, we identify annual changes in salary due to merit evaluations rather than overall salary. In the next section we review the literature, and in Section 3 present our theory of merit allocation. Section 4 describes the data and evidence of warm glow awarding. Section 5 investigates the data more deeply and Section 6 offers suggestions for improving merit. 2. Literature Review Some studies show that merit pay can motivate above average performers (Marsden French and Kubo 2001) and that it can improve schools more effectively than upgrading equipment or facilities (Lavy 2002). However, many analysts conclude that merit pay is difficult to organize effectively in an educational setting. In a far-reaching review, Hanushek (1986) finds that school expenditures are not linked to school performance, and often merit pay has been tried but rarely persists. Burgess and Ratto (2003) note that early in their careers, workers need to demonstrate that they are hard workers, so additional incentives are redundant. Dixit (2002) notes that in education, many outcomes are unobservable and measuring progress toward these outcomes is still harder. He concludes that “We should not expect [education] to turn into a[n]… organization that is left free to devise its own best procedures and judged by outcomes” (p. 721). Indeed, such incentives often fail. Government workers facing incentive schemes tend to “game” the system (Courty and Marschke 2003, Courty and Marschke 2004). In Kenya, student achievement-based compensation failed to increase teachers‟ classroom attendance (Glewwe, Ilias, and Kremer 2002). Worse, merit pay can disincentivize teamwork and detract 2 1550
Economics Bulletin, 2011, Vol. 31 no.2 pp. 1548-1562
from intrinsic motivation to work (Burgess et al. 2001, Belfield and Heywood 2008, Hanshaw 2004). Further, merit pay skews incentives such that the appearance of yearly results supersedes risk-taking or long-term investment (Foldesi 1996). The inability to adequately measure performance can become frustrating and sap teachers‟ motivation (Marsden French and Kubo 2001). 3. A Theory of Merit Allocation At the university we study, each academic department forms a merit committee, typically composed of the department‟s tenured faculty members, which must allocate a pool of merit money π among all faculty members in the department. Each department member is assigned either one merit point (base merit) or two merit points (merit plus). The value of a merit point equals the total value of the merit pool divided by the total number of points awarded. Thus, if a department has N members and n ≤ N members are awarded merit plus, the value of a merit point is π/(N+n). Those receiving merit plus get a merit raise of 2π/(N+n) while those receiving base merit get a merit raise of π/(N+n). Note that keeping one‟s merit level fixed, an individual prefers that fewer people receive merit plus (MP). Moreover, one is always at least as well off receiving MP compared to base merit (BM) regardless of how many others receive MP: 2π/(N+n)≥ π/(N+n’) for any 0≤n, n‟≤N, with equality iff n=N and n‟=0. Written policy documents indicate that merit decisions should be made annually solely on the basis of a person‟s research, teaching, service, and “collegiality.” Crucially, there are separate policies for retention and compression. In practice merit pay could be a way to address these other compensation issues, but this is not what written policy states. Our objective is to test whether merit is allocated according to policy. If the merit committee adheres to the written policy, a de facto quality standard will emerge where all faculty members at or above a given position in the ranking are awarded MP and those below are awarded BM. Call the cutoff quality rank the quality standard. If merit is allocated following a quality standard, it follows that: 1. The probability of getting MP is increasing in observable output; 2. A large fraction of the variance in merit decisions can be explained by variation in observable output; and 3. The probability of getting MP is independent of factors unrelated to scholarship, teaching, service and collegiality. Examples include the severity of a department‟s compression issues and a faculty member‟s tenure status. We next analyze the committee‟s decision-making process to show that widespread awarding of MP is not sufficient to conclude that the committee fails to follow policy. Departments with N faculty members select from among N+1 quality standards since they may choose to award merit plus to no one. Interestingly, in general there is no quality standard which is a Condorcet winner, where the Condorcet winner is the standard that wins by majority (sincere) vote in every pairwise contest. Consider the following example. The committee has three members, Ann, Bob, and Chuck. Ann is ranked highest, Bob second and Chuck third. Table 2 shows each member‟s preference ranking over the available quality standards where the number one indicates a person‟s preferred option. The reader can easily verify that there is no Condorcet winner in this example.
3 1551
Economics Bulletin, 2011, Vol. 31 no.2 pp. 1548-1562
Table 2: Preference Rankings over Quality Standards Quality standard No-MP A B C
Ann
Bob
Chuck
3 1 2 3
2 3 1 2
1 2 3 1
Moreover, common resolutions to the non-existence of a Condorcet winner like the Borda Count and Smith set fail to select a standard in this application, or to even reduce the number of quality standards the committee might select. More sophisticated resolutions (see Persson and Tabellini 2000) also fail to narrow down the possible outcomes. In addition, any quality standard may be chosen if the committee proceeds through the options by sincere pairwise majority voting, as in McKelvey‟s Theorem (McKelvey, 1976). Given the weak power of standard voting solutions, we require strong assumptions to identify the quality standard selected. Assume the committee proceeds through the available standards by sincere pairwise majority voting, where the first contest is between the two highest standards and each subsequent contest pits the previous winner against the next highest standard. Consultations across the campus imply that this is a reasonable abstraction. To state our main result, define the median committee member as the member whose quality rank has the property that at least half of the committee members are of equal or higher quality and at least half of the committee members are of equal or lesser quality. Proposition 1: Assume If there is an odd number of committee members, sincere pairwise majority voting selects the quality standard equal to the median committee member‟s quality rank when standards are considered in decreasing order. Proof. Sincere voting means that committee members vote for whichever quality standard they prefer in every pairwise vote. In this case the no-MP quality standard wins every round in which it is paired against a quality standard that is strictly above the median committee member‟s quality rank. This is because every member at or below the median committee member‟s quality rank (a majority) strictly prefers the no-MP standard since she will receive BM under either standard and the no-MP standard implies a higher value of a merit point. The median committee member‟s quality rank is preferred to the no-MP standard since the members at or above the median committee member‟s quality rank constitute a majority, and these people prefer the former standard because they receive MP. This majority will hold as the committee proceeds through the remaining contests since lower standards reduce the value of a merit point and members in the majority already get MP. This result can easily be extended to even numbered committees and to the case where there are ties in the quality ranking. We leave the details to the reader. This model explains why merit is broadly awarded in academic settings. Proposition 1 implies that at least half of the committee members (i.e., tenured faculty) will receive MP; even more will receive MP if and only if there are ties at the median quality level. The reader can easily verify Proposition 1 in the example presented in Table 2 above. We recognize that even in this simple example committee members may improve their outcome by voting strategically when others vote sincerely. However, this model intentionally rules out such behavior to show how MP can be awarded to a large majority of tenured professors absent strategic considerations.
4 1552
Economics Bulletin, 2011, Vol. 31 no.2 pp. 1548-1562
4. The Data We gathered three datasets from a public university with over 500 faculty members. First, we use a university-wide panel, summarized in Table 3, with 1587 observations on individual faculty in a total of 43 departments over one or more years from 2007-2009. Each observation consists of year, college, department, tenure status, and merit status (defined as “no merit,” “base merit,” or “merit plus”). To examine department level decisions, many tables are at the “department-year” level, which is the set of merit decisions made by a departmental committee in one year. For example, the average “percent tenured” in Table 3 is the share of tenured faculty members in the mean department-year. Table 3: Sample Statistics for the Trimmed Full University Sample (N=100) Award Year 2007 2008 2009
# faculty in sample 476 503 548
# depts. 32 33 35
Avg % tenured 64% 60% 56%
Avg % merit plus 64% 68% 66%
Avg % tenured MP 76% 79% 79%
Avg % Avg % untenured MP untenured MP* 57% 64% 56% 59% 54% 58%
MP = Merit plus. *Last column from untrimmed sample (N=117). All others exclude department-years including five faculty or fewer.
In the mean department-year, over 75% of tenured faculty receive MP. In the untrimmed data, untenured professors receive merit plus designation slightly more often. If money is the primary concern, smaller departments should award less merit plus. For example, if a department of 20 has $20,000 to award for merit and they award everyone base merit, each receives a $1000. If they award just one person merit plus, the value of a merit point falls to $20,000/21 = $952. Thus 19 faculty members lose $48 each by giving that one merit plus designation. If a department of 5 has a merit pool of $5000 and moves from zero to one merit plus, four faculty members lose $167 each. In fact small departments (with fewer than 5 faculty) are more generous, as shown in Tables 4 and 5, a difference significant at the 1% level. Perhaps in small departments the cost of having an alienated department member outweighs other concerns. Table 4: Merit Awards in Small Departments (departments with < 5 total faculty) (N = 17)
Award year
# faculty in sample
# depts
Avg % tenured MP
2007 2008 2009
16 16 15
6 6 5
90% 75% 100%
Avg % untenured MP 100% 80% 85%
Table 5 compares department sizes among departments awarding merit plus to a large share of the faculty. The most generous quintile bestows MP on an average of 96% of their faculty. Looking at department-years in this quintile, we again find a highly significant (P(t) < 2%) association with size. Since these departments, which are smaller, place more value on the hedonic importance of the designation than on its monetary value, we call them Warm Glow departments. Here the awards have basically no incentive function.
5 1553
Economics Bulletin, 2011, Vol. 31 no.2 pp. 1548-1562
Table 5: Warm Glow and Department Size
Warm Glow (N = 22) Regular (N = 95)
Dept size
# untenured
% tenured
9.8 14.3
3.4 5.9
55% 57%
% MP among tenured 98% 74%
% MP among untenured 89% 44%
We investigate heterogeneity among colleges in Tables 6 and 7. Table 6: Merit Pay by College
% Merit plus Department size % Tenured % Tenured getting MP % Untenured getting MP # of dept-years in data
College A 52% 11.2 68% 59% 36%
College B 84% 14.1 63% 94% 68%
College C 52% 14.3 62% 63% 36%
College D 77% 8.2 59% 89% 58%
College E 69% 22.9 62% 79% 53%
College F 77% 11.1 32% 91% 65%
14
18
30
18
15
22
College E 0 15 0%
College F 8 14 36%
Warm Glow departments are mostly found in just a few colleges. Table 7: Warm Glow by College College A Warm Glow (N = 22) 0 Regular (N = 95) 14 % Generous 0%
College B 8 10 44%
College C 1 29 3%
College D 5 13 28%
The department size and the college level Warm Glow effects are distinct: College B has the most Warm Glow but no departments with fewer than 5 members. Of 17 small department-years, 4 are in College C, 6 in College D, and 7 in College F. Regressing a Warm Glow dummy on department size and college dummies finds that department size is negative and significant at the 1% level. College B is large, positive and significant at the 5% level. The opposite of Warm Glow‟s abundant awarding is parsimony. The bottom quintile of department-years awarded MP to an average of fewer than 36% of their faculty members, shown in Table 8. Colleges A and C are the most sparing with their awards. Table 8: Parsimony by College
Parsimonious DeptYear (N = 28) Regular (N = 89) Share Parsimonious (%)
College A 6
College B 1
College C 15
College D 1
College E 1
College F
8 43%
17 6%
15 50%
17 6%
14 7%
18 18%
6 1554
4
Economics Bulletin, 2011, Vol. 31 no.2 pp. 1548-1562
Our second dataset contains anonymous information for College A from 2005 – 2009, providing our most detailed information. Its relative parsimony makes it less representative of the university but more instructive as an example, as it shows more heterogeneity. The data include the productivity of individual faculty members, including publications and teaching evaluations during the academic year in question, as well as merit status. While merit status is determined in the fall of the following academic year, we of course match the merit decision to the academic year to which it corresponds. Teaching evaluations are completed by students late in the semester. Students are asked for their “Overall perception of the instructor,” and can respond with “Poor,” “Fair,” “Satisfactory,” “Good,” or “Excellent.” These are translated into 1, 2, 3, 4, and 5, and the mean of the student responses likewise yields a number between 1 and 5. Publications are limited to peerreviewed journals. This is a simple annual count of publications produced. First year faculty members always receive base merit and are dropped from the data. The resulting data contain 189 faculty-years in five departments from 2005-2008. Missing data on teaching evaluations, journal publications, and merit status leave us with 164 observations. Summary statistics for faculty-years are shown in Table 9. Table 9: Micro-data on faculty-years in College A N
Untenured Professors Tenured Professors
34 130
Mean teaching evaluation score 4.27 4.22
Peerreviewed journals 0.85 0.75
Merit award
44% 58%
T-tests, both raw and clustered at the department level, show that only the last difference is statistically significant at the 10% level. Untenured professors on average teach and publish as well as tenured professors. In fact, by both criteria, they appear slightly more productive, though the difference is not statistically significant. However, they are significantly less likely to be awarded merit plus. Information on the salaries of employees at this university is public information. We acquired salary data for all employees as of September 2008 and computed departmental medians for tenured and tenure track faculty. These medians are used to compute the salary ratio of tenured faculty to untenured faculty by college shown in Table 10. The universitywide merit pay data cover three years ending months before the time period described by this salary data. However, salaries are unlikely to vary greatly from year to year. Table 10: Median Salary Ratio of Tenured to Untenured by College College A Tenured/Untenured Salary Ratio
1.19
College B 1.44
College C 1.44
College D 1.44
College E 1.43
College F 1.34
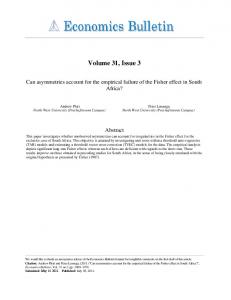
5. Results College A‟s annual data on merit decisions and productivity allow investigation of a quality standard. The quality standard theory predicts that at least half should get MP, and ties could drive up the share achieving it. For example in a department of five if two people published articles and three did not, a publication-based quality standard would give all MP.
7 1555
Economics Bulletin, 2011, Vol. 31 no.2 pp. 1548-1562
Thresholds should be visible in a scatterplot but Figure 1 shows that little is apparent among tenured professors. One threshold is visible at the three publication level, at which point all faculty receive MP. While this threshold could imply a quality standard, this standard only applies in 10 of 130 cases. Ties do not seem to be a sufficient explanation for the preponderance of MP designation among tenured faculty. Figure 1: Merit plus by Publications and Teaching Evaluation Scores, Tenured Only
8 1556
Economics Bulletin, 2011, Vol. 31 no.2 pp. 1548-1562
Figure 2: Merit plus by Publications and Teaching Evaluation Scores, Untenured Faculty Only
Figure 2 illustrates the same schematic for untenured professors, and the absence of a threshold here is even more striking. Three of the five faculty-years in which a professor produced three or more peer-reviewed journal articles were deemed unworthy of MP. An appealing cluster of MP-receiving work is noticeable at teaching evaluations above about 4.6 (as shown by the dashed red line). However, exceptions are abundant on both sides. Table 11 applies regression analysis to merit status. Publications are significant at the 5% level and evaluation scores at the 1% level. Both have the expected positive signs and are robust to the inclusion of a dummy for tenure, which is itself positive and significant at the 10% level. (We also tried OLS (vs. probit) and department fixed and random effects. Department size is in each regression; it is always negative and usually significant at the 15% level. Its omission leaves coefficients unaffected.) Near significance of the tenure variable argues against a quality standard, though the marginal significance precludes a strong conclusion. Next, we split peer-reviewed journal articles and teaching evaluations into different variables for tenured and untenured faculty. While articles are positively and significantly associated with merit status overall, the results are much weaker for untenured professors. The point estimate is less than one third that of senior faculty and statistically indistinguishable from zero. Publishing in a peer-reviewed journal is not associated with an increase in the probability of obtaining merit pay for untenured faculty, though it is for tenured faculty. In the case of evaluations the point estimate for untenured professors stays close to that for tenured faculty, though a doubling of the standard error removes the statistical significance. Higher teaching evaluations bring an increased likelihood of merit pay for tenured faculty, but the relationship is less clear for junior faculty.
9 1557
Economics Bulletin, 2011, Vol. 31 no.2 pp. 1548-1562
Table 11. Micro-data Probit Regression Results (1) (2) Peer-reviewed journal 0.11*** 0.12*** articles (PRJ) (0.04) (0.04) PRJ: untenured only PRJ: tenured only Evaluation score
0.33*** (0.10)
0.34*** (0.10)
(3)
0.06 (0.06) 0.16*** (0.06) 0.35*** (0.10)
Evals: untenured only Evals: tenured only Tenured Pseudo-R2
0.10
0.18* (0.10) 0.11
0.11 (0.12) 0.12
(4)
0.06 (0.06) 0.16*** (0.06)
0.27 (0.20) 0.37*** (0.11) -0.29 (0.80) 0.12
* significant at 10% level; ** at 5%; *** at 1% level. N = 164 faculty years for all regressions. Coefficients are marginal effects.
Tenured faculty experience a clearer quality standard than do untenured faculty. This speaks against uniform application of a quality standard, but an obvious concern is the small sample size of untenured faculty-years (N = 34). The results persist through trimming various sets of outliers, including four faculty-years (12%) of junior faculty who published 3 peer reviewed journal articles but were nonetheless denied merit plus designation. The finding is robust though the small sample size keeps us from making sweeping pronouncements. More convincing are the first results. While publications and teaching evaluations are positively and significantly associated with MP status, they explain just 10% of variation in MP attribution. One possible explanation is that an outside overseer imposes nominal adherence by threatening to overturn decisions deviating too far from a quality standard. We cannot capture faculty service contributions including committee work or serving as department chair. Service is likely correlated with tenure status, biasing our results for tenured faculty upward. However, anecdotal evidence and official documentation suggest that service work is weighed less than teaching and research. We are confident that adding service indicators would not account for the other 90% of variation in MP assessment. We also have no data on the “collegiality” criterion mentioned in the written policy, so this and other potentially important unobservable variables fall into the error term. Finally, we have not incorporated any measures of publication quality. We merged journal impact factors and included them in regressions, but coefficients were never remotely significant. Finally, an anonymous reviewer points out that consistency of publications, papers submitted rather than published, or papers receiving “revise and resubmit” may be included in evaluations, though surely papers would not be included in merit pay evaluations in more than one year. If untenured professors are as qualified as tenured professors, and MP is awarded on a quality standard they should receive MP at the same rate. Table 9 shows that untenured faculty are on average just as productive but are awarded MP at much lower rates. No untenured faculty are awarded merit plus in 12-13% of department-years, and tenured faculty were 50% more likely to get MP in 20 of 110 department-years. Seven of 15 departments awarding no untenured professors MP awarded merit plus to all tenured faculty. Overall the mean difference is about 28%. 10 1558
Economics Bulletin, 2011, Vol. 31 no.2 pp. 1548-1562
Neither college nor department size predict this discrimination, as shown in Tables 12 and 13. (Seven department-years lack either tenured or untenured faculty.) Table 12: Correlation of MP and Department Size Dept size # untenured # tenured High differential (N = 20) 13.6 5.2 8.4 Regular (N = 90) 14.3 5.8 8.5 Table 13: Differential in rates of MP: Tenured vs. Untenured Faculty, by College
MP Differential
College A 23%
College B 26%
College C 27%
College D 31%
College E 26%
College F 26%
When salaries increase faster in the market than within a university, junior faculty members‟ salaries can exceed senior faculty members‟ salaries. This shortfall, called salary compression, could be addressed through merit pay. If merit pay is so used, a low share of untenured professors should get merit, and more specifically, a lower share of untenured professors should get merit where compression is apparent. We generate an index of compression in each department as of 2009 by dividing the median salary of full professors in the department by the median salary of untenured professors (college level data are in Table 10). The salary data do not overlap exactly with the years of our data, but the number of faculty is on the rise through the relevant time period. Thus, new hires exceed the number of faculty leaving and compression likely increased. Assessing compression at the end of the time period should therefore identify the most egregious cases of compression. If MP has been used to combat compression, compression would be less prevalent in our data thanks to the salary-increasing effect of MP. Compression ratios are available for 37 departments and range from 1.10 to 2.09. In Table 14 we regress the share of tenured faculty members receiving merit plus against a dummy variable indicating the top quintile of salary-compressed departments, and come up with a coefficient with the wrong sign and statistically indistinguishable from zero. We repeat the analysis including college level fixed effects and this time the coefficient is of the appropriate sign and significant at the 5% level. Next we regress a new dependent variable, the ratio of tenured faculty receiving MP to the share of untenured faculty receiving MP, on an indicator for the most compression. The indicator is significant at the 10% level when it is alone. Including college and year effects nearly doubles the coefficient and the statistical significance improves to the 2% level. Tenured faculty are more likely than untenured to get MP when compression is observed, refuting the quality standard hypothesis. Table 14: Regression Results including Compression Ratios Dependent % of tenured % of tenured Share of tenured MP/ Share of tenured MP/ variable: getting MP† getting MP† Share untenured MP‡ Share untenured MP‡ Most compressed -0.08 (0.06) 0.16** (0.07) 1.35* (0.76) 2.64** (1.09) quintile Year indicators Included Included College indicators Included Included N 100 100 87 87 2 R 0.02 0.41 0.04 0.10 ** = significant at 5% level; * = significant at 10% level. †Mean (SD) = 0.77 (0.25). ‡Mean (SD) = 3.0 (3.0).
11 1559
Economics Bulletin, 2011, Vol. 31 no.2 pp. 1548-1562
6. Conclusion A quality standard borne out of the written policy does not explain merit decisions in the university. Tenured faculty receive merit plus at higher rates, a difference not attributable to superior productivity. We note, however, that this research cannot rule out that merit is allocated according to some quality standard which is not well-captured by written policy. It could be that the university uses a quality standard based on attributes which are difficult to quantify but still observable to colleagues deciding on merit pay. Nevertheless, this does not change the conclusion that written guidelines do not explain merit allocation. Our theory section identifies a key tension in merit pay. Each faculty member desires a quality standard low enough so that he or she can be granted a high merit status, but also high enough so that the value of that merit status is not diluted. This can lead to a majority of those with power voting themselves “merit plus” status as in our data. However, likely common standards such as publications and teaching evaluations explain only a small part of the variation in awards, and may not even matter for untenured faculty. Instead, we see merit used to address compression issues in departments where this issue is pronounced. We also observe “warm glow” awarding, in which all or most faculty members are honored. This phenomenon is common in certain colleges, where like children in Garrison Keillor‟s Prairie Home Companion radio show, everyone is above average. Our analysis is from just one university and therefore our conclusions are based on a relatively small sample size. However, by focusing on one university we became familiar with institutional details. Also we lack data on retention raises and outside offers, though influence on merit decisions would only amplify the discordance between the written policy and actual practice of merit allocation. Finally, some of the observed behavior could be explained as a quality standard in which untenured professors are awarded tenure less frequently in an acknowledgement that other concerns (i.e. the desire to be awarded tenure) already provide sufficient incentives for assistant professors. Despite the opacity and apparent ineffectiveness of merit pay for professors (c.f. Marsden, French, and Kubo 2001; Hanshaw 2004) and for educators more generally (e.g. Adnett 2003, Dee & Keys 2004, Lavy 2002, Podgursky & Springer 2006), stakeholders‟ demands for accountability from professors mean merit systems are here to stay. In 199, the president of one public university implemented a merit system in response to the state legislature‟s “discussions about the professor who was seen mowing his/her lawn at 2:00 in the afternoon instead of „working‟” (McMahon and Caret 1997). Tenure incentivizes the untenured, but merit pay provides a means for the university to incentivize tenured faculty. So how can merit policy be designed more efficiently? First, merit policy designers should strive to make the policy as transparent as possible. Second, those who implement the policy (merit committees) should have little incentive or ability to deviate from it. In closing, we call the economic community‟s attention to the paucity of research in this area. Merit systems at many universities are in need of reform. Economists, particularly experts in mechanism design, are well-equipped to significantly improve this process.
12 1560
Economics Bulletin, 2011, Vol. 31 no.2 pp. 1548-1562
References Adnett, Nick. 2003. “Reforming teachers‟ pay: incentive payments, collegiate ethics, and UK policy.” Cambridge Journal of Economics 27: 145-157. Anderson, Kristine L. 1992. “Faculty Support for a Merit Pay System.” Association for the Study of Higher Education Annual Meeting Paper. 38pp. Belfield, Clive R., and John S. Heywood. 2008. “Performance Pay for Teachers: Determinants and Consequences.” Economics of Education Review 27: 243-252. Burgess, Simon, Bronwyn Croxson, Paul Gregg, and Carol Popper. 2001. “The Intricacies of the Relationship Between Pay and Performance for Teachers: Do Teachers Respond to Performance Related Pay Schemes?” CMPO Working Paper Series No. 01/35, July, 32pp. Burgess, Simon, and Marisa Ratto. 2003. “The Role of Incentives in the Public Sector: Issues and Evidence.” Oxford Review of Economic Policy, Summer 19(2): 285-300. Carmichael, H. Lorne, 1988. “Incentives in Academics: Why is There Tenure?” Journal of Political Economy 96(3): 453-472. COHE (The Chronicle of Higher Education). 2004. “What Am I Worth?,” April 23. http://chronicle.com/article/What-Am-I-Worth-/44570/ Accessed June 11, 2010.
Courty, Pascal, and Gerard Marschke. 2003. “Dynamics of Performance measurement systems.” Oxford Review of Economic Policy Summer 19(2): 268-284. Courty, Pascal, and Gerard Marschke. 2004. “An Empirical Investigation of Gaming Responses to Explicit Performance Incentives.” Journal of Labor Economics 22(1): 23-56. Dee, Thomas S., and Benjamin J. Keys. 2004. “Does Merit Pay Reward Good Teachers? Evidence from a Randomized Experiment.” Journal of Policy Analysis and Management 23(3): 471-88. Dnes, Antony and Nuno Garoupa, 2005. “Academic Tenure, Posttenure Effort, and Contractual Damages,” Economic Inquiry 43(4): 831-839. Dixit, Avinash. 2002. “Incentives and Organization in the Public Sector: An Interpretative Review.” Journal of Human Resources 37(4): 696-727. Elhagrasey, Galal M., J. Richard Harrison, and Rogene A. Buchholz. 1999. “Power and Pay: The Politics of CEO Compensation.” Journal of Management and Governance 2: 309-332. Euwals, Rob and Melanie E. Ward. 2005. “What Matters Most: Teaching or Research? Empirical Evidence on the Remuneration of British Academics.” Applied Economics 37: 1655-1672. Foldesi, Robert. 1996. “Higher Education Compensation Systems of the Future.” CUPA Journal Summer 47(2): 29-32. Glewwe, Paul, Nauman Ilias, and Michael Kremer. 2002. “Teacher Incentives.” Mimeo, Brookings Institution, Washington DC, November. Gravois, John. 2007. “U. of Washington Settle Lawsuit Over Pay for Part-Time Lecturers.” Chronicle of Higher Education July 13, vol. 53. 1p. 13 1561
Economics Bulletin, 2011, Vol. 31 no.2 pp. 1548-1562
Hammond, Ron J., Pat Ormand, Terry Nichols, John Balden, Linda Edgeton, Keith Snedegar, Denza Bruss, Linda Makin, and Karl Worthington. 1999. “An Exercise in Growth and Adaptation for a Rapidly Growing State College: Faculty Pay Scale Report and Proposals. Presented to the Faculty Senate by the UVSC Faculty Senate Budget Committee, 19981999.” Utah Valley State College, Orem, Utah. Hanshaw, Larry G. 2004. “Value-Related Issues in a Departmental Merit Pay Plan.” The Professional Educator. Spring XXVI(2): 57-68. Hanushek, Eric. 1986. “The Economics of Schooling: Production and Efficiency in Public Schools.” Journal of Economic Literature. September 24(3): 1141-1177. Lavy, Victor. 2002. “Evaluating the Effect of Teachers‟ Group Performance Incentives on Pupil Achievement.” Journal of Political Economy December 110(6): 1286-1317. Marsden, David, Stephen French, and Katsuyuki Kubo. 2001. “Does Performance Pay DeMotivate, and Does It Matter?” Center for Economic Performance/ LSE Working paper, August, 43pp. McKelvey, Richard D. (1976). “Intransitivities in Multidimensional Voting Models and Some Implications for Agenda Control.” Journal of Economic Theory 12, 472-482. McMahon, Joan D., and Robert L. Caret. 1997. “Redesigning the Faculty Roles and Rewards Structure.” Metropolitan Universities Spring: 11-22. McPherson, Michael S. and Morton Owen Schapiro. 1999. “Tenure Issues in Higher Education.” Journal of Economic Perspectives 13(1): 85-98. Persson, Torsten and Guido Tabellini, 2000. Political Economics: Explaining Economic Policy. MIT Press: Cambridge. Podgursky, Michael J., and Matthew G. Springer. 2006. “Teacher Performance Pay: A Review.” National Center on Performance Incentives Working Paper. October 24. 52 pp. Quimby,J., Ross,D. and Sanford,D. 2006. “Faculty Perceptions of Clarity in Promotion and Tenure Evaluations” The Teachers College Record (Columbia University) August 16, 2006. http://www.tcrecord.org ID Number: 12668. Tuckman, Howard P., James H. Gapinski and Robert P. Hagemann. 1977. “Faculty Skills and Salary Structure in Academe: A Market Perspective.” American Economic Review 67(4):692702.
14 1562