VTLN Using Different Warping Functions for Template Matching
Maulik C. Madhavi1 , Shubham Sharma2 and Hemant A. Patil1 {maulik_madhavi, hemant_patil}@daiict.ac.in,
[email protected] 1Dhirubhai
Ambani Institute of Information and Communication Technology, Gandhinagar. 2Indian
Institute of Science, Bangalore.
Friday, 03.07.2015
Presented At: PReMI 2015 - Warsaw University of Technology, Warsaw, Poland, June 30 - July 3, 2015
2
Vocal Tract Length Normalization (VTLN)
Speech variation variation in vocal tract length [1] Vocal Tract Length Adult female (13 cm) Adult male (17.5 cm) Formant frequencies in female is higher than male Fn
2n 1v , 4L
n
v = velocity of sounds, L = length of vocal tract Length of vocal tract L Let AB B FA AB FB for speaker A LA LA for speaker B LB
Speaker pair specific warping factor αAB
[1] L. Lee, and R. Rose, “A frequency warping approach to speaker normalization.” IEEE Trans. on Speech & Audio Process., vol. 6, no.1, pp. 49-60,1998.
3
Frequency Warping Functions (1/4)
Limitation of speaker-pair specific warping Need to estimate for all the different pair This motivates for universal frequency warping
Universal Non-linear warping Log warping Piece-wise log warping Mel scale warping Bark scale warping ERB (Equivalent Rectangle Bandwidth) warping
4
Frequency Warping Functions (2/4)
Log-warping
Replace by ef
FA ( ) FB ( AB )
FA ( ) FA (e f ) FB ( AB ) FB ( AB e f ) FB (e f log AB )
f A (f) f B (f log AB )
Using shift invariant property of Fourier Transform Z A ( ) FT f A ( f ) FT f B ( f log AB ) FT f B ( f ) e jlog AB ZB ( )e jlog AB Z A ( ) ZB ( )
[1] S. Umesh, L. Cohen, N. Marinovic, D. Nelson, “ Frequency-warping in speech,” 4th Int. Conf. on spoken Lang. Process., ICSLP. Vol. 1, pp. 414-417, 1996.
5
Frequency Warping Functions (3/4)
Piecewise-log warping Speaker dependent warping factor is function of frequency band [1] 5 frequency bands [100,240),[240,550),[550,1280),[1280,3000),[3000,7000)
Mel-warping Steven and Volksmann[2] Frequency stimuli corresponds to the distance on basilar membrane of Guinea pig fmel
fHz 2591log10 1 700
[1] S. Umesh, L. Cohen, N. Marinovic, D. Nelson, “ Frequency-warping in speech,” 4th Int. Conf. on spoken Lang. Process., ICSLP. Vol. 1, pp. 414-417, 1996. [2] D. O'shaughnessy, : Speech communication: human and machine. Universities press, 1987.
6
Frequency Warping Functions (4/4)
Bark scale warping Zwicker, Flottorp and Stevens in 1956. Loudness perceived high at higher frequencies[1]. Within certain frequency band – loudness constant (critical band). Frequency subdivision ~ filterbank in human cochlea. 2
fBark
f 13 tan 0.00076 fHz 3.5 tan Hz 7500 1
1
ERB-warping Critical bandwidth: constant, for centre frequencies < 500 Hz [2]. fERB 11.17 ln
fHz 0.312 43 fHz 14.675
[1] E. Zwicker, G. Flottorp, and S. S. Stevens, “Critical band width in loudness summation,” J. Acoust. Soc. Am., vol. 29, no. 5, pp. 548-557, 1957. [2] B. C. J. Moore, B. R. Glasberg, “Suggested formulae for calculating auditory-filter bandwidths and excitation patterns ,” J. Acoust. Soc. Am., vol. 74, no. 3, pp. 750-753, 1983.
7
Discrete Implementation (1/3)
Non-uniform DFT Non-uniform frequency samples. Warped-domain equally spaced. Mapped back to frequency-domain . Warping function Warped frequency
Frequency in Hz
Fig. A schematic representation to describe frequency warping
8
Discrete Implementation (2/3)
For N point non-uniform DFT: Warped frequency equal N points. For log warping: log(fs/ 2) log(1) log(fs/ 2) v , Non-uniform DFT N N N 1
X (k ) x (n )e j 2 n(e
k v
)/fs
fs is the sampling frequency.
k 0,1, , N 1.
,
n 0
In general, ekv is replaced by fw-1(kv), fw-1 ~inverse mapping to Hz. fw can be fmel, fBark or fERB. N 1
X (k ) x (n )e
j 2 nfw1 (k v )/fs
,
k 0,1, , N 1.
n 0
Piecewise log-warping: different number of points in 5 frequency bands. 34, 47, 84, 141 and 206 points in the five bands.
9
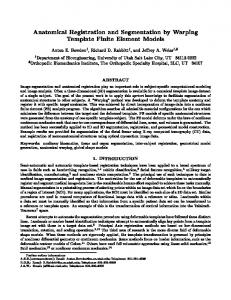
Discrete Implementation (3/3) Log scale Piecew ise-log
6000
Mel scale Bark scale ERB scale
Frequency in Hz
5000 4000 3000 2000 1000
50
100
150 200 250 300 350 Warped frequency samples
400
Fig. Plots of different warping schemes.
450
500
10
Feature Extraction Average across the subframe remove the harmonics.
25 ms frame 100 Hz frame rate Hamming window Speech signal
Pr e-emphasis and Windowing
Subframing
Subframing to remove source harmonics
Averaged Autocorrelation
Warping in frequency-domain Non-uniform DFT
Magnitude -log
Non-uniform frequency warping
Fig. : Block diagram to illustrate procedure of feature extraction.
DCT
Features
11
Experimental Setup
Dynamic Time Warping (DTW) [1] template matching. Efficient for dynamically misaligned patterns. Evaluation metrics. Precision @ N : Precision value at top N correct occurrence of word. Range: 0 to 1 (0% to 100 %). Ideal value: 1 (100%). Equal Error Rate (EER): Error rate when False Acceptance and False Rejection are same. Range: 0 to 1 (0% to 100%). Ideal value: 0 (0%).
[1] H. Sakoe, and S. Chiba, “Dynamic programming algorithm optimization for spoken word recognition,” IEEE Trans. on Audio, Speech, & Language Process., vol.26, no.1, pp.43-49, 1978.
12
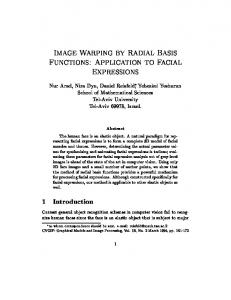
Miss probability (in %)
Experimental Results on TIMIT MFCC Piecewise-log log Mel Bark ERB
25 24 23 22 21 20 19 18 17 16
TIMIT:= TIMIT Acoustic-Phonetic Continuous Speech Corpus.
50 spoken words are taken.
No. occurrences: 30-50 . (Total ~1800 instances)
15 14
Table . % Precision and % Equal Error Rates (EER) Obtained by Different Feature Sets (in %) for TIMIT Database.
13 12 11 10 9
10 11 12 13 14 15 16 17 18 19 20 2122232425 False Alarm probability (in %)
30
Fig. : DET curves for template matching experiments for TIMIT database.
Feature Set
MFCC
Logwarping
Precision EER
36.69 18.68
42.80 14.47
Piecewise logwarping 36.89 17.44
Melwarping
Barkwarping
ERBwarping
38.67 17.01
41.88 15.71
42.85 15.18
Inference: Performance of warped features are better than MFCC .
Log > ERB> Bark > Mel > Piecewise-log > MFCC
13
Experimental Results on TIDIGITS
TIDIGITS := Texas Instruments digit database.
zero (0), one (1) , … nine (9).
20 speakers.
Total ~200 instances.
Table . % Precision and % Equal Error Rates (EER) Obtained by Different Feature Sets (in %) for TIDIGITS Database. Feature Set
MFCC
Logwarping
Precision EER
49.48 24.59
54.46 21.33
Piecewise logwarping 55.59 19.57
Melwarping
Barkwarping
ERBwarping
52.38 21.11
56.53 19.19
56.65 19.11
Fig. : DET curves for template matching experiments for TIDIGIT database.
Inference: Performance of warped features are better than MFCC .
14
Conclusions
VTLN via universal warping. Different non-uniform frequency warping functions. Performance for template matching task. Warping based feature improves the performance. Future work: perform the analysis on large dataset and noisy channel condition.
Acknowledgements
Department of Electronics and Information Technology (DeitY), New Delhi, India.
Dhirubhai Ambani Institute of Information and Communication Technology, Gandhinagar .