Water Monitoring System using Wireless Sensor Network (WSN): Case Study of Kuwait Beaches Abdulrahman Alkandari Computer Engineering Kuwait University Kuwait
[email protected] om
Meshal alnasheet
Yousef Alabduljader
Samer M. Moein
The Higher Institute of Telecommunication and Navigation PAAET Kuwait
[email protected] m
Computer Engineering Kuwait University Kuwait
[email protected]
Computer Engineering Kuwait University Kuwait
[email protected] m
Abstract—Firstly it is needed to realize Wireless Sensors Networks (WSN); we can define it as the most important technologies in the new century. during the last decades there was many achievements especially in the field of micro sensor technology and the low power electronics have made WSNs and the reality of applications, WSNs enabled a great amount of the surveillance and supervision applications, especially for the hostile and the critical environments, such as the process of monitoring the sea. We are presented software and hardware platforms of the augmented sensor networks which should be connected in a temporal way to the back-end infrastructures to store the data storage and the interaction of the users, and it make a special use for the actuators or the devices which are considered a rich and special computing resource to manage a complex signal processing tasks. In our proposed solution, we attempt to deploy the sensors of the network which is used on the sea surface shall monitor the water characteristics such as temperature, PH, dissolved oxygen, etc., and provide various convenient services for end users who can manage the data via a website with spreadsheet from a long distance or applications in a console terminal. This project introduces the architecture of a WSN system, the hardware of the node, data acquisition, data processing with gateway, and data visualization. The schemes which are considered traditional one depend on the intensive work of the labor and the expensive hardware. We presented better solutions with special sensors to measure the characteristics of the water in Kuwait. Keywords- wireless sensor network (WSN).
I.
INTRODUCTION (HEADING 1)
Water covers about 71 percentage of the earth surface’ and this percentage is considered three-quarter of the area, so it observed in a continuous way to realize the pollution rates and the climate changes of the environment which affects the human and the habitation of the animals nowadays the scientists had used the methods that are expensive in its cost and the time and they won’t allow the demanded great areas which taken as sample or the high resolution of the measuring grid. In the project which we are discussing now, we had emphasized the advantages of WSNs, when we had managed the scientific study fir the ocean and the sea, we had pointed
978-1-4673-1107-6/12/$31.00 ©2012 IEEE
out to the differences between the terrestrial WSNs and the proposed applications. The WSN formed from a lot of sensor nodes, and every node contains a special processing unit, memory, transceiver, battery, and the sensors. There are many researchers had discussed the utilization of the oceans WSNs is considered one of the great studies which deal with this matter. One and other scientists had described the WSN which is distributed in a random way over the lake reservoir done their best and they measure the p.H values with the magnetic elastic sensors, thus we ensure the drinking water in a safe way. There is another issue had been discussed by Dunkel and his friends who had used the sensor networks to monitor the temperature of the water, salinity and reduce of marine cost [10]. There are some of advances had been in the system of the micro-electromechanical (MEMS) wireless communications, technology and the digital electronics which had enabled the development of low cost, low power, the nodes of multifunctional sensors which are small and un tethered communication tools which used to measure the short distances. These tiny sensor nodes, which consist of sensing, data processing, and communicating components, leverage the idea of sensor networks based on the collaborative efforts of a large number of nodes. A large number of micro-sensor nodes can be used by a WSN to collect high-precision data in various circumstances. Compared with traditional monitoring methods, there are several remarkable advantages to using a WSN to monitor the properties of the environment, such as real-time, ample data, low cost, high effectiveness, and so on. This project proposes a WSN which used for the communication of the correlative real time data that is used to monitor the environment. The system gather some of the predetermined water parameters, like the temperature, PH, dissolved oxygen, nitrate, and ammonia, etc., depending on the zone of deployment such as industrial zones, petroleum refineries, or sanitation. In addition, all collected data can be stored in a SQLite3 database. At the same time, the environment can be monitored and controlled remotely via a website or applications in a console terminal. The next parts of this paper are ordered as follows. Section 2 presents the problem statement. Section 3 briefly describes
10
the related works. Section 4 overviews the network design of our system. Section 5 describes the implementation of system. Section 6 reports the experimental results. Finally, Section 7 concludes the paper with a discussion of future works. II.
PROBLEM DESCRIPTION
We are going to discuss what happened during Sep. and Aug. of 2001, The Kuwaiti Bay, the embayment is enclosed to the Arabian Gulf it is experienced that there is a great fish and those fishes are considered a killer fishes, it is involving more than 2500 metric tonne of the savage mullet, because of the spherical Gram positive bacteria. In the Kuwaiti Bay, this issue had been preceded by the small killing fishes (one hundred to one thousand fish in the day) of podlanica sea bream in the aquaculture net pens which is connected to the bloom of Ceratium furca which is considered one of the species of the marine dinoflagellate. Sea bream had been found and considered a positive culture for the S. agalactiae, but didn’t provide us with any obvious signs of the disease. Uncommonly the temperature of the warm was (more than 35 °C) and the conditions of the calm had been overcome during this time. As the severe kill fish had been progressed, different kinds of the harmful algae were visible for the people, such as the Gyrodinium impudicum, catenatum, Pyrodinium bahamense var and compressum. The number of the Cell especially G. catenatum - G. impudicum had been elevated to reach 1006 l−1 in different positions. All fish tested below the limits of detection for (P.S.P) ‘The syndrome of shellfish poisoning’ and. the Clams were considered positive for the syndrome of shellfish poisoning but at some of the below levels it had a regulatory limits. The inorganic and the organic nutrient concentrations were variable with the time and the location (from place to another) to reflect the inputs from sewage outfalls, the operations of the aquaculture, the high biomass of the disintegrate fish, and other resources. It was hypothesized which there are several factors had participated in the primary outbreak of the disease that leaded from the bacteria, such as the unusual warm and the calm condition. These factors which enriched nutrient condition which appear obviously were conducive to the succeeding H.A.B outbreaks. The detection of P.S.P (The syndrome of shellfish poisoning’), while we found a below regulatory limit, to warrant another monitoring system to let the human health in the safe side to solve such a problem, Kuwait authorities started to monitor the water’s characteristics. The installed solution requires personnel to physically go and take the readings from different places across Kuwait Bay and bring back the data to be processed. Such a procedure is considered to be cost inefficient in terms of effort and time, and human error is strongly involved. Rather than spending hours on training, the team should do the reading tasks. A. WSN in Water Quality A wireless sensor network (WSN) is the system of the autonomous which composed of some of great numbers from the micro sensor nodes which are characteristics by high level of the sensing, and it calculate the communication, this system is low power and low cost. It is considered so smart system which manages different tasks in the monitoring process, as the
978-1-4673-1107-6/12/$31.00 ©2012 IEEE
different conditions of the environment. This system monitors the water environment and the typical application. The system have the ability to compare between the existing real time automatic and the monitoring systems, the WSN based on the environment of the water to monitor and to get the strong points [1]. There is a special need to know the real time of the ground water level and its data to suggest and realize the improvement which happened for the infrastructure to acquire, transfer, and analyzing the data of the real time. The suggested system would meet the following needs [14]: 1.
The Low costs: Great number of locations that is wellknown by its level of the ground water to be measured. It used to deploy the infrastructure on a great scale which requires the cost of the material and the integration ion these places should be low.
2.
The Miniaturization: the environmental deployment which done for the sensors need them to be gathered. The sensing intelligences should be followed on high end integrated circuits to make them compact.
3.
Flexibility: The sensors’ design should be elastic enough to be adapted to the other measurements of the environment.
4.
Scalability: By deploying scalable WSNs in three dimensions the space of the underwater for every sensor shall monitor and recognize the events which done in the environment particularly.
5.
The Modular designs: To enable the use of new technologies in various components (e.g., data acquisition, transfer, and analysis), the design should be modular.
6.
Reliable untethered communication: As the nodes are part of a network, the data transfer must be reliable in the event of node failures.
III. RELATED WORK The goals of MOBESENs’ project had formed a special system and the necessary sensors to enable continuous monitoring of water quality in lakes and at sea. This research presents the innovations of the project in terms of WSN to achieve this goal. After a short description of the project, the research describes the localization and routing protocols specifically designed to support long-term continuous monitoring of water quality [6]. The system includes a smart array of ion-selective field effect transistors (ISFETs) as a front-end and at postprocessing stages in order to transmit the stored measures of ion concentrations. The intelligence in the smart sensors is provided by a blind source separation (BSS) algorithm that continuously learns from measures how to detect the ion concentrations available in the mixed signal observed in the array’s output [2]. In the article, we had demonstrated a special design to monitor the groundwater and its system depending on the wireless networks that is linked to the pressure sensors. The
11
suggested solution shall pave the way for the groundwater researchers and the people who are considered decision makers to make a quick access for the data groundwater with a limited efforts and it takes lower cost. Although our design is related to the groundwater which monitor, it can be adapted to other fields of the environmental monitoring [1]. The divided positioning of the algorithms shall help the remote sensing of the real time for the ocean by using the systems and the applications which provides us with a lot of information about the position of sensors that form the underwater acoustic network under deployment for area identification purposes of the sensed event [11]. This article had demonstrated a specific theory, manufacture, design, experiment, and the evaluation of the smart devices for the enhanced severability of small fractions in the water. The smart equipments take the advantage of the ultrasonic waves [22]. This research describes the crossbreed smart system which is called (SMART Agua), that is targeted to analyze and solve the problems of the water productions in the petroleum wells. There are many innovative techniques had been used like multi set had based on the algebra of the qualitative doubtfulness for the expert’s system and the perception that based on the data mining from the technological frameworks of the developed systems? [19]. The approach of top-down had adopted to explore the research challenges in mobile U.W.S.N designs. Along the layered protocol stack, we proceeded roughly from the top application layer to the bottom physical layer. At each layer, a set of new design intricacies were studied. The conclusion was which building the climbable mobile U.W.S.Ns is a challenge which should be answered by interdisciplinary efforts of auditory communications and the mobile acoustic network protocol designs [5]. The smart thermostat had been furnished with strings for successive long term the temperatures profiling in a great water bodies which is described to allow the highly matched yet lowcost spatial and the temporal measurements [20]. Developed an interface circuit between wireless node and water quality detecting sensor and a solar power system for the water quality WSNs [16]. Implement a hierarchical water quality sensor network structure to reduce the cost of water quality sensor networks and increase the density of the sensor node deployment [23]. The monitoring system of the water environment depend on the W.S.Ns which is containing of three parts: the first part is the nodes which monitoring the data, the second part is the base station which collect the videos, and the last part is the center that is specialized in remote monitoring. in order that, we managed to realize the monitoring process for the wide range waters, the system which is made to monitor the water environment have the ability for perception, processing, acquisition and the transmission of the video in the main places and different parameters of the water environment, like the water temperatures, P.H, dissolved oxygen, the turbidity, electric conductivity etc [14].
978-1-4673-1107-6/12/$31.00 ©2012 IEEE
(Monitoring seabirds in Great Duck Island, monitoring the water quality in Ticino, monitoring the microclimate through redwood trees, street line networks: solving urban parking problems) [9]. The School of Ocean Technology collaborates with the Newfoundland Aquaculture Industry Association to provide the industry with ready access to real-time and archival data on marine environmental conditions in support of sustainable aquaculture production. The project is based in the Coast of Bays region, the frontier of the emerging aquaculture industry on the island of Newfoundland and the center of the rapidly growing commercial salmon aquaculture industry in the Province [4]. It is known that it has been produced an intelligent, innovative system for data collection to manage the requirements of the W.F.D, it is not clear to say that the current systems in the place fulfill the whole requirements of the instructions or the Directive. The project is considered flagship, showcasing the capabilities of native high tech institutes, and it should be salable in the European range to the different agencies which are responsible for the management of water quality which are influenced by the guidelines of W.F.D [18]. This article demonstrate and discuss the novel (A.S.V or Autonomic Surface Vehicles) which is able to navigate in each complex in land water storages and measuring the range of water quality and its properties, it discuss also the greenhouse gas and its emissions. The unique feature of this A.S.V is its integration into a storage scale floating sensor network to let the remote mission uploads, the data downloads, and the strategies of the adaptive sampling [7]. This research proposes a system for WSNs based on environmental monitoring. The system can monitor several environmental parameters, such as underground water level, barometric pressure, ambient temperature, atmospheric humidity, wind direction, wind speed, and rainfall and provide various convenient services for end users who can manage the data via a website from long distance or applications in console terminal [8]. The C.E.N.S.A.M research shall improve the sensor networks which penetrate the environment to gather the data on the parameters ranging from the urban conditions for the atmosphere to the marine water quality, and we use this information to improve the accurate and the realistic models for the process of environment. Much of the researches had been done in the laboratories at the intelligent centre that is located on the campus of the National Uni. of Singapore [21]. And these researches were aiming to find and explore the chance of deploying the sensors on the surface of the sea to monitor the sea depth, temperature, and other important parameters in the environment with the floating sensors. To address the problem of node localization on the critical sea environment, it proposes (P.I) or the Perpendicular Intersections, the novel of the mobile which prove the localization scheme [15]. This paper emphasizes the advantages of WSNs in oceanography; it points out differences to terrestrial WSNs and suggests applications. In many researches, we can notice that
12
the use of oceanic W.S.Ns is discussed to see the WSN which is distributed randomly over the lake or the drinking water reservoir which measures the P.H values with the magneto elastic sensors and it ensure the safety for the drinking water. The new approach is to verify the advantages of WSNs in oceanography to meet the main objectives: eutrophication, hydrography, and detection of pollution [10].
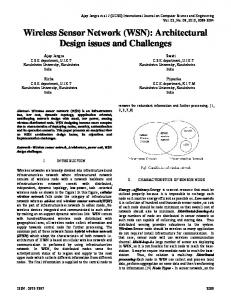
mote type) at each small sensor node, as shown in Figure 1. In each sensor node, we integrate three different sensors to sense three parameters (i.e., one temperature sensor, one dissolved oxygen sensor, and one PH sensor). The SquidBee transmit these values using low-power consumption wireless technology (ZigBee). The cluster head node has a high-capacity solar panel and 4-5 accurate commercial sensors and uses a powerful longdistance 802.11 Ethernet radio for data transmission.
IV. WATER MONITORING SYSTEM NETWORK DESIGN In this section, we introduce the design of our network and its implementation. On our geographic map, we divide it into zones, as shown in Figure 1. In each zone, we deploy a set of fixed sensors nodes that measure what we seek by utilizing data aggregation and maximizing the network’s lifetime. We minimize the cost of mobility by depending on fixed topology to build our network; we need to divide the set of nodes in each zone into many clusters to simplify the communication between each set.
The whole zone network is divided into several clusters based on signal strength. Each cluster has a head node and the cluster nodes to send the data for the cluster head node. The clusters head some of nodes to send the collected data to the gateway (computer USB connected receiver).
We divided the sensor nodes into two categories: sensor node (SN) and cluster head (CH). Sensor nodes are responsible for sensing and transmitting the data to a cluster head. When a cluster head receives data from any node, it retransmits this data to a gateway. End users, who have the right to access the gateway, with access it and retrieve all data aggregated on it.
a) Configuring the SquidBee mote and the gateway We downloaded the Arduino-0018 software from the Internet. Arduino is considered one of the physical and open sources for computing the platform depending on the simple I:O board and the development of environment which execute the Wiring language. Arduino shall be used to improve the stand alone interactive objects or it shall be linked to the software on the PC (for example: Processing, Flash and MaxMSP). b) Programming the mote nodes to send the sensor readings This is the standard code written by C-language to send the sensors’ readings to the gateway with our modification for labeling the readings and calculating the actual value. In Fig 2 shows, the flow chart for the main program which built in the Arduino platform. In the communication process, used for analyzing and processing the gathering data then produce the connected data alarm. In the data protocol processing, is used to recognize protocol processed for ZigBee [14].
Sensor power on
Initialization / Declaration
Figure 1. Network Architecture for Water System
V.
CDMA Communication ZigBee Communication
IMPLEMENTATION
This project focuses on water quality monitoring with inexpensive sensor nodes using a hierarchical communication structure. Therefore, a large number of the sensor nodes can be deployed to cover a large monitoring area with enough density. The main purpose of this research is implementing a hierarchical water quality sensor network structure to reduce the cost of water quality sensor networks and increase the density of the sensor node deployment. The sensor network consists of a set of clusters, and each cluster has one cluster head and a number of small sensor nodes. We use the SquidBee technology (an open hardware and source wireless sensor device). The main idea behind SquidBee is that it is self-powered, so we implement SquidBee (sensor
978-1-4673-1107-6/12/$31.00 ©2012 IEEE
Gobetwino Communication
Data Processing
Figure 2. Flow chart of built in program
c)
Using the Gobetwino Application
Gobetwino is a “generic proxy” for Arduino. It is the program which running on the P.C which acts for Arduino and it is does some of changes for the things which Arduino can’t do it alone. This is the place to watch for updates and
13
information. Gobetwino isn’t restricted to work with Arduino, as the port used for a serial connection configured so it work with most important equipment which send and get the strings by the serial line. Gobetwino listened on the port for “the commands” which come from Arduino to replay on it. Arduino maybe receive another message from it. Gobetwino define the group of command types which is used as templates to make actual commands. Arduino ask Gobetwino to manage these commands to return the things for Arduino. As shown in Fig 3, we use the following algorithm to send the retrieved data to an Excel spreadsheet and plot the readings in the line chart in automated fashion. This program easily catches the faults by using a line chart on the Excel spreadsheet, so it can improve the monitoring of the problem. In the flowchart there are two loops. The first one is configuring the sensor nodes with the Excel software to be ready getting the data. The second loop reading the receiving data from the sensor and converted into line chart.
Start
VI. EXPERIMENTAL RESULT Our experimental result depending on two factors the y-axis is temperature degree on Celsius and x-axis is the time of data receiving from wireless sensor on the water pool which represent 5 Sec for each number. It is represent as a line chart on the excel sheet which is most appropriate approach of exposed the result and detect the problem easily. In all figures 4, 5, 6, shows the flow of the data receive from the SN and how the temperature can change in real time period. The normal temperature of the water in the pool is 25 °C as mention in Fig 4, the line chart is horizontally on 25 until number 13 on x-axis which mean t= 13*5= 65 Sec. In fig 5, shows vary of the temperature degrees with pouring a hot water. The line chart increases sharply so it reachs 80 °C within 15 Sec. In fig 6, after putting some ice on the same pool the sharp decrease line get to 35 °C. The data result printing on every 5 sec the temperature of the water so we can get the result in faster way but in real life experiment should be less to save the power consumption of the sensor nodes floating on the beach. Our experiment shows the capable of receiving data result in real time within seconds and differ of the temperature that’s mean it is appropriate for using on real life cases.
Variables declaration (sensor types) + other initialization
Start Excel and wait 5 sec. maximum for answering from Gobetwino (process ID)
Convert the result into integer by read a string from the serial and store it in an array
Send the data to Excel
Read the two pot values – could be any sensor value
Figure 4. The result with normal water temperature
Send the values as though it was typed into Excel, using the SENDK command
Print the total line that is send and wait 2 sec. for saving data wait up to 1 sec. for answering from Gobetwino, answer will be in serInString, answer is 0 if all is OK send the 2 pot values 15 times, so save and close the XL sheet.
End of Program
Figure 5. The result for normal water temperature after pouring a hot water
Figure 3. Flow chart for writing and plotting the data in Excel sheet algorithm
978-1-4673-1107-6/12/$31.00 ©2012 IEEE
14
[8]
[9]
[10]
[11]
Figure 6. The result for hot water temperature after putting some ice
VII. CONCLUSION AND FUTURE WORK In our project, we showed how to automate the process of getting the water qualities readings with a WSN system. Our system is cost efficient in terms of manpower, time consumption and budget. Using this project will give the readings for different parameters depending on the type of sensors and program coding. The proposed system can be deployed in Kuwait Gulf waters and sewerage. This work will be continued by studying the problem statements on pollution for each situation and how to solve them by simulating different projects for each one of them.
[12]
[13]
[14]
[15]
[16]
REFERENCES [1]
[2]
[3]
[4]
[5]
[6] [7]
Anumalla, S., Ramamurthy, B., Gosselin, D. C., & Burbach, M. (2005, 22-25 May 2005). Ground water monitoring using smart sensors. Paper presented at the Electro Information Technology, 2005 IEEE International Conference on. Bermejo, S., Bedoya, G., Parisi, V., & Cabestany, J. (2002, 5-8 Nov. 2002). An on-line water monitoring system using a smart ISFET array. Paper presented at the IECON 02 [Industrial Electronics Society, IEEE 2002 28th Annual Conference of the]. Beutel, J., Kasten, O., Mattern, F., Römer, K., Siegemund, F., & Thiele, L. (2004). Prototyping Wireless Sensor Network Applications with BTnodes Wireless Sensor Networks. In H. Karl, A. Wolisz & A. Willig (Eds.), (Vol. 2920, pp. 323-338): Springer Berlin / Heidelberg. Cater, N. E. (2008, 15-18 Sept. 2008). Smart ocean Sensors Web Enabled ocean sensors for aquaculture. Paper presented at the OCEANS 2008. Cui, J. H., Kong, J., Gerla, M., & Zhou, S. (2006). The challenges of building mobile underwater wireless networks for aquatic applications. Network, IEEE, 20(3), 12-18. Dallemagne, P., Piguet, D., Restrepo, A., & Sénéclauze, M. (2002). WSN mobility support for Long Term Water Monitoring. Dunbabin, M., Grinham, A., & Udy, J. (2009). An autonomous surface vehicle for water quality monitoring. Robotics and Automation (ACRA), 13.
978-1-4673-1107-6/12/$31.00 ©2012 IEEE
[17] [18]
[19]
[20]
[21]
[22]
[23]
Dunfan, Y., Daoli, G., & Wei, W. (2009, 19-20 Dec. 2009). Application of wireless sensor networks in environmental monitoring. Paper presented at the Power Electronics and Intelligent Transportation System (PEITS), 2009 2nd International Conference on. Floros, A., Huang, C., Dogan, G., Bahader, M., Sun, T., & Cao, Z. (2008). Online Water Monitoring Using Wireless Sensor Networks Communication System Design. Frank Reichenbach , M. H., Dirk Timmermann (2005). Monitoring the Ocean Environment with Large-Area Wireless Sensor Networks Paper presented at the 8th EUROMICRO Conference on Digital System Design. Garcia, J. E. (2005, 2005). Positioning of sensors in underwater acoustic networks. Paper presented at the OCEANS, 2005. Proceedings of MTS/IEEE. Glibert, P. M., Landsberg, J. H., Evans, J. J., Al-Sarawi, M. A., Faraj, M., Al-Jarallah, M. A., et al. (2002). A fish kill of massive proportion in Kuwait Bay, Arabian Gulf, 2001: the roles of bacterial disease, harmful algae, and eutrophication. Harmful Algae, 1(2), 215-231. doi: 10.1016/s1568-9883(02)00013-6 Klein, C., & Kaefer, G. (2008//). From Smart Homes to Smart Cities: Opportunities and Challenges from an Industrial Perspective Next Generation Teletraffic and Wired/Wireless Advanced Networking. In S. Balandin, D. Moltchanov & Y. Koucheryavy (Eds.), (Vol. 5174, pp. 260-260): Springer Berlin / Heidelberg. Kong, Y., & Jiang, P. (2008, 29-31 July 2008). Development of Data Video Base Station in Water Environment Monitoring Oriented Wireless Sensor Networks. Paper presented at the Embedded Software and Systems Symposia, 2008. ICESS Symposia '08. International Conference on. Liu, K., Yang, Z., Li, M., Guo, Z., Guo, Y., Hong, F., et al. (2010). Oceansense: monitoring the sea with wireless sensor networks. ACM SIGMOBILE Mobile Computing and Communications Review, 14(2), 7-9. Liu, X., Wang, H., Li, S., Ruan, Y., Ai, T., & Mansoor, A. (2007). Project Plan for the Hardware Circuit Design of the AquaWSN (Vol. Version 1.1): System-on-Chip Design, KTH. McPherson, B., Senden, D. v., & Hesse, S. (2006). Recent Advances In The Technology And Monitoring Of Water. Regan, F., Lawler, A., & McCarthy, A. (2009). SmartCoast ProjectSmart Water Quality Monitoring System: Environmental Protection Agency, Ireland. Sheremetov, L., Batyrshin, I., Cosultchi, A., & Martinez-Munoz, J. (2006, 0-0 0). SMART-Agua: a Hybrid Intelligent System for Diagnosis of Water Production Problem. Paper presented at the Intelligent Engineering Systems, 2006. INES '06. Proceedings. International Conference on. Skinner, A. J., & Lambert, M. F. (2006). Using Smart Sensor Strings for Continuous Monitoring of Temperature Stratification in Large Water Bodies. Sensors Journal, IEEE, 6(6), 1473-1481. WHITTLE, A. (2009). CENSAM and Singapore’s Environment An international research programme seeks to understand interactions between Singapore and the surrounding environment. C o v e r S t o r y, Vol. 9, 35-39. Young-Sup, L., Dong-Jin, Y., Jaehwa, K., & Dae-Cheol, S. (2005, 18-21 Sept. 2005). Smart separation devices for particle concentration in water using ultrasonic standing wave. Paper presented at the Ultrasonics Symposium, 2005 IEEE. Zhang, F. (2007). Underwater Sensor Networks for Water Quality Monitoring project progress report.
15