Jan 14, 2018 - anthropoid beings, monitoring the situation of patients body and ... The main operation of a blood pressure sensor is the determination of a ...
Int. Journal of Engineering Research and Application www.ijera.com ISSN : 2248-9622, Vol. 8, Issue 1, ( Part -IV) January 2018, pp.04-11 RESEARCH ARTICLE
OPEN ACCESS
Health Monitoring System Using Wireless Sensor Network 1
Sharanbasappa Sali, 2Dr. Parvathi C. S.
1
Assistant Professor, E &CE Dept, Basavakalyan Engineering .College, Basavakalyan ,India Professor & Chairperson, Dept. of Inst. Tech. Gulbarga University P.G. Centre, Yarigera, Raichur, India. Corresponding Author: 1Sharanbasappa Sali 2
ABSTRACT This paper proposes an efficient approach to monitor the illness of the patient during the check up condition. Now a days medical equipments help the patient monitoring; also avoid lot of risk by doctor‟s in ICU. These medical sensors are tattered on the wrist and finger to monitor the patient‟s condition. These medical sensors will sense the condition of patient‟s body and collect the data from patient body and send a message via Global System Mobile device to concern person or doctors. These data are communicated via ZeeBee wireless device. The sensors used are ECG (AD8232) sensor and blood pressure sensor. Signals are obtained and are displayed using Arduino Uno board. Body blood pressure is displayed on serial plot and ECG signal is monitored on PC through MATLAB, if the irregularities in the measured variables are noticed, a message alert will be sent to the medical staff. Keyword: Arduino board, ECG (AD8232) sensor, Blood Pressure sensor, ZigBee and GSM moduleMGSM900 ----------------------------------------------------------------------------------------------------------------------------- ---------Date of Submission: 14-01-2018 Date of Acceptance: 27-01-2018 ----------------------------------------------------------------------------------------------------------------------------- ----------
I. INTRODUCTION The invention and science related to Wireless Sensor Communication device is a vast popular technology. There are many people doing researches in this field of medical measured-data acquisition equipment for monitoring and diagnosis, in particular to ECG (AD8232) sensor and blood pressure sensor, additionally to potential for managing the inspiration, the body condition and for storing electric potentials or (electrodermal) electromyography pursuit such as the skin response. Health care tracking system will monitor the patient continuously and simultaneously transmit the physiological data to the doctors and to other medical staff. Such monitoring, diagnostic device and sensor is used mainly in hospitals and in the examination of patients‟ health condition. Wireless sensors make the things easier and extra suitable than wired sensors to detect patient movements and collect data. Wireless device consist of various devices which can interface with each other. In this research, a wireless system is developed, which includes a sensor and a receiver device. The sensor fork contains an electronics sensing device with any sensors that are needed for capturing the desired data. The receiver device contains a finale user appliance to receive the data that the sensor device can detect and collect. Arduino is used to command the sensors as a microcontroller and here ZigBee modules are used to transfer data between the sensor device and the receiver device. During its field experiments, these sensor devices are tied on the waist and wrist of a patient.
www.ijera.com
For the software development of this wireless sensor system, MATLAB is used for graphic user communicate to produce a smooth curve graph while receiving the real time data. Hence a communication is setup between two ZigBee modules by using MATLAB and Arduino board. Consequently, by combining the software development and the hardware programming on a wireless device an effective wireless device network is obtained that can help with such situations. These apparatus can assist to give carer real-time entry to correct patient information, clinical histories, treatments, medications, tests and lab results, insurance information etc.
II. REVIEW OF EARLIER TECHNIQUES Now a days wireless communication device are more helpful to human being, some people use RFID, Bluetooth, ZigBee and wireless device network which gives innovative medium for data transmission for medical applications. This section of the paper highlights on current uses of various wireless communications in healthcare domain. This work also proposed a distance health tracking system built on the ZigBee Wireless Communication System and MATLAB software. Amna Abdullah et.al [01] has proposed a system, which can monitor ECG signals, temperature and heartbeat of a patient from a remote location. Here it connects the sensors attached with the patient‟s body to a transmitter unit related with a ZigBee or GSM module. The transmitter communicates the data
DOI: 10.9790/9622-0801040412
4|Page
Int. Journal of Engineering Research and Application www.ijera.com ISSN : 2248-9622, Vol. 8, Issue 1, ( Part -IV) January 2018, pp.04-11 wirelessly to a receiver that is also related with a ZigBee or GSM module. The receiver is connected directly to the serial port of a local monitoring unit (which is a system with MAT LAB software in it). The local monitoring unit displays the final data. A huge number of other applications of using wireless device communication with Arduino and ZigBee have been developed. Ye Wang [02] introduced data fusion which can decrease power consumption by testing a device that is built on microcontroller and ZigBee. As they discussed, a typical Arduino-ZigBee can be treated as the microcontroller-RF module. Eight bits can stand for both Arduino serial input/output command and ZigBee frames. Their testing device, which consists of a controller board, a ZigBee and two sensors, is contemplated as the sensor node. The two kinds of sensors are an integrated sensor for ECG (AD8232) sensor and blood pressure sensor. They are used for creating data and their data types are categorized as double with precision point. They performed some experiments and analyzed the fact-finding data to conclude that the data fusion method is beneficial for reducing data size. Emmanuel Kobina et.al [03] proposed a work which describes the wireless sensor communication system built on ZigBee and GSM programme. It is mostly used for assemble and transmitting the various monitoring information or physiological parameters using ECG sensor, blood pressure sensor about the patients in hospital or in their houses to allocate the doctor or practitioner. Here the patient‟s are tracked by sensors and the output of these devices are communicated via Zigbee-GSM communication medium and the same has to be redirected to the remote wireless monitor for acquiring the observed patient‟s physiological signal. U. Anliker et.al [04] described a Wireless device Communication and attentive system selecting high danger respiratory patients. The system builds on constant collection and rating of multiple essential signals, brilliant multi-variable medical crisis detection and a mobile connection to a medical centre. These are finger and wrist-worn enclosure and these are operated on low power design system. Design techniques, continuous, lengthy tracking can be executed without connecting with the patient‟s day-by-day job and without controlling their potency. Sheng Hu [05] developed a body wireless sensor communication solution for individual healthcare under a home environment. The system is efficient of logging the physiological signs of anthropoid beings, monitoring the situation of patients body and monitoring the environmental attributes, which covers all imperative statistics for the individual healthcare in an indoor territory. The early techniques reveal that most of the work is done on designing the wireless body sensors and its application, with single parameter monitoring
www.ijera.com
and processing for short durations. So for ICU patients and also for post operative patients the continuous monitoring is required. For continuous monitoring there is large power consumption. This has motivated us to design and develop the integrated wireless instrument for ECG and blood pressure. To have continuous monitoring and also for more physiological parameters, data acquisition and signal conditioning with low cost, less power consumption, miniature instruments are needed in the biomedical field.
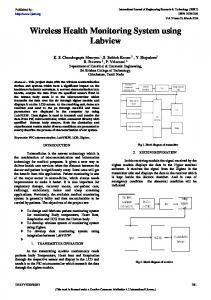
III. METHODOLOGY In design of wireless sensor communication device the first constraint is the selection of a ZigBee and Arduino Uno that can interface with further and sensor can test the patient‟s body with the lowest power. Once a communication is done transmitter ZigBee transmits the data and receiver ZigBee receives the data. The devices used are low-cost and are effortless to use by the patient [6]. All the components used in these circuits are low powered and inexpensive. The overall proposed block diagram of the model is as shown in fig. 1. This module has wireless communication device and sensor devices like ECG (AD8232) sensor [7] and blood pressure sensor. Both sensors are connected to ZigBee via Arduino board. This paper reports the implementation of ECG signal tracking system and this system recognises the ECG signals in real-time. In general, heart disease can be identified as unusual heart rate, whereas, normal resting condition range from 60 to 101 beats per minute and ECG signal characterises a beat detection and other features [8]. It considers basic reliable ECG device is a crucial portable device and will be extensively used in the expectation for early finding cardiovascular disease [9]. The main operation of a blood pressure sensor is the determination of a person‟s blood flow. Blood movement is the blood capacity that moves along any tissue in a decided interval of time in sequence to show tissue oxygen and nutrients transported in blood [10]. This system is able to acquire and show the patient‟s real time electrocardiogram (ECG) data [11] and also blood pressure. Patient data received from this system can be further used for analysis of irregular heart rate and new clinical applications. System hardware comprises of an electrode, as a part of signal input, signal conditioning components for manipulating signal, the microcontroller unit to execute signal processing and wireless communication module. Blood pressure tracking action is built on the oscillometric method [12]. This technique gives the pulse taken during calculation; an occluding cuff is put on the left arm and is interfaced to an air pump and a pressure sensor [13]. The air will be pumped into the cuff to be around 20 mmHg above average systolic pressure (about 120 mmHg for an average) systolic
DOI: 10.9790/9622-0801040412
5|Page
Int. Journal of Engineering Research and Application www.ijera.com ISSN : 2248-9622, Vol. 8, Issue 1, ( Part -IV) January 2018, pp.04-11 value is extended and then the cuff is steadily collapse. As the cuff collapse, when systolic force value near, pulse start too visible. These pulses represent the force changes because of heart ventricle contraction and can be used to measure the heartbeate, pulses increase in amplitude until mean arterial force is extended, then reduces until they vanish.
The signals want to be amplified before it enters a fitting microcontroller which executes further processing in sequence to calculate ratios of the signals and compares with approach utility for danger level [14]. This desired parameter is then displayed in a monitor via software MATLAB to record blood pressure and ECG signal, in actual time to apparatus the ECG and blood pressure tracking system. Zigbee Transmitter
WPAN
ECG sensor Arduino Board
Patient
BP sensor Signal processing Unit
Transmitter Receiver Data analysis No Alert the Doctor by sending a data to PDA
GSM
If data is more or less than preset value
server
Yes
Zigbee Receiver
Figure 1: Block Diagram of Proposed System 3.1 ECG (AD8232) Sensor ECG signal tracking system made up of two sections [15]. Signal input (Electrode) shown in figure 2, signal amplified circuit and computer software.
positioned on the right arm „R‟ (negative pole), left arm „L‟ (positive pole) and the mention of electrode (F lead) is positioned on the left front „F‟ (a signal ground connection) or relatively positioned on the left arm. These are three configurations of the ECG tracking system: namely, lead I, II and III, to perceive the projection of ion moving vectors flow from the (-) ve pole to the (+) ve pole, ECG tracking system was used lead II placement. The relationship between lead I, II, and III order can be communicated as: Lead I + Lead III = Lead II (1) where lead I, II, and III are the lead voltages as maintained by to Kirchhoff‟s law defined on the Einthoven calibre limb leads (bipolar) [17]. In this module three bipolar limb leads are preferred, which are represented as I, II and III. The voltage signal values at each lead are computed by using below Eq. (1), (2) and (3).
Figure 2: Signal Input (Electrode). Heart muscle is measured by placing an electrode at outer exterior of the skin. They are three electrodes, those are having different colours. The shade coded electrode has the names R, L and F depicts right, left and front by putting on patients body, this is also called as “ECG lead” as the heart performing of its function to pump the blood through the circulation system. Electrode is used for recognizing bioelectrical potential caused by muscle cells [16]. The ECG lead is anticipated to detect the movement of ion vectors in particular direction between two points on the exterior of the skin. This is a differential measurement of the value difference projected across the heart. For this work, electrocardiogram monitoring system is focused on the lead II (R, L lead) configuration concerning completed combinations of electrodes
www.ijera.com
𝐿𝑒𝑎𝑑 𝐼 = 𝑉𝐿𝐴 − 𝑉𝑅𝐴 𝐿𝑒𝑎𝑑 𝐼𝐼 = 𝑉𝐿𝐹 − 𝑉𝑅𝐴 𝐿𝑒𝑎𝑑 𝐼𝐼𝐼 = 𝑉𝐿𝐹 − 𝑉𝐿𝐴
1 (2) (3)
Where the each electrode signal i.e. from left, right and foot value is recorded in a variable𝑉𝐿𝐴 , 𝑉𝑅𝐴 𝑉𝐿𝐹 . The above equation denotes the Einthoven bipolar limb lead connections, using mentioned three limb leads; we can change the positioning of leads to collect unipolar limb leads values. These values are also termed as augmented limb lead values they are computed as 𝑉𝐿𝐴 + 𝑉𝐿𝐹 𝑎𝑉𝑅 = 𝑉𝑅𝐴 − (4) 2 𝑉𝑅𝐴 + 𝑉𝐿𝐹 𝑎𝑉𝐿 = 𝑉𝐿𝐴 − (5) 2 𝑉𝐿𝐴 + 𝑉𝑅𝐴 𝑎𝑉𝐹 = 𝑉𝐿𝐹 − (6) 2
DOI: 10.9790/9622-0801040412
6|Page
Int. Journal of Engineering Research and Application www.ijera.com ISSN : 2248-9622, Vol. 8, Issue 1, ( Part -IV) January 2018, pp.04-11 Table 1: Pin Function Descriptions These computed values give more significant and relevant information about electrocardiogram. Typically, ECG signal obtained from an electrode is of very small amplitude and ranged around ±2mV, is an extremely weak signal. Thus, an accurate amplification of ECG signal is a crucial practice and required to further analysis and displaying a proper ECG waveform. Moreover the CMRR of electronic amplifier is required as a high ratio to reject an undesired input signals from the lead input of ECG signal. For this reason, the AD8232 instrumentation amplifier has been selected and used in this study and improved about 1,000 times of original signal and received an accurate ECG data for displaying unit [18]. The pin diagram of AD8232 is shown in figure 3 (a) and its circuit diagram is shown in figure 3 (b).
Figure 3: (a) Pin Diagram; (b) Signal Amplified Circuit. The internal circuit structure of AD8232 IC is shown in figure 4. Its each pin description is explained in table 1. Interfacing ECG (AD8232) sensor with Arduino Board, the circuit connections are made as follows: Pin 11 of the ECG board goes into INPUT (10 pin) of the Arduino. Pin 12 of the ECG board goes into INPUT (11pin) of the Arduino. Pin 16 of the ECG board goes into ground (GND) of the Arduino. Pin 17 of the ECG board goes into +5V of the Arduino. Pin 19 of the ECG board goes into OUTPUT (A1) of the Arduino.
Pin No. 01 02
Mnemonic
Description
HP drive +IN
03
-IN
04
RLDFB
05 06 07 08 09 10 11 12 13 14 15 16 17 18 19
RLD SW OPAMP+ REFOUT OPAMPOUT LODLOD+ 𝑆𝐷𝑁 AC/𝐷𝐶 FR GND +Vs REFIN IAOUT
20
HPSENSE/ EP
High pass drive output, Instrumentation amplifier positive input. +IN is typically (LA) electrode. Instrumentation amplifier negative input. −IN is typically (RA) electrode Right leg drive feedback input. Right leg drive output. Fast restore switch terminal. Op-amp non inverting input. Reference buffer output Op-amp inverting input. Operational amplifier output. Leads off comparator output. Leads off comparator output. Shutdown control input, Leads off mode control input Fast restore control input, Power supply ground. Power supply terminal. Reference buffer input, Instrumentation amplifier output terminal. High-Pass-Sense input for instrumentation amplifier/ exposed pad connect exposed pad to ground or level it unconnected.
3.2 Blood Pressure Sensor Blood pressure is the pressure of blood opposed to the separator of arteries. Blood pressure is noted as two numbers i.e. the systolic force over the diastolic force, calculation is written one above or before the other, with the systolic number on top and the diastolic number on the bottom [19]. For example, a blood pressure calculation of 120/80 mmHg is communicated verbally as "120 over 80 [20]. The overall circuit kit for blood pressure measurement is shown in figure 5.
Figure 5: Blood pressure Kit. Figure 4: AD8232 inside IC Circuit.
www.ijera.com
DOI: 10.9790/9622-0801040412
7|Page
Int. Journal of Engineering Research and Application www.ijera.com ISSN : 2248-9622, Vol. 8, Issue 1, ( Part -IV) January 2018, pp.04-11 A further methodical new algorithm of recognizing systolic and diastolic pressure of patient body with a absolute collection of powerful userfriendly embedded programmable blood pressure tracking system has been suggested in this paper to decrease the overall workload of medical staff and also to track patient's condition more conveniently and accurately. Available instrument for calculating blood pressure have some difficulty and restriction in case of both analog and digital instrument. The sphygmomanometer, being analog device, is still being used widely due to its reliability and accuracy over digital ones. As it is known that the blood flow in arteries creates the pressure, this pressure generally measured as mean arterial pressure (MAP) [21]. This mean pressure value is computed by using cardiac output (CO), vascular resistance (SVP) and venous pressure (CVP). The mathematical relation between above parameter is defined as 𝑀𝐴𝑃 = 𝐶𝑂 × 𝑆𝑉𝑅 + 𝐶𝑉𝑃
(7)
Usually venous pressure is close to 0 mmHg, than above can be written as 𝑀𝐴𝑃 = 𝐶𝑂 × 𝑆𝑉𝑅
(8)
These equations explain the theoretical concepts related in blood pressure measurement in practical the mean arteries pressure can be calculated as 1 𝑀𝐴𝑃 ≅ 𝑃𝑑𝑖𝑎𝑠 + 𝑃𝑠𝑦𝑠 − 𝑃𝑑𝑖𝑎𝑠 (9) 3 Where 𝑃𝑑𝑖𝑎 𝑠 and 𝑃𝑠𝑦𝑠 are systolic and diastolic pressure values. The collected blood pressure signals are small in strength hence there is a need to design an amplifier circuit. The respective internal structure of sphygmomanometer amplifier is shown in figure 6 [22]. It needs an experienced person to calculate the blood pressure and it is not live automated and also time consuming. This advanced system includes a microcontroller built on embedded system. It has lead of the accessible digital blood pressure machines also with an abundant improved form and has higher accuracy at the identical time. This system can also be communicative with computer between serial port/USB to produce the calculated blood pressure information on the LAN or internet.
Considering above analog circuit the resultant DC voltage of the pressure transducer can be calculated as 𝐷𝐶𝑉𝑜𝑙𝑎𝑡𝑔𝑒 𝑃𝑟𝑒𝑠𝑠𝑢𝑟 𝑒𝑣𝑜𝑙𝑎𝑡𝑔𝑒 = (10) 𝐷𝐶𝑔𝑎𝑖𝑛 Where 𝐷𝐶𝑉𝑜𝑙𝑎𝑡𝑔𝑒 is available digital output at A-to-D converter and amplifier gain is denoted by 𝐷𝐶𝑔𝑎𝑖𝑛 . Using sensor transfer characteristic „slope‟ value is computed, after computing slope the respective pressure in kPa is determined as 𝑃𝑟𝑒𝑠𝑠𝑢𝑟𝑒𝑘𝑃𝑎 =
𝑃𝑟𝑒𝑠𝑠𝑢𝑟𝑒𝑚𝑚𝐻𝑔 = 𝑃𝑟𝑒𝑠𝑠𝑢𝑟𝑒𝑘𝑃𝑎 ×
www.ijera.com
760𝑚𝑚𝐻𝑔 101.325𝑘𝑃𝑎
(12)
Using listed mathematical modules an instrument can be programmed to control the patient's blood pressure after every one definite meantime in a graphical form [23]. To sensation the force of patient‟s body, a force to voltage transducer is used through with a cuff in our system. Throughout the blood pressure calculation cycle, the product voltage of the transducer is held by the fixed ADC of microcontroller after an amplifier stage. The noted data are then managed and scanned using the powerful software procedure to control the blood pressure of the person under test. The future system is thus anticipated to definitely increase the existing blood pressure tracking system by providing precision, time efficiency, user-affection and at last but not the minimal the 'good process of tracking patient's condition under fault-finding care' all cooperatively at the identical time. While data analysis the difference category of the blood pressure signal listed in table 2 is compared with received data for decision purpose [24]. Table 2: Blood pressure signal categories No. 1 2
4
of
(11)
In medical field the blood pressure is measured in mmHg unit, hence above equation can be converted into an mmHg by using below Eq. (12).
3
Figure 6: Schematics of internal structure sphygmomanometer amplifier Analog Circuit.
𝑃𝑟𝑒𝑠𝑠𝑢𝑟𝑒𝑣𝑜𝑙𝑡𝑎𝑔𝑒 𝑠𝑙𝑜𝑝𝑒
BP in mmHg 90/60 or less more than 90/60 and less than 120/80 More than 120/80 and less than 140/90 More than or equal to 140/90
Category Low Blood Pressure Healthy(normal) Try to lower blood pressure High blood pressure
These collected sensor data i.e. ECG and blood pressure values are preprocessed by using Arduino based signal processing unit [25]. The processed digital values are transmitted to base server using zigbee wireless communication technology [26]. At the base station the assembled ECG and blood pressure data is analyzed by the clinical specialist, in case the received data exceed the normal range than emergency signal is activated automatically [27]. Along with emergency signal pre-
DOI: 10.9790/9622-0801040412
8|Page
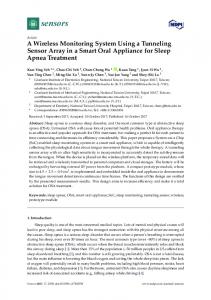
Int. Journal of Engineering Research and Application www.ijera.com ISSN : 2248-9622, Vol. 8, Issue 1, ( Part -IV) January 2018, pp.04-11 stored text message is transferred to the stored number by using GSM technology [28]. The system sensor response of the proposed system is explained in result section. IV. Result The sensor performance of the implemented module is briefly explained in this section. The sensor module includes ECG and blood pressure sensor. ECG sensor setup and its circuit are shown in figure 7. The sensor connection with AD8232 amplifier and Arduino Uno board is as represented in figure 7(a), used three sensor electrodes and their position on the human body is shown in figure 7(b). Proceeding with circuit arrangement measured ECG signal plotted on the serial plotter of Arduino Uno board is shown in figure 7 (c). The captured data is processed further to satisfy the medical requirement levels. Blood pressure is another sensor module used to measure the blood pressure of the human body, the respective sensor module and its circuit connection with Arduino board is represented in figure 8(a). Used pressure sensor connection with the Arduino and physical connection with patient body is depicted figure 8(b). The collected basic blood pressure signal from the controller is shown in figure 8(c). This data is further passed to the filter circuit for better signal analysis. By using wireless zigbee network collected both ECG and blood pressure sensor signal transmitted to the base station. MATLAB tool is used for front end data analysis. Interfaced GSM module is activated in emergency condition i.e. when ECG signal is not performing and blood pressure which lies beyond or less than the normal range. Figure 7 and 8 represent the response of the sensor modules, the overall module is implemented by using cost effective sensor circuits, controller board and communication modules (i.e. Zigbee and GSM) present the best system performance.
(b) ECG electrodes placed on patient's left, right arm and foot
(c ) Captured raw ECG signal
(d) Processed ECG signal Figure 7: ECG Measurement Setup
(a) Blood pressure sensor connection with Android board
(b) BP Measurem ent Unit usage with Patient
(a) ECG electrodes connection with Android board (c) Captured BP Raw Signals Figure 8: BP Measurement Setup
www.ijera.com
DOI: 10.9790/9622-0801040412
9|Page
Int. Journal of Engineering Research and Application www.ijera.com ISSN : 2248-9622, Vol. 8, Issue 1, ( Part -IV) January 2018, pp.04-11 Annals of Biomedical Engineering, Vol. 10(6), pp. V. CONCLUSION The working and design of building wireless communication in health monitoring system is shown in this paper. Here ECG and blood pressure sensors are used to group bioelectric record from patients. The data is then transmitted to the coordinator using ZigBee standard, where it can be observed by the doctors and other medical staff. The developed system is also able of improving the battery life by reducing power consumption during the transmission.
REFERENCES [1] Amna Abdullah, Asma Ismael, Aisha Rashid, Ali Abou-ElNour, and Mohammed Tarique “Real Time Wireless Health Monitoring Application Using Mobile Devices”, International Journal of Computer Networks & Communications (IJCNC), Vol.7, Issue 3, 2015, PP.13-30. [2] Ye Wang, “A wireless Sensor System for the Training of Hammer Throwers”, Bachelor of Science, University of Lethbridge, Student Thesis, 2013. [3] Emmanuel Kobina Payne, Dennis Joe Harmah, “Multi-parametric Telemetry Patient Monitoring System”, International Journal of Scientific and Research Publications, Vol. 5, Issue 11, 2015, PP.272-276. [4] U. Anliker, J.A. Ward, P. Lukowicz, G. Troster, F. Dolveck, M. Baer, F. Keita, E. Schenker, F. Catarsi, L. Coluccini, A. Belardinelli, D. Shklarski, M. Alon, E. Hirt, R. Schmid and M.Vuskovic, “AMON:A Wearable Multiparameter Medical Monitoring and Alert System”, IEEE Transaction on Information Technology in Biomedicine, Vol. 8, Issue 4, 2004,PP.1-11. [5] Sheng Hu. Michigan Technological University, “Body Sensor Network for In-Home Personal Health Care”, Student Thesis, 2012. [6] Christian Hofmann, Christian Weigand and Josef Bernhard, “Wireless Medical Sensor Network with ZIgbee”, WSEAS International Conference on Applied Informatics and Communication, PP. 116 – 119, 2006. [7] Jan-Hein Broeders, José Carlos Conchell “Wearable Electronic Devices Monitor Vital Signs, Activity Level, and More” Analog Dialogue, Volume 48, PP.13-18, Number 4. [8] Himanshu Gothwal, Silky Kedawat, Rajesh Kumar “Cardiac arrhythmias detection in an ECG beat signal using fast fourier transform and artificial neural network” J. Biomedical Science and Engineering, 2011, 4, PP.289-296. [9] V. Nandagopal, V. Maheswari, C. Kannan “Newly Constructed Real Time ECG Monitoring System Using LabView” Circuits and Systems, 2016, 7, PP.4227-4235. [10] L.A. Geddes, M. Voelz, C. Combs, D. Reiner, C.F. Babbs “Characterization of the Oscillometric Method For Measuring Indirect Blood Pressure”
www.ijera.com
271-280, 1982. [11] Madhur .S. Gabhane, Zahir Aalam “A Real Time Electrocardiogram (ECG) Device for Cardiac Patients” International Journal of Engineering Research and Development,Volume 11,Issue 03,March 2015,PP.64-69. [12] P, D. Bakerz D, R. Westenskow, K. Kuck, “Theoretical analysis of non-invasive oscillometric maximum amplitude algorithm for estimating mean blood pressure” Medical & Biological Engineering & Computing, 35, 271-278, May 1997. [13] Jonathan S. Williams, Stacey M. Brown and Paul R. Conlin, “Blood Pressure Measurement ”.The New England Journal of Medicine, 2009. [14] Geoff Appelboom, Elvis Camacho, Mickey E Abraham, Samuel S Bruce, Emmanuel LP Dumont, Brad E Zacharia, Randy D‟Amico, Justin Slomian, Jean Yves Reginster, Olivier Bruyère and E Sander Connolly Jr “Smart wearable body sensors for patient self-assessment and monitoring” Archives of Public Health 2014, PP.72-28. [15] Thanapong Chaichana, Yutthana Pititeeraphab, Manas Sangworasil, and Takenobu Masuura “Implementation of Wireless Electrocardiogram Monitoring System” International Journal of Electronics and Electrical Engineering Vol. 4, No. 3, June 2016, PP.248-252. [16] Jacob I. Hirsch, Stanley A. Briller, and Charles E. Kossmann “The Image Tetrahedron in Man Determined by Reciprocal Stimulation of a Tridimensional Esophageal Electrode” Circulation Research, Volume IV, September 1956, PP.599605. [17] Richard Pflanzer and William McMullen, “Electrocardiography (ECG) II”, BIOPAC System, Inc. [18] Analog Device, Single – Lead, Heart Rate Monitor Front End AD8232 Data sheet, 2017. [19] Gbenga Ogedegbe, Thomas Pickering “Principles and techniques of blood pressure measurement” Cardiol Clin. 2010 November, 28(4), PP. 571–586. [20] Debralee Nelson, Beverly Kennedy,Carissa Regnerus, and Amy Schweinle “Accuracy of Automated Blood Pressure Monitors” Journal of Dental Hygiene, Vol. 82, No. 4, July 2008, PP.117. [21] Pooi Khoon Lim, Siew-Cheok Ng, Wissam A. Jassim, Stephen J. Redmond, Mohammad Zilany, Alberto Avolio, Einly Lim, Maw Pin Tan and Nigel H. Lovell, “Improved Measurement of Blood Pressure by Extraction of Characteristic Features from the Cuff Oscillometric Waveform” Sensors 2015, 15, 14142-14161. [22] Ana Rita Carvalho, Ana Rita Oliveira, Andreia Ferreira, João Pedro Freitas, Salomé Azevedo, Teresa Pereira “Sphygmomanometer” Signal Acquisition and Instrumentation in Bioengineering, Lisboa, Portugal, April 10, 2013.
DOI: 10.9790/9622-0801040412
10 | P a g e
Int. Journal of Engineering Research and Application www.ijera.com ISSN : 2248-9622, Vol. 8, Issue 1, ( Part -IV) January 2018, pp.04-11 [23] C.S. Chua and Siew Mun Hin “Digital Blood Pressure Meter” Sensor Application Engineering Singapore, Freescale Semiconductor, Inc., 2005, PP.1-8. [24] Harshavardhan B.Patil, V.M.Umale, “Arduino Based Wireless Biomedical Parameter Monitoring System Using Zigbee” International Journal of Engineering Trends and Technology (IJETT) – Volume 28, 7, October-2015, PP.316-320. [25] Mohamed FEZARI, Rachad Rasras and Ibrahiem M. M. El Emaryc, “Ambulatory Health Monitoring System Using Wireless Sensors Node” Procedia Computer Science, 65, 2015, PP. 86 – 94. [26] Khalifa AlSharqi, Abdelrahim Abdelbari, Ali Abou-Elnour, and Mohammed Tarique” Zigbee Based Wearable Remote Healthcare Monitoring System for Elderly Patients” International Journal of Wireless & Mobile Networks (IJWMN) Vol. 6, No. 3, June 2014,PP.53-67. [27] María José Morón, Rafael Luque and Eduardo Casilari, “On the Capability of Smart phones to perform as Communication Gateways in Medical Wireless Personal Area Networks” Sensors 2014, 14, PP.575-594. [28] M. Abo-Zahhad, SabahM. Ahmed, and O. Elnahas, “A Wireless Emergency Telemedicine System for Patients Monitoring and Diagnosis” International Journal of Telemedicine and Applications, Volume 2014, Article ID 380787, 11 pages.
www.ijera.com
DOI: 10.9790/9622-0801040412
11 | P a g e