WATERSHED SEGMENTATION WITH BOUNDARY CURVATURE RATIO BASED MERGING CRITERION Xiaochen He1, Nelson H. C. Yung2, K.P. Chow1, Francis Y.L. Chin1, Ronald H. Y. Chung3, K. Y. K. Wong1, Kenneth S.H. Tsang3 1
The Department of Computer Science, The University of Hong Kong, Pokfulam Road, Hong Kong {xche, chow, chin, kykwong}@cs.hku.hk 2 The Department of Electrical and Electronic Engineering, The University of Hong Kong, Pokfulam Road, Hong Kong
[email protected] 3 Verint Systems (Asia Pacific) Ltd., Asia Pacific Headquarters, Suite 715-716,Level 7, Core F, Cyberport 3, Hong Kong {ronald.chung, kenneth.tsang}@verint.com ABSTRACT This paper proposes to incorporate boundary curvature ratio, region homogeneity and boundary smoothness into a single new merging criterion to improve the oversegmentation of marker-controlled watershed segmentation algorithm. The result is a more refined segmentation result with smooth boundaries and regular shapes. To pursue a final segmentation result with higher inter-variance and lower intra-variance, an optimal number of segments could be self-determined by a proposed formula. Experimental results are presented to demonstrate the merits of this method. KEY WORDS Watershed segmentation; merging criterion; boundary smoothness; optimal number of segments
1. Introduction Segmentation is a fundamental step in most image analysis applications, which partitions the image into some meaningful regions. Though hundreds of segmentation methods have been proposed in the literature, it is generally understood that the problem is illdefined and most methods perform well only under specific conditions for specific images. In some cases, these methods required manual tuning to achieve a desirable result involving particular human knowledge. More recently, researchers have attempted to develop methods which start with an over-segmentation result. The principle of this approach is to combine the map of regions (generally with false boundaries) and the map of edges (generally with fine and sharp lines, but disjointed) together to give an accurate and meaningful segmentation. An example is starting with the morphological watershed transform, and then merging over-segmented regions based on region homogeneity or edge integrity [1]. This initial over-segmentation is due to the high sensitivity of the watershed algorithm to the gradient image intensity variations, and, consequently, depends on the
performance of the noise reduction algorithm. The methods discussed in [2-6] all belong to this category, i.e. they belong to a class of post-processing techniques. For these methods, the segmentation performance is highly dependent on the merging criteria. A typical merging criterion is based on the homogeneity of region intensity, which was reported by Haris et al. [3]. In order to minimize the total square error between the segmented image and original image, an optimal partition is obtained by merging a pair of regions that minimizes the following dissimilarity function of adjacent region pair: δ ( R*Mi , R*Mj ) =
R*Mi ⋅ R*Mj R*Mi + R*Mj
[ µ ( R*Mi ) − µ ( R*Mj )]2
(1)
where R denotes the cardinality of set R (i.e. pixel number of R), µ ( RMk ) corresponds to the mean value of region RMk . However, as pointed out by Pavlidis and Liow [2], methods based only on region uniformity have the tendency to produce false boundaries because the definition of region homogeneity usually insists on a roughly constant brightness, but brightness may vary within a region. They also suggested that the results would be significantly improved by exploring the edge information rather than fine-tuning the homogeneity criteria. With the aim of improving the segmentation results, some joint region merging criteria were proposed to make use of homogeneity together with edge integrity [4, 5], or boundary smoothness [6], in which weighted style of dissimilarity function were adopted. However, the selection of the weighting parameter α may limit the power and advantage of these methods. Furthermore, the final number of segments in these methods is often determined manually or based on some thresholds, while a statistically optimal number of segments is usually expected in practice. Our proposed method begins with an over-segmented result as well, which is derived from a marker-controlled watershed transform, as introduced in Section 2. Then in Section 3, by assuming that objects in an image are
usually regular in shape with smooth boundaries, a new merging criterion is proposed by utilizing region homogeneity and edge smoothness. A concept called boundary curvature ratio is introduced to represent the smoothness of region boundaries, and adopted as a power coefficient in the dissimilarity function. As opposed to the weighting approach, no additional parameter is needed in the proposed merging criterion. Moreover, a method to find statistically optimal number of segments is presented in Section 4. Test results and discussions are given in Section 5.
6) Compute the watershed transform on the modified gradient magnitude image to obtain a raw segmentation. 7) Segments in each channel are incorporated by “AND” operation, which means only pixels belong to the same segment in every channels are regarded as region in the fusion results. Although this marker-controlled watershed method alleviates somewhat the problem of over-segmentation, there are still a lot of segments that do not correspond to any physical regions. Therefore, a further merging procedure is necessary.
2. Marker Controlled Watershed Segmentation
3. Proposed Merging Criterion
Initial over-segmented result is produced by a morphological watershed transform of the gradient magnitude image based on immersion simulation [7], which is a method to construct the watershed line by considering grey-tone of an image as altitude of a topographic surface, and then flooding the image from the regional minima. However, the gradient operation is sensitive to noise, which results in a large number of small catchment basins that are not actually associated with meaningful regions. These small catchments cause the watershed transform to produce numerous negligibly small regions with no correspondence to any real object. To eliminate these extraneous local minima, we use the technique of marker-controlled watershed [8] which only allows local minima occur inside the markers generated by applying an opening-by-reconstruction and closing-byreconstruction morphological filter to the original image and followed by identifying the region maxima and minima. Major steps of the proposed marker-controlled watershed segmentation include: 1) Separate the original image to RGB channels, and perform step (2)-(6) on each channel. 2) Use the gradient magnitude as the segmentation function, and Sobel operator is adopted here to calculate gradient magnitude. 3) Morphological techniques called "opening-byreconstruction" and "closing-by-reconstruction" are used to "clean" up the image. These operations will create flat maxima and minima inside each object. Opening is an erosion operation followed by a dilation operation, while opening-by-reconstruction is an erosion operation followed by a morphological reconstruction, which could remove small blemishes without affecting the overall shapes of the objects. Details of morphological reconstruction could be referred by [9]. 4) Regional maxima and minima are located as markers, which denote intended components of the whole image. 5) Modify the gradient magnitude image so that its regional minima occur only in the marker pixels.
The proposed criterion is an attempt to utilize boundary information as well as region homogeneity information with the aim of improving the result to a more visually appropriate segmentation. It is observed that many manmade objects have smooth boundaries other than rugged ones. So it is natural to demand the segmentation method, when applying to images of these kinds of objects, yield a result of segmented regions with smooth boundaries. To take advantage of the boundary information, a merging criterion based on boundary curvature ratio (BCR) is developed in this section. First, let regions RuM and RvM be two adjacent regions. When RuM and RvM merge together, a new region R wM is created. Let Au, Av and Aw be contours of these regions, j j j j j j where A j ={ ( x1 , y1 ), ( x2 , y2 ), L , ( x N j , y N j ) }, and Nj is
the pixel number of the jth contour, ( xij , y ij ) is the coordinate position of the ith pixel in the jth contour. We then compute the curvature K ij of these contours as:
K ij =
∆xij ∆2 yij − ∆2 xij ∆yij ((∆xij ) 2 + (∆yij ) 2 )1.5
(2)
∆x ij = ( x ij+1 − x ij−1 ) / 2 , ∆y ij = ( y ij+1 − y ij−1 ) / 2 , ∆2 xij = (∆xij+1 − ∆xij−1 ) / 2 , and ∆2 y ij = ( ∆y ij+1 − ∆y ij−1 ) / 2 .
where
Then, BCR of region RuM and RvM is defined as:
BCRu ,v =
1 Nw
Nw
∑K i =1
Nu
w i
(3) Nv
1 (∑ K iu + ∑ K iv ) N u + N v i =1 i =1 which denotes the ratio of the mean curvature of the contour for the merged region to the mean curvature of contours for the two individual regions. If the numerator of BCRu,v is larger than the denominator, which means the boundaries of RuM and
RvM are smoother than the region boundary by merging them together, then the need to merge RuM and RvM is considered low and the cost to merge them is large. On the other hand, if the numerator of BCRu,v is smaller than the denominator, which means the shape integrity of R wM
where R and µ ( RMk ) have the same definition as the merging criterion in Equation (1). Based on above definition, a stepwise merging is then executed. Start from results of Section2, dissimilarity function of each adjacent pair of regions is calculated according to Equation (4). Merging is prior to the most similar pair of regions that minimize this dissimilarity function.
piecewise constant approximation of the observed image Y. For an arbitrary region R Mk = { p k ,1, p k , 2 ,..., p k } , the k , RM
corresponding square error is: RkM
E( R ) = k M
∑[Y ( p i =1
k ,i
(5)
) − µ ( RMk )]2
where µ ( RMk ) is the mean value of region RMk , and therefore, the total square error, which is regarded as intra-variance of the M-partition, is: M
INTRAM = E ( RM ) = ∑ E ( RMk )
(6)
k =1
On the other hand, inter-variance of the M-partition is defined as the minimum dissimilarity function of all the adjacent pairs of regions, which could be denoted as: INTERM = min(δ ( RuM , RvM ), ∀u, v ∈{1,2,..., M }) (7) 7
5
x 10
Results with different number of segments Optimal segmentation Ideal segmentation
4.5 4 3.5 Intra-Variance
is better than RuM and RvM , then the need to merge RuM and RvM is high and the cost to merge them is small. If the numerator of BCRu,v is larger than the denominator, which means the boundaries of RuM and RvM are smoother than the region boundary by merging them together, then the need to merge RuM and RvM is considered low and the cost to merge them is large. On the other hand, if the numerator of BCRu,v is smaller than the denominator, which means the shape integrity of R wM is better than RuM and RvM , then the need to merge RuM and RvM is high and the cost to merge them is small. In summary, when BCRu,v has a small value (1), we keep them separated. To utilize this boundary characteristic as well as region homogeneity information, a new dissimilarity function is defined similar to Equation (1), and denoted as: RuM ⋅ RvM 2 BCR δ ( RuM , RvM ) = u [ µ ( RuM ) − µ ( RvM )] u ,v (4) RM + RvM
3 2.5 2 1.5 1 0.5 0
0
2
4
6 8 Inter-Variance
10
12
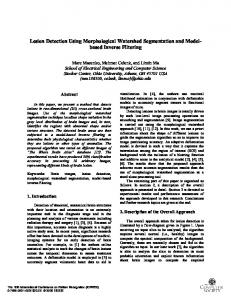
Fig. 1. Finding optimal number of segments
4. Self-Determined Region Number To arrive at the final segmentation result, the merging procedure can stop when either the δ value is greater than a certain threshold, or the number of segments reaches a manually fixed value. However, these thresholds or manually fixed value are difficult to determine. In practice, it is preferred to obtain segmentation result without the need of prior knowledge. The ultimate goal of segmentation is to minimize intravariance (i.e. maximize homogeneity of the segments) and maximize inter-variance (i.e. maximize dissimilarity between segments). However, in stepwise merging procedure, when the inter-variance increases, intravariance will also increase. Therefore, the purpose of this section is to find a trade off between them. Assume the ideal segmentation result should have zero intra-variance and an inter-variance value as greater as possible. By defining intra- and inter-variance as special formula, it is possible to find the optimal number of segments, which is associated with the segmentation result that is closest to the ideal result statistically. Let RM = { RM1 , RM2 ,..., RMM } be an M-partition of image Y, which is derived from the initial segmentation. Intravariance is naturally defined by the total square error of a
14 4
x 10
Starting from the initial segmentation, at every step of the region merging, corresponding intra- and intervariance are calculated and recorded. Then, ideal segmentation is defined as a suppositional situation with INTRAideal=0, and INTERideal=max(INTERM). Finally, the result closest to the ideal segmentation is regarded as the optimal result. As illustrated in Fig. 1, intra- and intervariance of all the segmentation results is plotted with ‘*’ in the 2-D feature space, and ideal segmentation is marked as ‘circle’. Mahalanobis distances from all those points to the ideal segmentation were calculated, and the results corresponding to minimum distance is the optimal segmentation, marked by the ‘square’. Mahalanobis distance is adopted here because the intra- and intervariance could have different ranges and amounts of variation.
5. Experiments and Discussion The two color images shown in Fig. 2 were used in order to illustrate the stages of the segmentation algorithm and investigate the efficiency of the proposed segmentation method. The vehicle image (512×512, 8bit) was derived from a real traffic image, with background removed. In
typical process of visual traffic surveillance, by detecting changes in the image sequence, the moving vehicles can be separated from the stationary background. Then a segmentation module is necessary for further analysis. In this image, due to reflection on the vehicle surface and complex light condition, the intensity level on the windows and windscreen of the vehicle varies significantly. As such, traditional segmentation method would hardly be able to classify these components as single regions. Another test image is shot by a digital camera in an indoor environment, with size of 320×240 and 8bit depth. Again, the reflection on the window and non-uniform illumination challenge the ability of segmentation method.
Fig. 2 Test images: Vehicle image (left) and lobby image (right)
Fig.4(c)&(d) are obtained from using the proposed merging criterion given in Equation (4). Visually, we see that in the vehicle image of Fig.4(a), the front-top panel is merged with a part of the windscreen, which itself is divided into a few regions. Moreover, the side window on the right is broken into many small and unwanted regions. Compare this with the original image as depicted in Fig. 2, this is caused by the transparency of the window and its reflectivity such that other scenes around the vehicle are reflected on the glass, which resulted in the failure of the regional homogeneity criterion. For the proposed merging criterion, the boundaries of the segmented regions become smoother as expected. In Fig. 4(c), the front window is no longer broken up and the small regions disappear from the side windows as well. Indeed, the result is more visually pleasing. Similarly, the same occur in the lobby image. Results in Fig. 4(b) contain false boundaries on the floor and ceil which do not correspond to a physical object, and the glass window in the center of the image is not appropriately separated. On the other hand, the result in Fig. 4(d) reveals wonderful performance of the proposed merging criterion, with windows and lamps correctly segmented without any false boundaries.
(a)
(b)
(a)
(b)
Fig. 3 Initial segmentation results of the images in Fig.2 after applying the marker-controlled watershed algorithm. 477 regions for vehicle image and 888 regions for lobby image.
Fig. 3 shows the initial tessellations of the test images produced by the marker controlled watershed module as described in Section 2. The number of regions in this initial segmentation results depends on the size of morphological filters. It is clear that the larger the filter size the smaller number of the regions is produced by the watershed algorithm. With large filter size and less initial regions, over-segmentation can be alleviated, and merging procedure could be faster. However, using filters of large size may suppress some detailed information and destroy part of the image contours. In this paper, 3×3 filters are used for all the examples. As we mentioned in the preceding sections that the performance of the segmentation method largely depends on the merging criterion, here we apply our proposed merging criterion as well as homogeneity based merging criterion [3] to the marker-controlled watershed segmentation result to study the impact of the new criterion. Results of region merging are shown in Fig. 4, where Fig.4(a)&(b) are derived from the homogeneity based merging criterion given in Equation (1), and
Fig. 4. Segmentation result with fix number of regions (10 regions). (a)-(b) Merging result by using homogeneity based merging criterion, (c)-(d) Merging result by using the proposed BCR based merging criterion
Fig. 5. Segmentation result with optimal number of segments: 6 regions for the vehicle image (left) and 4 regions for the lobby image (right)
6. Conclusion
Fig. 6. Test synthetic image and segmentation result with optimal number of segments (7 regions).
Fig. 5 shows the segmentation results of the test images with statistically optimal number of segments, where 6 regions for the vehicle image and 4 regions for the lobby image. Visually, these results ignore some detailed objects, and only segmented the most significant objects in the images. Although it could be argued whether this result is better than the results with those of Fig.4, this statistically optimal result provides a fully adaptive solution for segmentation. The advantage of the proposed method for determining the number of segments can be revealed by the synthetic image as shown in Fig.6. Without any prior knowledge, the optimal number of segments is self-determined as 7, which is exactly the same as the ground truth.
Fig. 7. Test results on human images.
So far, the images tested are assumed to contain manmade objects, such as vehicles and buildings, which have smooth boundaries other than rugged ones. In spite of this, some other kinds of images were also attempted by the proposed method. Fig.7 presents some test results on human images. Without a known number of regions a priori, all these images were segmented automatically. The results are very encouraging as major features have been segmented correctly. Better result is expected if finetuning is performed.
Based on a dissimilarity function, the proposed merging criterion combines region homogeneity with boundary smoothness, which can be represented by a boundary curvature ratio, and is utilized in a power form. Differing from the weighted form in some other joint merging criteria, it does not introduce any additional parameters. Another merit of this research is to determine an optimal number of segments automatically according to the distribution of intra- and inter-variance in each step of the merging process. Experimental results support the validity of the proposed criterion and method.
Acknowledgements This research was jointly sponsored by Verint Systems (Asia Pacific) Limited and the Innovation and Technology Commission of the Government of the Hong Kong Special Administrative Region, under the Grant ITS/072/06.
References [1] J. Freixenet, X. Munoz, D. Raba, J. Marti, and X. Cufi, Yet another survey on image segmentation: Region and boundary information integration, Computer Vision - Eccv 2002 Pt Iii, 2352, 2002, 408-422. [2] T. Pavlidis and Y. T. Liow, Integrating Region Growing and Edge-Detection, IEEE Transactions on Pattern Analysis and Machine Intelligence, 12, 1990, 225-233. [3] K. Haris, S. N. Efstratiadis, N. Maglaveras, and A. K. Katsaggelos, Hybrid image segmentation using watersheds and fast region merging, IEEE Transactions on Image Processing, 7, 1998, 16841699. [4] S. E. Hernandez and K. E. Barner, Joint region merging criteria for watershed-based image segmentation, Proc. IEEE 2002 International Conference on Image Processing, 2000, 108-111. [5] S. E. Hernandez, K. E. Barner, and Y. Yu, Region merging using homogeneity and edge integrity for watershed-based image segmentation, Optical engineering, 44, 2005, 17004. [6] Z. G. Tan, X. C. He, and N. H. C. Yung, A novel merging criterion incorporating boundary smoothness and region homogeneity for image segmentation, Advances in Image and Video Technology, Lecture Notes in Computer Science, 4319, Springer Berlin/Heidelberg, 2006, 238-247. [7] L. Vincent and P. Soille, Watersheds in Digital Spaces - an Efficient Algorithm Based on Immersion Simulations, IEEE Transactions on Pattern Analysis and Machine Intelligence, 13, 1991, 583-598.
[8] S. Beucher, The watershed transformation applied to image segmentation, presented at 10th Pfefferkorn Conf. on Signal and Image Processing in Microscopy and Microanalysis, 1992.
[9] L. Vincent, Morphological grayscale reconstruction in image analysis: applications and efficient algorithms, IEEE Transactions on Image Processing, 2, 1993, 176-201.