May 16, 2016 - RBF Algorithm. Mr. Veerabathini Srinivas1, Mrs. V. Rama2, Dr. C.B. Rama Rao3 ... There are three modes of recording: the unipolar, averaging ...
ISSN (Online) 2321 – 2004 ISSN (Print) 2321 – 5526
IJIREEICE
INTERNATIONAL JOURNAL OF INNOVATIVE RESEARCH IN ELECTRICAL, ELECTRONICS, INSTRUMENTATION AND CONTROL ENGINEERING Vol. 4, Issue 5, May 2016
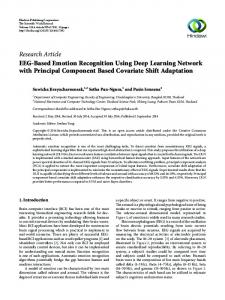
Wavelet Based Emotion Recognition Using RBF Algorithm Mr. Veerabathini Srinivas1, Mrs. V. Rama2, Dr. C.B. Rama Rao3 M. Tech Student, Dept. of ECE, NIT Warangal, Warangal, India1 Assistant Professor, Dept. of ECE, NIT Warangal, Warangal, India2 Associate Professor, Dept. of ECE, NIT Warangal, Warangal, India3 Abstract: The emergence of novel technologies such as virtual reality, augmented reality, and wearable computers has led to an increasing amount of research in human-computer systems. With multiple source of human information a computer can actually take a look into the real world emotions carried by the user’s head and act accordingly by observing their mental state. This paper concentrates on recognition of “inner” emotions from a non-stationary electroencephalogram (EEG) signals. The EEG signals in discrete format are collected from DEAP dataset, which contains 32 participants’ recorded EEG signals when excited to video stimuli. This paper proposes a computer based analysis which employs signal processing techniques of Frequency domain and Wavelet analysis for feature extraction and artificial neural networks for classifying the emotions carried by the participant from emotional characteristics exhibited in different frequency bands (Gama, Beta, Alpha, Theta and Delta). The average accuracies of Radial basis function and Multilayer perceptron models from wavelet analysis are 85.45% and 76.36% respectively which show better classification results over frequency domain analysis with 54.54% and 63.63% accuracies respectively. Considering each pair of channels Occipital lobe channels (O z, O1, O2) are giving better results among the 40 channels covering whole head. Considering different frequency bands, high frequency bands (Gama and Beta) gives better results than lower frequency bands which are analysed from precision, sensitivity, specificity and F-scope calculated for each frequency band with different techniques of frequency and wavelet analysis. Keywords: EEG, RBF, MLP, precision, sensitivity, specificity, F-scope, Fast Fourier Transform, Wavelet Transform, Gamma(γ), Beta(β), Alpha(α), Theta(θ), Delta(δ). I. INTRODUCTION The recording of the electrical activity of the brain is known as electroencephalography (EEG). It is widely used for clinical and research purposes. Methods have been developed to investigate the functions of the various parts of the brain by means of EEG. Depth recording is used by insertion of needle electrodes into the neural tissue of the brain. Electrodes can be placed on the exposed surface of the brain, a method known as Electrocorticogram. And the most generally used methods, noninvasive recording from the scalp by means of surface electrodes (EEG). The investigation of the electrical activity of the brain is generally divided into two modes. The first is the recordings of spontaneous activity of the brain which is the result of the electrical field generated by the brain with no specific task assigned to it. The second is the evoked potentials (EP). These are the potentials generated by the brain as a result of a specific stimulus. The surface recordings of EEG depends on the location of electrodes. In routine clinical multiple EEG recordings, the electrodes are placed in agreed upon locations in the frontal (F), central (C), temporal (T), parietal (P) and occipital (O) regions, with two common electrodes placed on the earlobes. Between 6 to 40 channels are employed, with 8 or 16 being the numbers most often used. Potential difference between the various electrodes are recorded. There are three modes of recording: the unipolar, averaging reference and bipolar recordings. Copyright to IJIREEICE
Fig. 1 Electrode position on head The bandwidth range of the scalp EEG is DC to 100Hz, with the major power distributed in the range of 0.5 to 60Hz. Amplitudes of scalp EEG range from 2 to 100 µV. The EEG power spectral density varies greatly with physical and behavioural states. EEG frequency analysis has been a major processing tool in neurological diagnosis for many years. It has been used for the diagnosis of epilepsy, head injuries, psychiatric malfunctions, sleep disorders and others. The major portion of the EEG spectrum is subdivided into five bands. Delta: The part of the spectrum that occupies the frequency range of 0.5 to 4Hz is the delta range. Delta range appears in young children, deep sleep and in some
DOI 10.17148/IJIREEICE.2016.4507
29
ISSN (Online) 2321 – 2004 ISSN (Print) 2321 – 5526
IJIREEICE
INTERNATIONAL JOURNAL OF INNOVATIVE RESEARCH IN ELECTRICAL, ELECTRONICS, INSTRUMENTATION AND CONTROL ENGINEERING Vol. 4, Issue 5, May 2016
brain diseases. In the alert adult delta activity is considered The different processing steps involved are: abnormal. Theta: The theta range is the part of the spectrum that occupies the frequency range of 4 to 8Hz. Transient components of theta activities have been found in normal adults, subjects in active state. The theta activity occurs mainly in the temporal and central areas and is more common in children. Alpha: The alpha range is the part of the spectrum that occupies the range of 8 to 13Hz. These types of rhythms are common in normal subjects, best seen when the subject is awake, with closed eyes, under conditions of relaxation. The source of the alpha wave is believed to be in occipital lobes. Beta: This is part of the spectrum in frequency range 13 to 30Hz. The beta rhythm is recorded in the normal adult subjects mainly from the precentral regions, but many appear in other regions as well. Sedatives and various barbiturates cause an increase of beta activity often up to amplitudes 100µV. Gamma: The spectrum within the range of 30 to 60 Hz is gamma region. These are involved in higher processing tasks as well as cognitive functions. Gamma waves prove their importance in learning, memory and information processing. These wave are important for the binding of our senses in regards to perception and are involved in learning new material. It has been found that individuals who are mentally challenged and have learning disabilities tend to have lower gamma activity than average.
Fig. 3 Flow chart showing processing steps A. Frequency Domain Analysis Fourier Transform decomposes the signal to complex exponential functions of different frequencies. This Transformation can be given by below equations X f = x t =
∞ x(t)e−2jπft dt −∞ ∞ X(f)e2πft dt −∞
(1) (2)
In the above equations, t stands for time, f for frequency, and x for time domain signal and X denotes signal in frequency domain. This conversion is used to distinguish the two representations of the signal. Equation (1) is called the Fourier transform of x(t) and equation (2) is called the inverse Fourier transform of X(f), which is x(t).
Fig. 2 Different frequency bands of EEG signal II. MATERIALS AND METHODS Discrete Fourier transform and Wavelet transform techniques are applied to distinguish different frequency bands from the available frequencies of the EEG signal. The required EEG signals Data are collected from DEAP dataset in the form of discrete samples, sampled at the rate of 512Hz. 8064 samples of EEG data extracted from 40 channels all over the head position when the participate is exited with video stimuli. 11 participates data is worked out in this paper taking the signals from Occipital lobe area (Oz, O1, O2), a sensory part of the brain for video excitation. Copyright to IJIREEICE
B. Wavelet Analysis Wavelets are essentially filter banks. Each filter splits a given signal into two non-overlapping independent high frequency and low frequency sub-bands such that it can then be reconstructed by the means of an inverse transform. When such filters are applied continually, you get a tree of filters with output of one fed into the next. The simplest, and the most intuitive way to build such tree is as follows: Decompose a signal into low frequency (approximation) and high frequency (detail) components Take the low frequency component, and perform the same processing on that Keep going until you've processed the required number of levels The reason for this is that you can then down sample the resulting approximation signal. You can then take every second sample of the approximation component without aliasing, essentially decimating the signal. This is widely used in signal and image compression
DOI 10.17148/IJIREEICE.2016.4507
30
ISSN (Online) 2321 – 2004 ISSN (Print) 2321 – 5526
IJIREEICE
INTERNATIONAL JOURNAL OF INNOVATIVE RESEARCH IN ELECTRICAL, ELECTRONICS, INSTRUMENTATION AND CONTROL ENGINEERING Vol. 4, Issue 5, May 2016
𝛾𝑥𝑛 =
𝑖=𝑁−2 𝑖=1
𝑋 𝑏 𝑖 + 2 − 𝑋 𝑏 (𝑖)
(11)
D. Artificial Neural Networks Artificial neural network is a large computation system inspired by the structure, processing methods and learning ability of a biological brain with added characteristics containing a large number of very simple processing neuron like processing elements, a large number of weighted connections between the elements, and distributed representation of knowledge is acquired by networks through a learning process. Fig. 4 Wavelet Decomposition
E. Multilayer Perceptron The Wavelet function used in this paper is db8 and Multilayer perceptron networks (MLP) having either coefficient vectors in different frequency bands are threshold or sigmoidal activation functions which is a continuous differentiable function. This networks works obtained from eight level decomposition. with a powerful and computationally efficient method of error back propagation. This method involves finding the C. Feature Extraction The features of the EEG signal extracted from the above derivatives of an error function with respect to the weights mentioned techniques serves as a training set of data for and biases in the network. This is an important feature of further classification of emotional frequency bands. The the MLP, since these derivatives play a central role in the statistical features extracted using signal processing majority of training algorithms for MLP networks. techniques are mentioned below which has given an The network with multiple layers contains differentiable optimised and accurate results in training artificial neural activation functions like sigmoid, the output of these functions are differentiable with both the input variables networks. and with the weights and biases of the network Maximum value of the raw signal constructed. We define an error function, such as the Minimum value of the raw signal squares of the sum of error which is differentiable function Mean of the networks output, this error itself is a differentiable 1 𝑖=𝑁 𝜇𝑥 = (3) 𝑖=1 𝑋(𝑖) function of weights. We can therefore evaluate the 𝑁
X(i) represents the value of the ithsample of the raw EEG derivatives of the error with respect to the weights, and through these derivatives we find weight values which discrete data signal i=1,…….,N. minimise the error function, by using gradient descent, one Median of the more powerful optimization methods. The middle value of a set of ordered data 𝑀𝑑𝑛 ={(n + 1) ÷ 2}th value (4) n is the number of values in the set of data Standard deviation of the raw signal 1 𝑖=𝑁 2 1/2 𝜎𝑥= ( 𝑖=1 (𝑋 𝑖 − 𝜇𝑥 ) )
(5)
Energy of the raw signal 𝐸𝑥 = 𝑖=∞ 𝑖=−∞ 𝑋(𝑖)
(6)
𝑁−1
2
The Mean of the absolute values of the first differences of the raw signal 1 𝑖=𝑁−1 𝛿𝑥 = 𝑋 𝑖 + 1 − 𝑋(𝑖) (7) 𝑖=1 𝑁−1
The Mean of the absolute values of the second differences of the raw signal 1 𝑖=𝑁−2 𝛾𝑥 = 𝑋 𝑖 + 2 − 𝑋(𝑖) (8) 𝑖=1 𝑁−2
The Means of the absolute values of the first differences of the normalized signal 1 𝑖=𝑁−1 𝑏 𝛿𝑥𝑛 = 𝑋 𝑖 + 1 − X 𝑏 (𝑖) (9) 𝑖=1 𝑋𝑏 =
𝑁 𝑋 𝑖 −𝜇 𝑥 𝜎𝑥
(10)
Fig. 5 Neural network model 𝑌𝑘 =
𝑛 𝑗 =1 𝑤𝑘𝑗 𝑥𝑗
(12)
Ykis output of activation function, where wkj is synoptic weight from jthneuron to kth neuronand xj is input to the jthneuron 𝐸 𝑝 = 1/2 (𝑡0 − 𝑦0 )2 (13) Ep is error function calculated from t0 true value and y0 value from activation function 𝜕𝐸 = −(𝑡0 − 𝑦0 )𝑥𝑖 (14) 𝜕𝑤 0𝑖
Which represents a gradient descent error function Where 𝜇𝑥 and 𝜎𝑥 are the mean and standard deviations of And the updated new weight vector is calculated as: X. ∆𝑤0𝑖 = 𝛾(𝑡0 − 𝑦0 )𝑥𝑖 (15) The Means of the absolute values of the second 𝛾is learning rate differences of the normalized signal w0i (new) = w0i (old) + ∆𝑤0𝑖 (16) Copyright to IJIREEICE
DOI 10.17148/IJIREEICE.2016.4507
31
IJIREEICE
ISSN (Online) 2321 – 2004 ISSN (Print) 2321 – 5526
INTERNATIONAL JOURNAL OF INNOVATIVE RESEARCH IN ELECTRICAL, ELECTRONICS, INSTRUMENTATION AND CONTROL ENGINEERING Vol. 4, Issue 5, May 2016
F. Radial Basis Function Radial basis function (RBF) provides an important property in which the activation of the hidden unit is determined by the distance between the input vector and a prototype vector. In this technique we use Gaussian function as our activation function. The procedures in training the RBF is faster than that we use in MLP. This can be given by internal representation formed by the hidden nonlinear functional units, and leads to a two stage training procedure. In first stage the parameters governing the basis function are determined using relatively fast, unsupervised learning methods. The second stage of training then involves the determination of the final layer weights, which requires the solution of a linear problem, and which is also a faster process. 𝑌𝐾 𝑋 = 𝑀 (17) 𝑗 =1 𝑤𝑘𝑗 ∅𝑗 𝑋 + 𝑤𝑘0 Yk(X) is the output of the activation function. ∅𝑗 𝑋 = 𝑒𝑥𝑝
− 𝑋−𝜇 𝑗
Fig. 7 Magnitude and Frequency plot of FFT and energy of the signal calculated in different frequency bands
2
2𝜎 𝑗 2
(18)
∅𝑗 𝑋 is the Gaussian activation function. Where X is d-dimensional input vector with elements xi, and µjis the vector defining the centre of the basis function ∅𝑗 𝑋 and has the elements µji.
TABLE I ACCURACY COMPARISONS OF WAVELET AND FREQUENCY DOMAIN ANALYSIS USING RADIAL BASIS FUNCTION AND MULTILAYER PERCEPTRON CLASSIFICATION ALGORITHMS
III. RESULTS Different bands of frequencies have been separated using above mentioned signal processing techniques, and 10 different features have been calculated on the segmented data of each signal. These extracted features are acting as the variables for training the neural networks for classification depending on the characteristic exhibited by the signals in their defined frequency bounds.
Performance characteristics of individual frequency bands are shown below: TABLE II WAVELET ANALYSIS AND RADIAL BASIS FUNCTION
Fig. 6 Frequency segmentation of the signal using Wavelet Transform Classification performance and their accuracies are analyzed by the confusion matrix obtained from neural network solutions through which we calculate TP, TN, FP and FN variables. Accuracy, precision, sensitivity, selectivity and F-scope are calculated for each frequency band using different classification techniques and the results are plotted in the below charts. Copyright to IJIREEICE
DOI 10.17148/IJIREEICE.2016.4507
32
ISSN (Online) 2321 – 2004 ISSN (Print) 2321 – 5526
IJIREEICE
INTERNATIONAL JOURNAL OF INNOVATIVE RESEARCH IN ELECTRICAL, ELECTRONICS, INSTRUMENTATION AND CONTROL ENGINEERING Vol. 4, Issue 5, May 2016
TABLE III WAVELET ANALYSIS AND MULTILAYER PERCEPTRON
MLP. The calculated results from the confusion matrix will conform this, with 85.45% and 76.36% accuracies to RBF and MLP respectively using Wavelet transform and similarly 54.54% and 63.63% respectively using FFT. With the calculation of precision, sensitivity, specificity and F-scope at each frequencies in different classification networks we can conclude that higher frequency band is showing better consistent results than lower frequency band signals. REFERENCES [1]
TABLE IV FREQUENCY DOMAIN ANALYSIS AND RADIAL BASIS FUNCTION
[2]
[3]
[4]
[5]
[6]
TABLE V FREQUENCY DOMAIN ANALYSIS AND MULTILAYER PERCEPTRON
[7]
[8]
[9]
[10] [11]
IV. CONCLUSION
[12]
This paper describes a new, fast and an efficient approach in classifying different emotional frequencies carried by [13] the human brain. From the results obtained on 11 participant’s dataset of EEG signal we can conclude that wavelet transform giving better results than Fast Fourier [14] transform in frequency segmentation tested with same features using both classification techniques. We can also conclude that RBF with fast learning and adopting capability to the given dataset giving better accuracy than Copyright to IJIREEICE
Filippo Amato, Alberto López, EladiaMaría Peña-Méndez, Petr Vanhara, Josef Havel and Ales Hampl,“Artificial neural networks in medical diagnosis.Journal of APPLIED BIOMEDICINE”, Appl Biomed. 11: 47–58,DOI 10.2478/v10136-012-0031-x,ISSN 12140287,2013. Garg.S and R.Narvey, “Diagnosing& feature extraction of eeg signal using wavelet transform”.International Journal of Engineering Science and Technology (IJEST), ISSN :09755462,Vol. 5 No.06, June 2013. HafeezUllah Amin, N.Badruddin, Weng-TinkChooi, Aamir Saeed Malik, NidalKamel,RanaFayyaz Ahmad and Muhammad Hussain,“Feature extraction and classification for EEG signals using wavelet transform and machine learning techniques”. Australas Phys EngSciMed(2015)38:139149,DOI:10.1007/s13246015-0333x,2015. Jatupaiboon.N and Setha Pan-ngum,PasinIsrasena, “Real-Time EEG-Based Happiness Detection System”.Hindawi Publishing Corporation, The Scientific World Journal, Volume 2013, Article ID 618649,http://dx.doi.org/10.1155/2013/618649. Koelstra.S, C. Muehl, M. Soleymani, J.-S. Lee, A. Yazdani, T. Ebrahimi, T. Pun, A. Nijholt and I. Patras,“DEAP: A Database for Emotion Analysis using Physiological Signals”. IEEE Transaction on Affective Computing, under review. Preethi.J, M.Sreeshakthy and A.Dhillipan,“A Survey on EEG Based Emotion Analysis using various Feature Extraction Techniques”. International Journal of Science, Engineering and Technology Research (IJSETR), Volume 3, Issue 11, ISSN: 2278 – 7798, November 2014. Rafiuddin.N, Y. Uzzaman Khan and O. Farooq, “Feature Extraction and Classification of EEG for Automatic Seizure Detection”. International Conference on Multimedia, Signal Processing and Communication Technologies,978-1-4577-1107-7/11/ ©2011 IEEE, 2011. Rama Valupadasu and B.Rama Rao Chunduri,“Identification of Cardiac Ischemia Using Spectral Domain Analysis of Electrocardiogram”.14th International Conference on Modelling and Simulation, DOI 10.1109/UKSim.2012.22,978-0-7695-46827/12/2012 IEEE. Sarkaleh.M.K and A.Shahbahrami,“Classification ofEcg Arrhythmias Using Discrete Wavelet Transform and Neural Networks”. International Journal of Computer Science, Engineering and Applications (IJCSEA), Vol.2, No.1, DOI:10.5121/ijcsea. 2012.2101,2012. Scherer.K.R,“What are emotions? And how can they be measured”. Social Science Information, vol. 44, no. 4, pp. 695-729, 2005. Shaker.M. “EEG Waves Classifier using Wavelet Transform and Fourier Transform”. International Journal of Medical, Health, Biomedical, Bioengineering and Pharmaceutical Engineering scholar.waset.org/1999.9/13033.Vol:1,No:3,2007. Singh.M, S.Gangwar and M.Singh, “Emotion Recognition Using Electroencephalography (EEG)A Review”. IJITKMI Volume 7, Number 1,December 2013. Sumathi.B and Dr. A. Santhakumaran,“Pre-Diagnosis of Hypertension Using Artificial Neural Network”. Global Journal of Computer Science and Technology, Volume 11 Issue 2 Version 1.0, Online ISSN: 0975-4172, Print ISSN: 0975-4350, February 2011. SuwichaJirayucharoensak, Setha Pan-Ngum and PasinIsrasena., “EEG-Based Emotion Recognition Using Deep Learning Network with Principal Component Based Covariate Shift Adaptation”. Hindawi Publishing Corporation, the Scientific World Journal, Volume 2014, Article ID 627892, http://dx.doi.org/ 10.1155/2014/627892, 2014.
DOI 10.17148/IJIREEICE.2016.4507
33
IJIREEICE
ISSN (Online) 2321 – 2004 ISSN (Print) 2321 – 5526
INTERNATIONAL JOURNAL OF INNOVATIVE RESEARCH IN ELECTRICAL, ELECTRONICS, INSTRUMENTATION AND CONTROL ENGINEERING Vol. 4, Issue 5, May 2016
[15] Wang.X.W, D. Nie and B.-L. Lu. “EEG-Based Emotion Recognition Using Frequency Domain Features and Support Vector Machines”. Springer-Verlag Berlin Heidelberg 2011, ICONIP 2011, Part I, LNCS 7062, pp. 734–743, 2011. [16] Zhang xizheng, Yin ling and Wang weixiong,“Wavelet Timefrequency Analysis of Electro-encephalogram (EEG) Processing”, (IJACSA) International Journal of Advanced Computer Science and Applications, Vol. 1, No. 5, November 2010.
BIOGRAPHY Mr. Veerabathini Srinivas obtained his B. Tech. in Electronics and Communication Engineering from St. Martins Engineering College, affiliated to JNTU Hyderabad. His areas of interest in Adaptive signal processing, Neural Networks. He is pursuing his post graduation M. Tech. (EI) from NIT-Warangal. Mrs. V. Rama obtained her B.Tech in Electronics and Communication Engineering from JNTU, Kakinada and M. Tech. (E&I) from NIT, Warangal. Pursuing PhD from NIT, Warangal .She is working as Asst Professor in the ECE Dept., at NIT, Warangal. She involved in extracurricular activities at institute. She has 17 years of teaching experience. She organized two UGC sponsored workshops and 6 TEQIP sponsored programs in NITW. Her area of research is Bio Medical Signal Processing. Her areas of interest are Bio informatics and Telemedicine. She is the member of IEEE. She has published no. of papers in national and international conferences and Journals. Dr. B. Rama Rao Chunduri obtained his B. Tech. in Electronics and Communication Engineering from JNTU Kakinada, M. Tech. from JNTU Kakinada and Ph.D. from IITKharagpur. He is working as Associate Professor in the ECE Dept., at NIT, Warangal. He involved in various activities at institute. He acted as HOD of ECE Dept. and Associate dean of academic affairs NITW. He has 30 years of teaching experience. He organized no. of workshops at NITW. His area of research is in advanced digital signal processing. His areas of interest are Bio Medical Signal Processing, Adaptive signal processing and Image processing; He is the member of IEEE. He has published no. of papers in national, international conferences and journals
Copyright to IJIREEICE
DOI 10.17148/IJIREEICE.2016.4507
34