paper presents two Web-based software prototypes developed to support white .... implemented as a Java Applet in a âWeb-basedâ Client / Server configuration.
A. Abran, R. Braungarten, R. R. Dumke
218
Web-based Support for White Box Software Estimation Alain Abran1, René Braungarten 2, Reiner R. Dumke2 1
2
Département de génie électrique et génie logiciel, École de technologie supérieure Montréal (Québec), Canada and Department of Computer Science, Institute for Distributed Systems, AG SoftwareEngineering Otto-von-Guericke University Magdeburg, Germany Abstract: Most commercial estimation tools can be considered as black boxes in that they do not provide details of the samples used to build their estimates. With the availability of the ISBSG international repository of 2000+ software projects, it is now feasible to develop white box estimation models which provide additional insights into the strengths and limitations of software estimates. This paper presents two Web-based software prototypes developed to support white box software project estimation.
1
Introduction
Reliable software effort estimation is critical for project selection, project planning and project control. Over the past thirty years, various estimation models have been developed to help managers perform estimation tasks, and this has led to a market offering of estimation tools. Some of these tools date from the late 1970s, and have been progressively modernized by their vendors. For organizations interested in using such estimation tools, it should be crucial to know about the predictive performance of the estimates such tools produce. In this market segment, however, estimation tool builders have not provided information on the performance of their models, either with respect to their initial data repositories or on their performance when adapted to the evolution of software development technologies. For users, these tools are basically black boxes about which little is known in terms of the reliability of the estimates such black-box tools provide as output. The construction of an estimation model usually requires a set of completed projects from which a statistical model is derived and which is used thereafter as the basis for the estimation of future projects. However, in most organizations, there is often no structured set of historical data about past projects, which explains their inability to build their own models based on the characteristics of those projects. Traditionally, organizations without such historical data have had four alternatives when they wanted to improve their estimation process:
Web-based Support for White Box Software Estimation
219
1- Collect data from past projects and build estimation models using their own historical data sets – this is particularly useful if the projects to be estimated have a high degree of similarity with past projects. This, of course, requires the availability of high quality information about those projects documented in a similar and structured way. 2- Take the time required to collect project information from current projects, and wait until completion of enough projects to build sufficiently reliable estimation models with a reasonable sample size. Most often, however, managers cannot afford to wait. 3- If their upcoming projects bear little similarity to their own past projects, they may access data repositories containing projects similar to the ones they are embarking on and derive estimation models from these. A key difficulty, until fairly recently, has been the lack of market availability of project repositories. 4- Purchase a commercial estimation tool from a vendor claiming that the tool basis includes historical projects of the same type as their upcoming projects. This is a quick solution, but often an expensive one. While alternatives 1 and 2 are under the total control of an organization, alternatives 3 and 4 depend on an outside party. Until fairly recently, for those organizations without their own historical data sets for building estimation models themselves, and who could not afford the long lead time to do so, only alternative 4 was widely available, with the associated constraint of not knowing either the basis of the estimation or the quality of the estimates derived from sources not available for independent scrutiny. In this paper, we refer to these commercial tools as black box estimation tools. Section 2 presents the international repository now available to industry and researchers. Section 3 presents the white-box approach made feasible by this international repository. Section 4 presents the first Web-based prototype, and section 5 the second Web-based prototype. Observations and next steps are presented in section 6. 2
ISBSG International Repository
In the mid-1990s, various national software measurement associations got together to address the limitations of alternatives 1 to 4, specifically to overcome the problems of both the availability and the transparency of data for estimation and benchmarking purposes and to offer the software community a more comprehensive alternative in the form of a publicly available multiorganizational data repository. This led to the formation of the International
A. Abran, R. Braungarten, R. R. Dumke
220
Software Benchmarking Standards Group (ISBSG) [10] whose goal is the development and management of a multi-organizational repository of software project data. The ISBSG organization collects voluntarily provided project data (Functional Size, Work Effort, Project Elapsed Time, etc.) from the industry, concealing the source and compiling the data into a database. By mid-2003, this repository contained over 2000 projects. It is now available to organizations, for a minimal fee, and any organization can use it for estimation purposes. For instance, such a repository can also be used to assess software estimation tools already on the market [3]. 3 3.1
White box to estimation White-box approach
The white-box approach to estimation consists of the analysis of a data set for which all the data points are available, and the statistical models of which can be analyzed both graphically and through the results of statistical tests. For a white-box approach, it is necessary to have access to the full data set: access to each of the individual data points allows both visual analysis of the data sets and, for instance, the investigation of obvious outliers to interpret the results in the empirical context of size intervals. 3.2
Statistical approach
For the prototypes, the linear regression technique was selected to build the estimation models over more complex estimation techniques such as analogybased and neural network techniques which have not been shown to better explain the size-effort relationship in software projects on the types of data sets available for such studies, including multi-organizational data sets [5,6]. Furthermore, linear regression models are better known by practitioners and simpler to understand and use. Many software engineering data sets are heterogeneous, have wedge-shaped distributions [1,2,3,9,10,12] and can, of course, have outliers which have an impact on the construction of the models and on their performance. Therefore, any sample selected needs to be analyzed for the presence of outliers, as well as for visually recognizable point patterns which could provide an indication that a single, simple linear representation would not be a good representation of the data set: for instance, a set of projects within an interval of functional size might demonstrate one behavior with respect to effort, and the same set of projects within another size interval a different one. If such recognizable patterns are
Web-based Support for White Box Software Estimation
221
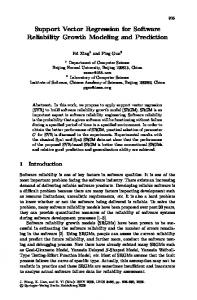
identified, then the sample should be sub-divided into two smaller samples - if there are enough data points, of course. Both the samples with outliers and those without them should be analyzed. The visual analysis provides another clue. The following example is provided in [3]: A visual analysis of Figure 1a) indicates that there are two candidate outliers which might have an undue impact on the regression model: the data point with almost 1,000 Function Points (FP) [4] has a corresponding level of effort which is much smaller than that of many projects of much smaller functional size, and a project with 3,700 FP is almost three times as large as the majority of the projects. Two different groups can be identified: one subset of projects between 20 and 620 FP, with a good sample size of 30 observations (Figure 1b), and the other a more sparsely populated subset of 9 projects between 621 and 3700 FP, a much larger size interval (Figure 1c). It can then be observed visually that in the sample of projects with functional size between 20 FP and 620 FP there is a relationship between the independent and dependent variables: its estimation model (Figure 1b) is Y = 6.135 x FP + 265 with an R² = 0.475. In this model, the constant = 265 hours could represent the fixed cost of setting up the projects within this size interval, the positive slope then corresponding to the variable cost which is dependent on the size of the projects. For projects larger that 620 FP in size (Figure 1c), the estimation model is Y = 10.539 x FP – 1404 with R² = 0.74, but, with only 9 data points, caution must be exercised in interpreting the data. For the smaller range, the constant of the regression line is positive; for this larger size interval, the constant of the equation is negative (-1404 hours), which is, of course, counter-intuitive. This means in particular that there should not be an extrapolation of the model outside the range of values from which it was derived (that is, it is not valid for projects smaller than 621 FP). Natural
y = 10,053x - 648,91 2
Effort (Hours)
R = 0,8577 40000 30000 20000 10000 0 0
1000
2000
3000
4000
Size (FP)
1a) N = 41 (includes outliers)
A. Abran, R. Braungarten, R. R. Dumke
222
Natural [20, 620]
y = 6,1355x + 264,98 R2 = 0,475
6000 4000 2000 0 0
200
400
600
800
Size (FP)
Effort (PHR)
1b) size < 620FP (n=30)
40000
Natural [621, 3500] y = 10,539x - 1404,9 2 R = 0,7424
20000 0 0
1000
2000
3000
4000
Taille (FP)
1c) size > 620FP (N=9) Figure 1: Regression analyses - projects in NATURAL This study [3] also highlights the fact that in this ISBSG multi-organizational data set there is, for each sample and by programming language, a different sizeeffort relationship, and the strength of this relationship differs. The directly derived models performed as well as models built by other researchers for smaller and older multi-organizational data sets ? 6? under similar conditions, as well as for more recent software applications: for some programming languages, the relationship of the models is within the range reported in the literature for multi-organizational data sets (that is, R2 around 0.40) without any indication of their programming languages. 3.3
Prototype approach
Without visualization, the results obtained from estimation tools can be somewhat of a mystery to practitioners and have at times been referred to as “black-box” estimations [3]. The “white box” estimation prototypes we have developed greatly alleviates this problem. The first generation of prototypes was built as a proof-of-concept for the whitebox approach to software estimation. It was based on a business model which must take into account that, while the ISBSB data can be purchased from ISBSG, this international organization retains the copyrights to these data and does not permit purchasers to resell their data set, thereby protecting the business value of their repository. This data constrains the deployment of this
Web-based Support for White Box Software Estimation
223
stand-alone prototype, as potential acquirers are required to purchase the ISBSG data set as well as the software itself. A new business model was explored in our second generation of Web-based prototypes: in this new model, it was the estimation features themselves, provided by the white-box prototypes, which would be marketed through the Web, rather that the data or the software. This meant that the pricing policy would based on the number of requests for estimation, without the obligation of paying for the full data set or for the software itself. It also meant that users would not need to worry about software upgrades or further repository releases. This paper reports on two prototypes developed to implement the second generation of white box estimation software. Both prototypes have been implemented as a Java Applet in a “Web-based” Client / Server configuration using a database server and a Java client. Project work effort and duration are estimated by computing a linear regression line and a prediction interval which depend on the result of a database query with the parameters selected by the users of the white box estimation tool. 4
First Web-based prototype
4.1
Architecture
The first Web-based prototype was designed and implemented as an application server model with three tiers. It was programmed as a “Web-based” Java-Applet in a Distributed System using Java (Sun Corporation) and its Remote Method Invocation (RMI) counterpart to the Remote Procedure Calls (RPC), [Figure 2]. CLIENT
GUI, computation, visualization
SERVER
Database logic (I/O)
low bandwidth Network high bandwidth Network DB-SERVER
DBs: User (MySQL), ISBSG (MS Access)
Figure 2: Distributed System with Java RMI [7] Because it consists of three layers, the architecture of the application server approach is called a “3-tier” system [7], (Figure 3).
A. Abran, R. Braungarten, R. R. Dumke
224 CLIENT
SERVER ISBSG data
Skel-eton
Stub
Remote object
user data
RMI Remote Reference Layer Transport Layer
Figure 3: 3-tier Architecture [6] The first tier, containing the database-server only, handles queries for the data stored on the server: the user database is used to manage the login and billing process, while the ISBSG database is used to manage queries about project data. Since the project data and user data were stored in different database formats (Microsoft Access file and MySQL database), two different connection managers had to be used: Java Database Connectivity (JDBC) and Open Database Connectivity (ODBC). This is, of course, a handicap in terms of moving the prototype and all its data from the Windows test and development environment to a real, professional production server with a different runtime environment and operating system (Linux). The server tier (application server) is connected via a high-bandwidth network. It is to be noted that the boundaries between the various layers are logical ones. The application server provides only the database logic, that is, inputs and outputs, and protects the data from direct access by the client. In more heavyweight applications, this tier is also the home of business objects, implementing the customer’s business rules. Via low bandwidth network connections, the last tier, called the client-tier, communicates with the server. It is responsible for visualization of the data received from the subjacent layer, and handling user events via its Graphical User Interface (GUI). 4.2
Mode of operation
Users have to log in to start the estimations. Access is only granted when there are enough remaining credit points; such points are decreased by one unit for every database query or computation. Once a user is logged in, he selects the parameters of interest to him: development language, development platform and quality rating, as well as a range of functional size. The parameters selected are used for the database query and computations. Computation results [13] are
Web-based Support for White Box Software Estimation
225
presented in Figure 4, in both table and scatter-plot format, with Work Effort or Duration displayed (Y-axis) depending on the number of Function Points (Xaxis).
Figure 4: Stand-alone Prototype A linear regression line, its equation and R² are displayed, using the least squares method of statistics. Depending on the confidence interval selected and the expected size of the project to be estimated, the estimated Effort (or Duration), its prediction interval and the prediction bounds are plotted. The user can analyze the impact of outliers by using the select/unselect option to delete some data from the sample he is analyzing, and asking the prototype to recompute the estimation results. In the table at the bottom of the display screen, the lower, estimated and upper values for the dependent variables (Project Work Effort, Elapsed Time, Delivery
A. Abran, R. Braungarten, R. R. Dumke
226
Rate and Speed of Delivery) are given, together with the number of projects in the sample selected and taken into account in the regression model. 5
Second Web-based prototype
5.1 Additional requirements Of course, as a proof-of-concept, robustness had to be added to the first prototype. Furthermore, the first prototype was built using release 7 of the ISBSG repository. However, not only does ISBSG publish updated versions of its repository at irregular intervals, but also modifies, for various reasons, the data structures of the data set made available with each successive release (for instance, new fields for added data variables). In addition to improvements to the management of user accounts, more sophisticated visualization features were recommended to permit the construction of multiple estimation models by selecting ranges of data points from the same sample, as illustrated in Figures 1a) to 1c). 5.2
Architectural Changes
To downsize the Applet from its complex RMI implementation, a “2-tier” architecture was implemented (Figure 5). CLIENT
SERVER
GUI, computation, visualization, database logic (I/O) DBs:
User (MySQL), ISBSG (MySQL)
Figure 5: 2-tier architecture [7] 2-tier systems are in widespread use, because of the quality and low cost of the tools and middleware and because of well-integrated personal computer tools like VBS. However, most of the server-sided tools are more expensive and do not offer the same potential in Rapid-Application-Development (RAD) as client-sided tools do. More lightweight applications like this Applet can be produced very easily and in a shorter time period using this technology. The basis for the second Web-based prototype is formed by only two different logical layers, whereas the first one had all its business and database logics as well as the data itself on each host system (1-tier system).
Web-based Support for White Box Software Estimation
227
The first tier is the server, which provides the user and the ISBSG project databases and uses only MySQL. The second is the client tier, which provides the GUI, the database logics, all the computations and the subsequent visualization (Figure 6).
ISBSG data
user data
SERVER business object
CLIENT
Figure 6: Distributed System - 2nd Prototype [8] 5.3
Functional changes
The first functional change improved the “Look & Feel” of the Applet. The Java Foundation SWING classes were used: they represent a kind of framework [8] and provide easy black-box reuse of predefined GUI-components. See Figure 7.
Figure 7: GUI-driven user administration
A. Abran, R. Braungarten, R. R. Dumke
228
Furthermore, the ISBSG database situated in the Microsoft Access file was moved over to the MySQL database, as was the newest version of the ISBSG data (2003, release 8). The estimation features were enhanced to provide users with the facility to build multiple estimation models from the same sample, as described in [3]. For instance, in this second prototype, a user, after a graphical analysis of the sample he selected, can divide the X-axis into ranges of functional sizes (i.e. intervals) to obtain distinct regression models for each size range. Of course, the linear regression curve, associated equation and R² are provided for every scatter plot (Figure 8). Finally, to improve the management of user accounts, a Java GUIdriven user database handler was implemented to delete a user, add a user or alter the user settings from the GUI instead of direct typewriting at a terminal (Figure 9).
Figure 8: Estimation features – 2nd Web-based prototype 6
Limitations and next steps
This white box, Web-based estimation prototype is being used for educational purposes at the ÉTS at both the Bachelor’s and Master’s degree level to teach
Web-based Support for White Box Software Estimation
229
students about data analysis and estimation. It is also being used to promote the ISBSG repository to industry and to request contributions of projects from them. Research work is ongoing to improve the features of this prototype, such as that outlined below. The architectural change from 3-tier to 2-tier has made the tool less complex and easier to maintain, but has rendered it vulnerable to unauthorized data access [6]: Since the database logic is part of the client-side application, a resourceful user could, after some Reverse Engineering, decompile in plain text the files containing the database access data. A tentative solution would be to sniff the network traffic for the access data that is being submitted by the JDBC driver in plain text. Such a security threat was not possible with the three-tier architecture, as the third logical layer provided security – through to local access - for a database query carried out and provided by the RMI server application.
Figure 9: GUI-driven user administration Additional visualization features are being investigated to facilitate both the identification of outliers and the semi-automated selection of sub-samples. Such improvements and enhancements could provide us with additional insights into the estimation issues and contribute to improving software estimation training.
A. Abran, R. Braungarten, R. R. Dumke
230
Finally, a candidate enhancement could be to re-instate a 3-tier architecture using a different technology [7] like PHP, JSP or Servlets, rather than the load?causing Java RMI, which has revealed security weaknesses. Acknowledgments The development of both Web-based prototypes was carried out in cooperation with ÉTS Montréal (Canada), Otto-von-Guericke University Magdeburg (Germany) and ISBSG. The authors would like to thank Christian Kolbe for the development of the first Web-based prototype, and Christian Kolbe, René Köppel and Martin Kunz for their assistance with the second prototype.
References 1.
A. Abran and P.N. Robillard, “Function Points Analysis: An Empirical Study of its Measurement Processes,” IEEE Transactions on Software Engineering, Vol. 22, no 12, 1996, pp. 895-909.
2.
A. Abran, I. Silva and L. Primera, Field studies using functional size measurement in building estimation models for software maintenance, Journal of Software Maintenance: Research and Practice, Vol. 14, pp. 3164, (2002).
3.
A. Abran, I. Ndiaye and P.Bourque, "Contribution of Software Size in Effort Estimation", submitted for publication, Journal of Software Quality (2003).
4.
A. J. Albrecht and J. E. Gaffney Jr., Software Function, Source Lines of Code and Development Effort Prediction: A Software Science Validation, IEEE Tr. on Soft. Eng., SE-9, 639-647 (1983).
5.
L.C. Briand, T. Langley and I. Wieczorek., 2000, “A Replicated Assessment of Common Software Cost Estimation Techniques,” International Conference on Software Engineering - ICSE, Limerick, 2000, pp. 377-386.
6.
J.J. Dolado, “On the Problem of the Software Cost Function,” Information and Software Technology, Elsevier Ed., Vol. 43, No. 1, January 2001, pp 61-72.
Web-based Support for White Box Software Estimation
231
7
R. Dumke, Lecture scripts on “Web Engineering,” http://ivs.cs.unimagdeburg.de/~dumke/HSkript/WebPlan.html, OvG – University Magdeburg / Germany (1994–2003).
8.
R. Dumke, Lecture scripts on “Distributed Systems,” http://ivs.cs.unimagdeburg.de/~dumke/STV/STVplan.html, OvG – University Magdeburg / Germany (1994–2003)
9
C.F. Kemerer, “An Empirical Validation of Software Cost Estimation Models,” Communications of the ACM, Vol. 30, no 5, May 1987.
10. ISBSG, "Estimating, Benchmarking and Research Suite (Release 8)"; International Software Benchmarking Standards Group, Warrandyte, Victoria (Australia), 2003 http://www.isbsg.org.au/ 11. G. Paul, Lecture on “Development of computer-supported engineering systems,” http://wwwiti.cs.uni-magdeburg.de/iti_ti/ETISMat/Kapitelneugesamt6_6_01.pdf, OvG – University Magdeburg / Germany (2000-2003). 12
B.A Kitchenham and N.R. Taylor, “Software Cost Models,” ICL Technical Journal, Vol. 4, no 1, May 1984, pp. 73-102. ¨
13
N. A. Weiss and M. J. Hasset, Introductory Statistics (3rd Edition), Addison-Wesley Publishing, 600-651 (1991).