Web-based Visualization Framework for Decision-making in ...
Recommend Documents
which ships entering a port where infectious disease ... form of deprivation of liberty that can be used .... ship similar to the biomedical model.â23(p84) Risk is ...
authors for purposes of information and discussion. They ..... It is important that the sample households be presented with the best information possible about ... Other expected cost impacts would have to be described, as well. .... us a foreshadowi
hierarchies. FSN [22] and Information Pyramids [1] exploit the metaphor of .... network of neurons typically arranged on a regular lattice. Each cell is associated ...
Nov 25, 2004 - URL http://www.cs.hut.fi/english.html. This is an ... 2.2.2 Validation . ...... Validator visual components. Set of valid. Layout. Representation.
ing predictive model of user's behavior from the sensed data ... realizes flexible analysis of behavior history using visual language. We also introduce several visualizations on the ... a visual programming interface, so that users can develop.
Mar 8, 1999 - plans [59], and animal behaviors [83]. Traditional scientific ...... FOCUS [93], a graphical financial spreadsheet called FINESSE [104]. ..... The first command adds the geometric contents in cells 2_1, 2_2, and 3_1, 3_2 ...
May 4, 2012 ... to create a functional framework to evaluate the suitability of VA ... This framework
can guide the development process of such ..... 6.1.1 Fixed-Income Visual
Analysis Dashboard . ..... business intelligence in mind, such as Xcelsi
Nov 25, 2004 - It can be found in Adobe Portable Document Format ..... the learner solves problems related to graph algorithms and receives a graphical illus-.
ID analysts monitor network activity using an IDS for evidence of .... systems, from simple âpingsâ to determine if a server is listening to ... Window size. Length of ...
gLucifer: next generation visualization framework for high-performance computational geodynamics. Dave R. Stegman à Louis Moresi à Robert Turnbull à ...
Anita Komlodi, John R. Goodall, Wayne G. Lutters. Department of Information Systems, UMBC .... Data urgent Pointer. Table 3. IDS alert data attributes for ...
Clinical trial registration. ACTRN12610000279022. Declarations of interest. None. Acknowledgements. We thank Professor John Attia, Dr Elizabeth Murray, and.
13 Feb 2013 ... -clinical teaching & competency exam SOFTWARE (CDROM or Web. Versions) ...
system. -Medical education administration SOFTWARE for administration of ... -
import unlimited questions, up to 10 answer choices, to password-protected ....
Jan 15, 1988 - international body (the International Atomic Energy Agency) ; and the very different ..... State Auto Ins
Technologies for Formative Assessment 2. Abstract. Quizzing has traditionally been viewed by students as a negative aspe
feedback format for all students. ... student submitted assignments in HTML format which were then .... as email, electronic communication applications or ftp.
Jan 15, 1988 - safety in the Soviet nuclear power program and the proposal of new ...... Army Radiologist," Environmenta
hydraulic leak on the third Auxiliary Power Unit. The first event, the Water Spray Boiler freeze-up, was detected by Mech based on reviewing his data screens, ...
The Roofline model [9] enables programmers to visualize the performance po- tential of algorithms ... fraction of the potential peak (dark blue line vs orange horizontal line) unless it also has ... strong support for it in Java and Python. In additi
from Edward Hutchins implies, MWSs is also an appropriate designation for ..... Render, Richard Cook, Patricia Ebright, Stoney Trent, Martin. Voshell, and ...
readability, a free, easy-to-use online com- puter program was employed (http://www. online-utility.org): the URL of each website was copied and pasted into this ...
package. Addiction 1994; 89: 563â72. 23. Thomas B. A., McCambridge J. Comparative psychometric study of a range of hazardous drinking measures adminis-.
base agents in our multi-agent based economic landscape (MABEL) model. ...... of linear equations among variables (Bordley and LiCalzi, 2000; Vernon, 1985;.
James C. Miller. Air Force ..... Norwood,. NJ: Ablex Publishing Corporation.Coovert, M., Riddle, D., Gordon, T., Miles, D., Hoffman, K.,. King, T., Elliott, L., Schiflett, ...
Web-based Visualization Framework for Decision-making in ...
and 2) the development of the web-based framework that enables a linked representation of .... custom machined parts capable of being produced on NC (Numerical .... languages (e.g. PERL, PHP, and ASP) have been used in this work to ...
Web-based Visualization Framework for Decision-making in Multidisciplinary Design Optimization
G. Agrawal, et al
Web-based Visualization Framework for Decision-making in Multidisciplinary Design Optimization 1
2
3
4
G. Agrawal , S. Parashar , K. W. English , and C. L. Bloebaum Department of Mechanical and Aerospace Engineering University at Buffalo, The State University of New York Buffalo, NY, 14260 Phone: (716) 645-2685 Fax: (716) 645-2684
The design, analysis, and optimization of complex systems, including aircraft, microchips, and chemical plants, is increasingly being performed using widely distributed, but inter-dependent, design groups. Research in Multidisciplinary Design Optimization (MDO) has resulted in a wide variety of tools and techniques to assist in the analysis and optimization of these highly complex systems. Visualization is increasingly being used in MDO to improve the product design by assisting designers in their decision-making processes. Visualization provides a means by which a designer can interact more intuitively with his specific design problem. A barrier to sharing visual models amongst designers from different disciplines is the use of diverse computing platforms to accomplish their tasks. Since the design groups are often separated geographically, a web-based design environment that allows collaboration among designers on different platforms is preferred. This work focuses on the development of a platform-independent visualization framework, called the MDO FAD (Framework for Analysis and Design), to assist designers in their decision-making while solving MDO problems. Two key challenges here include: 1) the development of an underlying data architecture for MDO problems that will facilitate the complex design process; and 2) the development of the web-based framework that enables a linked representation of both the product and the associated analysis to better enable design tradeoffs. An XML-based data architecture is developed here that can be applied to MDO problems by combining optimization data and analysis data into a platform-independent format. The format can be used as a foundation for development of distributed MDO tools by governing data exchange between disciplinary analysis tools, optimizers, and user interfaces. A physical representation of the design artifact (i.e. product), along with a linked Dependency Structure Matrix (DSM) that represents coupled analysis modules, is generated as part of the tool. Using this interface, a designer can view and interact with components or subsystems being impacted by changes in other components or subsystems by means of visual cues. The development of an
1
Research Assistant, [email protected] Research Assistant, [email protected] 3 Deputy Director, New York State Center for Engineering Design and Industrial Innovation, [email protected] 4 Professor for Competitive Product and Process Design and ASME Member, [email protected] 2
Submitted for review to ASME Journal of Computing and Information Science in Engineering
Page 1/29
Web-based Visualization Framework for Decision-making in Multidisciplinary Design Optimization
G. Agrawal, et al
intuitive interface allows a designer to more effectively trade off accuracy and efficiency in an easy fashion. In addition, using the representation of the product being designed, the designer can better comprehend the impact that changes in a component will have on the overall physical system. The methodology is demonstrated using a modified Golinski’s speed reducer design problem as well as a pipeline design problem.
Keywords:
Web-based framework, geographically distributed design, platform-independent data architecture,
technology integration
NOMENCLATURE b d1 d2 Dp1 Fr r Kg Kg1 Kg2 l1 l2 Pd m np q T w1 x z -
Face width of gear (x1 ) Diameter of shaft 1 (x6 ) Diameter of shaft 2 (x7 ) Bore diameter for pinion Radial load from gear Transmission ratio Permissible bending stress of gear teeth Permissible bending stress for shaft 1 Permissible bending stress for shaft 2 Length of shaft 1 (x4 ) Length of shaft 2 (x5 ) Permissible surface compressive stress Module (x2 ) Pinion shaft speed Tooth form factor Transmission power Weight of pinion Design variable vector (x1 -x7 ) Number of pinion teeth (x3 )
1 INTRODUCTION The increase in available Information Technology (IT) resources now allows products to be more rigorously modeled and analyzed earlier in the design process than ever before. Developing the capability to provide more accurate analysis models supports the goal of enabling designers to exploit trade-off opportunities earlier in the design process. By pushing these trade-off activities to an earlier point in the design process, designers have more freedom to alter the overall design of a product with less of an impact on the overall cost of producing that product.
Submitted for review to ASME Journal of Computing and Information Science in Engineering
Page 2/29
Web-based Visualization Framework for Decision-making in Multidisciplinary Design Optimization
G. Agrawal, et al
The understanding of the impact of interactions between subsystems is especially critical in the Multidisciplinary Design Optimization (MDO) field [1]. Research in MDO pertains to the development of methods and techniques that increase solution efficiency and efficacy in a product design process in which multiple disciplines interact. These interactions may be in different phases of a product’s life cycle (e.g. design, manufacture, maintenance) or between different functional groups at any point in the design process. For designers of large and highly complex products such as airplanes, automobiles, and chemical plants, the ultimate goal of implementing a formal optimization on the entire product has not yet been achieved due to the incredibly large computational demands. While an all-encompassing optimization capability is not yet practical for these large complex products, methodologies have been developed to provide designers with metrics that correspond to the impact that design changes will have on time and cost of the process, thereby enabling a reduction in cost and time. The impact of proposed changes to a product design must be effectively shared in a collaborative environment in the same way that design information is passed amongst design groups. Designers must be able to quantify the impact of a change in one component’s design on the overall product by sharing information between different disciplinary groups. The ability of design teams to perform trade-off activities also depends heavily on the techniques used to share the detailed design data amongst different groups. The sharing of data couples the different analyses together, providing designers with a better understanding of the product, but at the expense of increased iteration in the analysis required to evaluate a product’s metrics (i.e. objective functions and/or constraints). Effective communication is one of the several requirements that exist for a framework to provide an easy-to-use and robust MDO environment. The ultimate goal of data sharing in this context is real-time collaboration. As computing capabilities continue to grow, more detailed analysis information becomes available to designers. This increase in information availability makes the communication between geographically distributed teams even more difficult due to the varying nature and sheer volume of data to manage. In order to enable disparate groups to understand the impact of proposed changes to a product design in an MDO context, an easy-to-understand platform-independent and extensible infrastructure is required, along with an effective means to share different design data. In this paper, a web-based visualization framework is developed (the MDO FAD), with an underlying XML-based data architecture, that enables combining optimization data and analysis data into a platform-independent format. The resulting web-based visualization framework with the associated data architecture facilitates decision-making for designers in a complex product design process.
Submitted for review to ASME Journal of Computing and Information Science in Engineering
Page 3/29
Web-based Visualization Framework for Decision-making in Multidisciplinary Design Optimization
G. Agrawal, et al
In the next section, a brief background on Extensible Markup Language (XML) is provided to demonstrate some issues pertaining to data exchange. In section 3, a brief background is provided on some visualization tools that have been developed in the MDO field to better enable design decisions, particularly in a distributed design environment. Section 4 outlines the method developed here to create a web-based representation of the physical artifact being designed, while section 5 presents the MDO XML data structure developed to enable cross-platform and interdisciplinary data exchange. Section 6 ties the two concepts of data structure and interactive visual design representation together with a description of the platform-independent design framework (MDO FAD) developed in this work. Section 7 demonstrates the use of the MDO FAD on two MDO problems, followed by a section that makes conclusions about the work.
2
EXTENSIBLE MARKUP LANGUAGE Very few researchers in MDO have focused on the issue of data exchange formats. Yoder and Brockman [2]
developed a computing framework for MDO that coordinates the passing of data among designers while the design process proceeds towards the optimum point. This architecture is focused towards defining, capturing and preparing an MDO problem and managing the solution process by sequencing the analysis and optimization algorithms. This architecture does not directly address the need for visualizing the physical system for critical decision-making; and neither does it address the data handling aspect of MDO. The Technical Data Modeler & Browser (TDMB) [3], developed by British Aerospace, manages and structures multidisciplinary data in a hierarchical fashion for aircraft sizing, making data available to different disciplines. However, TDMB does not address extensibility to generic MDO problems, or the integration of data with different analysis and optimization tools for collaborative and platform-independent MDO implementation. The development of databases and data flow standards for MDO and its implementation in a geographically distributed design environment using the World Wide Web (WWW) have been identified as requirements for an MDO framework [4]. Standard rules and formats for data management would enhance the communication speed, reduce errors, and reduce the cycle time, as well as build a foundation for future MDO work. The unfortunate reality is that visualization and design tools that have been developed in MDO have all been developed independently, using different internal data formats. Developing a data structure for sharing information between applications that is based on web-supported neutral data standards promises to provide a better way to
Submitted for review to ASME Journal of Computing and Information Science in Engineering
Page 4/29
Web-based Visualization Framework for Decision-making in Multidisciplinary Design Optimization
G. Agrawal, et al
collaboratively apply various tools to MDO problems. In this work, we suggest the use of Extensible Markup Language (XML) as a foundation for a data structure for MDO. Extensible Markup Language (XML) [5] is a self-describing, structured, and flexible text -based data format that is widely used for the exchange of a variety of data on the web. Using XML, data can be structured in a selfdescribing manner, allowing users not familiar with the structure of the data to easily access information. For example, consider Fig. 1, which contrasts the traditional technique of storing data with the XML-based technique, using an example involving employee information for a company. It can be seen from the figure that if this data were provided to someone unfamiliar with the format, it would not be clear from the traditional data format whether the 29 was for age, years of service, or some other value. The XML format makes these distinctions clear, even to people who are completely unfamiliar with XML. Traditional Format: John Smith, 29, Manufacturing, Manager XML Structure: John Smith 29 Manufacturing Manager
Fig 1 Sample XML Data Structure
The tags, which are used to delimit the information contained within an XML file, consist of a word enclosed by less than and greater than symbols (e.g. , , ). A closing tag is differentiated from an opening tag through the use of a slash preceding the tag name (e.g. ). Tags typically describe the data contained within them, hence, the self-describing nature of XML-based data. Tags can be determined by the user or provided by a developed standard, which allows the development of application-specific data structures. This freedom avoids the difficulties in understanding data semantics that are encountered when trying to force data to fit into an existing format (i.e. using HTML tags to transfer data). The structure and types of data that tags encapsulate is defined in a schema, which is a document that defines a standard that can be used to generate XML data files. Typically, schema are developed for specific domains, including music, chemistry, and math. This allows development of domain-specific applications based on common data formats without requiring the purchase of
Submitted for review to ASME Journal of Computing and Information Science in Engineering
Page 5/29
Web-based Visualization Framework for Decision-making in Multidisciplinary Design Optimization
G. Agrawal, et al
commercial software to generate the data [6]. This platform independence and self-describing nature comes at a price, however. Due to the self-describing nature of XML, XML data structures are much larger than application specific and proprietary data formats, resulting in larger files size and longer transmission times when exchanging data. This expense must be balanced against the benefits of sharing data amongst a wide array of users. Internet compatible and domain-specific data exchange formats have been developed for various applications and areas. For instance, Numerical Control Markup Language (NCML) [6] is an XML-based internet compatible data exchange format for Custom Machined Parts. NCML allows the exchange of information between buyers and sellers of custom machined parts capable of being produced on NC (Numerical Controlled) machines. XML-based data transfer over web is also widely used in areas including banking, geology, and engineering. The growth of XML use in web-based data transfer makes it a natural choice in developing a platform-independent, extensible data exchange format for MDO problems. One aspect of the research in this paper focuses on the development of an XML-based data architecture that could be applied to MDO problems by combining optimization data and analysis data into a single platform-independent format. The format can be used as a foundation for development of distributed MDO tools by governing the data exchange between disciplinary analysis tools, optimizers, and user interfaces, including Internet-based collaborative design tools and techniques. Some of the visualization tools that have been developed in MDO are described in the next section, with a more significant description provided for the tool that is incorporated in this work (i.e. the VDSM).
3
VISUALIZATION TOOLS IN MDO The development of a geographically distributed design environment using the World Wide Web (WWW), along
with the development of databases and data flow standards for MDO, has been identified as a critical requirement for an MDO framework. This has also been considered a requirement for the practical industrial application of MDO, particularly in a large industry setting [4]. Many tools have been developed in MDO to help facilitate the comp lex design process. Some of these have focused on web-based infrastructures to enable geographically distributed design teams to collaborate more easily. An overview of web-based infrastructures was presented in [7], with some specific web-based collaborative frameworks including those in references [8-14]. With respect to MDO applications, Shen and Ghenniwa [15] integrated the Internet, the Web, and an agent-orientated design paradigm to create an environment for
Submitted for review to ASME Journal of Computing and Information Science in Engineering
Page 6/29
Web-based Visualization Framework for Decision-making in Multidisciplinary Design Optimization
G. Agrawal, et al
interdisciplinary collaboration, where agents help to provide greater autonomy, while still enabling designer interaction.
CAPRI (Computational Analysis Programming Interface) was developed to provide a flexible
framework to enable communication between optimization and CAD models [16]. Winer and Bloebaum developed the Geographic Independent Virtual Environment (GIVE) [17] which enables real-time, platform-independent interaction for MDO designers, with an associated chat interface and design tracking capabilities. GIVE was designed to handle any kind of file, including graphics, text, word, or even VRML files, thereby enabling the use of visual representations during the collaborative design process. Another area of development has focused on incorporating visualization into multiobjective optimization tools for MDO problems, thereby better enabling the choice of final design concepts to be developed. Examples here include Cloud Visualization [18], visualization in support of the Shopping Paradigm [19], a visualization interface for Physical Programming [20], MOPCSSOViz [21], and the Hyper-Pareto Frontier visualization approach [22], amongst others. A key area in which visualization has been used in the complex design process is to visually represent the incredibly large amounts of data being produced in an intuitive and easy to understand manner. Graph Morphing [23-25] was developed to enable the designer to understand how changes in design variables impact the ndimensional optimal design space. Vizcraft [26] uses parallel coordinates to visualize design metrics for application to a high speed civil transport. The MultiDisciplinary Computing Environment (MDICE) [27] provides designers with visual representations of the simulations in the analysis, while the Visual Computing Environment [28] provides visual representations of the couplings between analysis codes involved in the system analysis of an MDO problem. Similarly, Rogers’ DeMAID [29] was one of the first tools developed to represent coupled analyses in an MDO environment, based on a Dependency Structure Matrix (DSM) [30] representation of the problem. It also provided a means for reorganizing analyses or tasks so as to reduce time and cost in complex design process [31]. What most of these tools are missing is the ability to link analysis representations to design decisions pertaining to the actual product. One of the key contributions of this work, in addition to the development of a proposed MDO Data Exchange format, is a web-based collaborative tool that couples an interactive representation of the design artifact (i.e. CAD model of the product) with a representation of the complex analysis required to develop that product.
Submitted for review to ASME Journal of Computing and Information Science in Engineering
Page 7/29
Web-based Visualization Framework for Decision-making in Multidisciplinary Design Optimization
G. Agrawal, et al
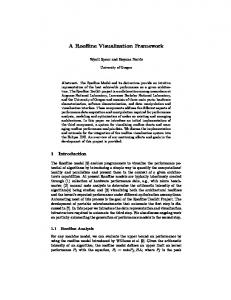
A particularly useful tool that has been developed in the MDO community is the Visual Dependency Structure Matrix (VDSM) [32], which provides insight into individual aspects of complex design problems by means of a DSM representation of the problem using a web-based interface. We will use the VDSM as a foundation for the MDO FAD tool developed here. In the VDSM representation, sub-problems (also referred to as modules), which may be analyses or tasks, are shown as numbered boxes on the diagonal display with couplings between them, as shown in Fig 2. The impact that analysis outputs have on each subsystem and the overall design is quantified and conveyed to the designers using different visual cues such as color, transparency, and depth, as well as tables of data. In Fig. 2, for example, we see a coupled analysis problem with ten subsystem analyses. The feed forwards appear in the upper right, and denote a feed of information from an analysis that has already been performed to one awaiting implementation. A feedback, shown in the lower left, denotes a need for information (i.e. data) from an analysis that has not yet been implemented. It is the feedbacks that represent iteration in a complex system analysis.
Fig. 2 Visual Dependency Structure Matrix The colors of the modules in Fig. 2 represent the cost associated with implementing a particular module (e.g. analysis or task), while the depth denotes the time associated with that implementation. Additionally, the strength of the couplings between any two modules is identified by color and depth, according to the local or global impact on the design problem. In the VDSM representation, a low fidelity VRML (Virtual Reality Modeling Language) [33] model has been developed. VRML models are easy to create and can be conveniently transmitted over the web (due to reasonably moderate file sizes) to browsers, where readily available plug-ins (e.g., Cortona [34] and Cosmoplayer [35]) load the
Submitted for review to ASME Journal of Computing and Information Science in Engineering
Page 8/29
Web-based Visualization Framework for Decision-making in Multidisciplinary Design Optimization
G. Agrawal, et al
data and render it in a three-dimensional layout. VRML is supported by most web browsers (by means of plug-ins) and is platform independent. A more detailed description of the VDSM is provided in [32]. As previously mentioned, what has not yet been developed is an approach that ties the changes in the VDSM to changes in the design artifact, and vice versa. This is the key development of the work in this paper. The VDSM representation does not show what physical components of the actual design are impacted by different analysis outputs, as it represents the analysis or task modules only. Although a VDSM could be constructed to represent the physical components of a product and their physical interfaces, this would not necessarily help to represent the process used to design the components. Additionally, by using representations of physical components, information could be displayed in a more instinctive manner than through the use of interconnected blocks, spheres, and cylinders as in the VDSM, providing a more effective interface to convey the impact of design changes. Such an approach would offer the potential of a more intuitive interface for demonstrating the impact of design changes. It is this development of an interactive design structure matrix representing the complex analysis associated with the design process, coupled to a representation of the physical artifact being designed that is the focus of this work.
4
AN INTERACTIVE WEB -BASED REPRESENTATION OF A PHYSICAL SYSTEM In order to present design impact data in a platform and geographically independent context, an approach must
be developed to enable the extraction of CAD geometries from existing models and allow these models to then be coupled with design sensitivity data. Much work has been performed in recent years to develop platform and geographically independent techniques of viewing CAD geometries (e.g. PTC’s ProductView Express [46]), but the current approaches focus on the geometry alone, and do not develop a means to couple design sensitivity data with geometry data during early design phases. We assume here that a three-dimensional CAD package will be used to generate a preliminary model. As this is standard industrial practice, this is a reasonable assumption. Each CAD package typically has its own proprietary data formats which are compatible to the package itself, as well as the ability to export geometry information to a variety of formats. Most CAD packages export in a range of 3D formats (e.g., IGES [47], STEP [48], and VRML) that the designers can visualize using product specific viewers. Only VRML is accessible via the World Wide Web. Major CAD software vendors have started to make applications that can be used as a plug-in for web-browsers, which enables viewing and manipulation of parts and assemblies in a web-based framework. In order to support
Submitted for review to ASME Journal of Computing and Information Science in Engineering
Page 9/29
Web-based Visualization Framework for Decision-making in Multidisciplinary Design Optimization
G. Agrawal, et al
web-based viewing, the output of the CAD package must be captured in a format that could be easily transferred over the web (i.e. the file size should be reasonably small). However, the use of proprietary output formats for webbased plug-ins restricts the amount of additional data that can be included with the model and may restrict the supported platforms (i.e. Windows, Linux, and Mac) to a small subset. Moreover, since these formats are not usually text -based, it is difficult to integrate them into a larger web-based methodology. As background, the Extensible Graphics Language (XGL) has been developed as a means of compactly expressing 3D models in a platform independent manner [36]. XGL could be easily implemented in a textual XML (Extensible Markup Language) format which is widely being used for the exchange of variety data over the Internet and is easy to transfer over the web [37]. However, since CAD vendors do not currently support export into the XGL format, this becomes an unusable approach for this work. In contrast, the approach used in this work is to take advantage of the VRML export capability of most CAD packages [33]. As previously explained, VRML files are easy to create and can be conveniently transmitted over the web (because of reasonably moderate file size) to browsers. Since VRML is supported by most web browsers (using plug-ins), issues related to platform independency are eliminated. However, the functionality of VRML is limited to simply displaying the geometry of the model. The only processing that is allowed are the viewing transformations, which include moving (translation) and orienting (rotation). There are some interactive capabilities available in VRML (e.g. turning lighting and animations on and off), but interaction with individual components of an assembly is quite limited. Although the representation of the design artifact for our purposes does not need to have all the functionalities of a full CAD package, it should provide a designer the feel of the physical system in a 3D environment. This basic display capability must be coupled with the ability to select a particular object, look up the data associated with it, change it and run the analysis again. We can then quantify and display the impact of analysis on one component over the other using different visual cues. To overcome the limitations inherent to VRML, server-side scripting languages (e.g. PERL, PHP, and ASP) have been used in this work to handle interactivity [38]. Current export features of CAD packages results in a grouping of all components into a single entity, therefore not allowing interaction of individual components within the VRML environment. Since this representation is not based on individual components, as is desired in this methodology, the conversion approach must be augmented through the use of server-side scripting to ensure component level interaction.
Submitted for review to ASME Journal of Computing and Information Science in Engineering
Page 10/29
Web-based Visualization Framework for Decision-making in Multidisciplinary Design Optimization
G. Agrawal, et al
Fig 3 shows a segment of a pipeline that has been modeled using a CAD package (Pro-EngineerTM) and has then been imported into a web-based environment using the server-side scripting and VRML translation process developed in this work. The CAD model has been segmented automatically into its individual components (i.e. pipe segments, bolt attachments), using an approach that parses the output from the CAD file using server-side scripting, thereby enabling the user to interact with each component separately. In Fig 3, one of the piping sections has been highlighted by a click on the interface using a mouse.
Fig. 3 Conversion of a Pipeline to Interactive VRML Environment The conversion process developed in this work converts each part of the overall assembly into individual 3D objects and reassembles them in VRML. The initial output is parsed using server side scripting to automatically break the assembly into subassemblies and individual parts. The parsed data structures are then stored in a product design database or XML data file. For display, the individual part files are reassembled into an overall VRML representation using an approach that gives a script control over the visual cues (i.e. color, transparency) associated with an individual part. The methodology developed here continues beyond the simple display and selection of CAD models using a combination of web technologies. In order to be useful, changes in component designs must be tied to the analysis routines and sensitivities resulting from disciplinary analyses. The Global Sensitivity Equations (GSE) provides a linkage between the local design sensitivities and the total derivatives required for an optimization step using the Multiple Discipline Feasible (MDF) optimization approach [39]. By combining the selection of components and suggesting changes in a web-based interface with the mathematical basis that exists in the GSE, a measure of impact can be generated for possible design changes and can be displayed using a visual representation of the product under consideration. Coupling this display with a representation of the analysis process required to evaluate the impact of
Submitted for review to ASME Journal of Computing and Information Science in Engineering
Page 11/29
Web-based Visualization Framework for Decision-making in Multidisciplinary Design Optimization
G. Agrawal, et al
design changes offers designers a more complete picture of the impact of their design changes. The coupling of this design artifact representation, together with the system analysis representation, via a platform independent framework, is described in detail in Section 6. The next section presents the MDO XML data structure developed in this work that is critical for enabling the MDO FAD to be platform-independent and easily extensible.
5
DEVELOPMENT OF AN MDO XML DATA STRUCTURE In order to allow collaboration on heterogeneous networks, the methodology developed here incorporates server-
side scripting languages to manipulate the input data and provide an interface to allow designers to interact with their designs. Fig. 4 shows the overall structure of the methodology used in this work. The bottom level of the figure shows the underlying coupled disciplinary analyses. The results from these analyses can be stored either in a central product design database, in an XML data structure, or both. The CAD models for the product can be stored in a similar manner, with the exported VRML representations encapsulated in the XML data source used to provide the source information for the web-based interface. Server side scripting (i.e. PHP - Hypertext Preprocessor) can be used to regenerate database driven VRML models to provide three-dimensional representations of the product. Scripting can also gather and display information related to different components and subsystems, enabling interaction with each individual component of an assembly and the associated data form various disciplines. All data associated with additional tools necessary during the design process (i.e. optimization, design space visualization, project planning, configuration management, and life cycle simulation, amongst others), could also be stored in an XML data structure. It must be remembered that design groups use a wide variety of platforms to accomplish their tasks. Visualization of engineering systems on different platforms using a web-based framework is not a novel concept. However, what would be unique is a methodology that would simultaneously allow the coupling of design impact on analyses and actual products, thereby providing an intuitive context for designers to discuss trade-off alternatives. The data structure used is critical to achieve this end.
Submitted for review to ASME Journal of Computing and Information Science in Engineering
Page 12/29
Web-based Visualization Framework for Decision-making in Multidisciplinary Design Optimization
Optimization Tool
Design Space Visualization
Project Planning
Configuration Management
XML Based MDO Data Source
Disciplinary Database
Product Design Database
Disciplinary Database
G. Agrawal, et al
Life Cycle Simulation
CAD MODELS
CAD Representation VDSM Disciplinary Analysis
Disciplinary Analysis
WEB-BASED DECISION TOOL
Disciplinary Analysis
Disciplinary Analysis
Fig 4 XML Middle Layer Associated with MDO Process
This portion of the work explores the creation and evaluation of an initial XML-based MDO data exchange format. The solution of MDO problems requires that a large amount of various types of data associated with the optimization and disciplinary analyses be stored in an efficient manner. The data associated with each subsystem may vary from simple geometric features, to complex sensitivity and coupling data. Moreover, the amount and type of data associated with a subsystem will vary greatly amongst subsystems of the same problem. The issue discussed above makes it difficult to design a standardized data structure for such problems. A data structure for MDO problems must be sufficiently flexible to capture a variety of disciplinary data, while maintaining the modularity of the data. In today’s computationally centered design process, data can be stored locally by discipline, it can be integrated and stored at a central common server, or there could be a mix of central and distributed storage mechanisms . There are advantages and disadvantages to each approach, depending on legacy codes and existing business practices. The techniques of sharing data typically depend on the location of the stored information. While it is typically not practical to store all design data in a central storage location, data sharing can be made more effective if there is a single data broker to track. Sharing of data across platforms and locations is made easier through the use of platform independent data formats such as XML. Using XML, design data from various disciplines can be integrated into a single document. This document can be populated using connections to a central data server, distributed design information databases dependent on disciplinary analyses, or a mix of central and distributed data
Submitted for review to ASME Journal of Computing and Information Science in Engineering
Page 13/29
Web-based Visualization Framework for Decision-making in Multidisciplinary Design Optimization
G. Agrawal, et al
sources. Tools using the data would connect to this middle layer, as was shown in Fig 4. This middle layer makes tool development independent of analysis techniques and databases. The tremendous benefit to this approach is that if a new disciplinary analysis is developed, the code to update the middle layer only needs to be changed once, rather than in each of the tools individually. This structure also allows for future extensions in analyses or tools. Existing tools relying on the XML format would ignore new tags introduced into the middle layer, rather than causing errors as often occurs when changes are made to other data formats (e.g. a field inserted into a comma delimited file). Integrating disciplinary design data in a platform independent format would also facilitate collaboration between disciplinary databases, designers and analysis/optimization programs using the existing World Wide Web (WWW) network. For a typical MDO problem, a subsystem can have data such as design variables, behavior variables (state variables), optimization sensitivities, analysis sensitivities, disciplinary analysis time and cost, performance parameters, and also some geometric and cue data (for use in visual interface of the problem). In this work, we address the challenge of structuring, storage, and exchange of this data in an efficient and robust fashion. Fig 5 is a simple representation of an XML schema developed to implement this data structure. Recall that XML is extensible and is also being used widely for web-based data integration. The XML data structure for MDO integrates disciplinary and analysis data and stores it in a central repository. XML datasets can also be easily transmitted over the Internet.
System
Given Parameters Subsystem Name Design Variables State Variables Time Cost Geometric Parameters Coupling Source Subsystem Behavior Variable Destination Subsystem Behavior Variable Sensitivities Time Cost Suspension Error Designer Error Limits Objective Function Constraints
Fig 5 MDO XML Data Structure
Submitted for review to ASME Journal of Computing and Information Science in Engineering
Page 14/29
Web-based Visualization Framework for Decision-making in Multidisciplinary Design Optimization
G. Agrawal, et al
Integrating disciplinary and analysis data into such a centralized XML dataset enables the development of future collaborative tools and techniques for MDO. As shown in Fig. 4, all the disciplinary databases, disciplinary analysis routines, optimization routines, and visual clients can be connected to central MDO XML database and all the data generation, storage, and data exchange is then modeled through this dataset. Such XML data can be transformed to create specific input file formats for web-based decision-making interfaces such as VDSM (as shown in Fig 6). The XML design data can also be represented as tables, flowcharts that can be viewed in a web browser such as Netscape or Internet Explorer (e.g. Fig 6), and also as 3-D physical representation of the system in VRML. Creating XML databases is a good choice for this approach because of its flexibility, extensibility, platform independence, and compatibility with existing technology. Such XML databases can be read and updated easily using API’s in programming languages including C, C++, and JAVA, amongst others. Further, since XML is the documentprocessing standard for the World Wide Web (WWW), its implementation is also useful in collaborative environment using the World Wide Web.
Fig 6 Transformation of MDO XML Data into Visual Dependency Structure Matrix (VDSM)
An XML-based data structure has been developed in this work that captures all of the data used for optimization and analysis (i.e. design variables, state variables, optimization parameters and the product/ process parameters that are affected) in an MDO process [40]. As is shown in Fig 7, this XML-based MDO dataset is first created to capture pre-analysis design data such as design variables, fixed parameters, and information describing the coupling of disciplinary analyses. Analysis and optimization routines use this data set and the results are then appended to the same data set. Results including optimized design variables, sensitivity information, and analysis time and cost, are
Submitted for review to ASME Journal of Computing and Information Science in Engineering
Page 15/29
Web-based Visualization Framework for Decision-making in Multidisciplinary Design Optimization
G. Agrawal, et al
captured appropriately in the data structure and stored along with the complete dataset. Optimized design variable and process parameter data can be pulled out from this XML dataset for MDO and can be stored back to the disciplinary databases if needed. Fig 6 shows that initially, the only data taken from disciplines (subsystems) is design variables, state variables and coupling data needs from other disciplines (subsystems). This data structure has been expanded to also include the geometric data for each component as discussed in the previous section. Pre-Design Data
Optimized Data
(Captured from individual disciplines)
(results returned to disciplines)
MDO-XML Dataset System Analysis Sensitivity Analysis Optimization
Fig 7 MDO XML Data Population as Optimization and Analysis Executes The implementation of an XML-based data structure typically contains several layers of data containment. The structure used in this work will be presented using a top-down description, first reviewing the highest levels of abstraction and then exploring each layer in more depth. On the very top level (System level) the structure appears as shown below:
The Fixed_parameters tag stores the system level parameters or input values. The Subsystem tag stores only subsystem level (disciplinary analysis) information such as subsystem name, design variable information, state variable information, and subsystem analysis time and cost. An example of this substructure is shown below, with more details pertaining to the Coupling tag, the Time tag, and Cost tag provided in [40]. Disciplinary Analysis N Analysis Design Variable A 6.9
Submitted for review to ASME Journal of Computing and Information Science in Engineering
Page 16/29
Web-based Visualization Framework for Decision-making in Multidisciplinary Design Optimization
G. Agrawal, et al
Analysis Output W1 23.452 9.32 ...
The purpose of the Time and Cost tags are to store the analysis time and cost associated with executing that particular subsystem (discipline) analysis. In the example above, the Design_variables and State_variable tags shown have only one variable each, but these tags can contain any number of design or state variables associated with different disciplines. At a system level, there can be multiple such subsystem nodes depending upon the number of disciplines in a MDO problem. An XML schema using the data architecture discussed above has also been developed for capturing data related to the physical representation. The geometric data is incorporated into the Subsystem node or the System node, depending on the structure of the analyses by taking advantage of the extensibility inherent to XML. If the analysis of a product is decomposed by component, the three-dimensional models of each component can be stored with the remaining subsystem data. The design information is dynamically loaded into an XML format from either a single database server or from multiple databases owned by individual disciplinary analyses, which can then be stored or transmitted over the Internet.
For example, if a certain discipline is involved with analyzing mechanical
components, data for each component within the subsystem could be grouped and structured within that particular subsystem, as shown below.
Submitted for review to ASME Journal of Computing and Information Science in Engineering
Page 17/29
Web-based Visualization Framework for Decision-making in Multidisciplinary Design Optimization
G. Agrawal, et al
Now the two key foundational issues have been addressed in order to develop the platform independent interactive collaborative tool for simultaneous analysis and design in an MDO environment (MDO FAD). The data handling approach amongst disparate groups is addressed through the MDO XML structure defined previously and the ability to capture design content for individual components and then represent them in an interactive VRML format within a web tool is developed as in Section 4. The next section pulls these concepts together in the presentation of the framework developed in this work. The interactions of all the participating components are represented in Fig 8.
Fig 8 MDO XML as a Data Source for Multiple Tools
6
DEVELOPMENT OF AN MDO FRAMWORK FOR INTERACTIVE ANALYSIS AND DESIGN The MDO FAD interface developed in this work is divided into six sections, as shown in Fig 9. These are the
Control Panel at the top left; the VDSM representation section; the Component representation section; the chat interface; the VDSM Data Window; and the Component Data Window. The various functionalities of the six sections of the interface are described in depth in [41]. A brief description is provided here, as well as an explanation of how these sections link together to allow decision-makers to intuitively interact with their design.
Submitted for review to ASME Journal of Computing and Information Science in Engineering
Page 18/29
Web-based Visualization Framework for Decision-making in Multidisciplinary Design Optimization
G. Agrawal, et al
Fig 9 Golinski Speed Reducer Problem in Interactive MDO Framework for Analysis and Design. The Control Panel The Control Panel acts as the main driver of the interface. Several buttons (links) are provided that allow for setting up the environment and handling various settings. Some of the links allow viewing various data associated with the design in the current state of the process. The VDSM Representation The VDSM Representation shows the 3-dimensional representation of the coupled subsystems (or tasks) of the problem. The VDSM was described in Section 3. The average error introduced into the constraints by suspending a coupling is conveyed using a color cue to the spherical coupling node. The size of the sphere illustrates the error introduced into the objective function that would result from suspending the coupling. The Component Representation The Component Representation shows the 3-dimensional representation of the physical system. This is the model that is created using the CAD package and exported to VRML for viewing in a web browser using the approach developed in Section 4. The representation created here allows a user to interact with every single component of the model. By moving the computer mouse over any component, the component’s ID is displayed in the status bar of the browser. The clicking action on any component generates a web form in the ‘Component Data Window’, which allows the user to change the geometric information associated with that component.
Submitted for review to ASME Journal of Computing and Information Science in Engineering
Page 19/29
Web-based Visualization Framework for Decision-making in Multidisciplinary Design Optimization
G. Agrawal, et al
The Chat Interface The Chat Interface is provided to integrate an instant messaging module to the tool so as to allow the users to share their views while making decisions about some system. The VDSM Data Window Any data related to the VDSM representation is displayed in this area. Also, any of the web forms that relate to changing the VDSM settings, for the problem under consideration, is displayed in this window. The Component Data Window Any data related to the component representation is displayed in this area. Also, any of the web forms that relate to changing the component geometries, for the problem under consideration, is displayed in this window. In order to demonstrate the use of the developed tool, two MDO test problems are explored, with each described in the next section.
7
APPLICATION TO MDO TEST PROBLEMS The new platform-independent, extensible data structure is now applied in the solution of two sample MDO test
problems using the MDO FAD developed here. The first of these pertains to the optimization of a speed reducer that originates in the MDO Test Suite maintained at NASA-Langley [42], but has been modified here with the incorporation of four behavior variables. A second problem pertains to the optimal design of a pipeline, which has been augmented by a representative complex analysis generated from CASCADE [43]. The capture of analysis and optimization data is demonstrated for the test cases, including the design variables, state variables, individual disciplinary analysis time and cost, and the optimization problem parameters. Data associated with each discipline is grouped according to the proposed format under the respective discipline tag and in a hierarchical manner. The coupling data is structured separately instead of associating it with a particular discipline. The geometric information will also be coupled with the analysis data, providing a representation of the Speed Reducer. Modified Golinski Speed Reducer Problem To demonstrate the implementation, a modified version of the Golinski’s speed reducer problem has been developed to incorporate couplings between the subsystems, and is used here as a test case. The original Golinski speed reducer is described in [44, 45]. Figs 10 and 11, along with Table 1, show a simple representation of the speed reducer and an overview of problem formulation.
Submitted for review to ASME Journal of Computing and Information Science in Engineering
Page 20/29
Web-based Visualization Framework for Decision-making in Multidisciplinary Design Optimization
G. Agrawal, et al
Fig 10 Simple Representation of a Speed Reducer (Figure courtesy: MDO Test Suite, NASA Langley web-page http://mdob.larc.nasa.gov/mdo.test/)
Fig 11 Two Disciplinary Analyses for the Modified Golinski Speed Reducer Problem
Table 1 Optimization Problem Statement for the Modified Golinski Speed Reducer Minimize Speed Reducer Weight Subject to: g1
Description of constraint Bending stress of gear tooth
Minimum number of pinion teeth Relative face width Relative face width Overall dimension constraint Transverse deflection of shaft 1 Transverse deflection of shaft 2 Stress condition for shaft 1 Stress condition for shaft 2 Producability condition Design conditions
The speed reducer provides an optimization problem for the design of a small gear box. The goal of the optimal
Submitted for review to ASME Journal of Computing and Information Science in Engineering
Page 21/29
Web-based Visualization Framework for Decision-making in Multidisciplinary Design Optimization
G. Agrawal, et al
design is to allow the two shafts entering the box to rotate at their most efficient speed, while also minimizing the weight of the speed reducer. Restrictions placed on the problem include geometric, stress, and displacement constraints. Fig 11 shows the two disciplinary analyses (gear and shaft design) that have been developed in this formulation of the modified speed reducer problem. It has been formulated as a Multidisciplinary Feasible (MDF) MDO problem, with couplings between gear design and shaft design subsystems [40]. Table 1 shows the problem formulation for this modified problem. This modified problem now has four behavior variables: the weight of the pinion (w1 ); the pinion shaft speed (n p ); the bore diameter for the pinion (Dp1 ); and the radial load from the gear (Fr). The speed reducer problem was executed using analysis and optimization programs that connect to the MDO XML relational database used to store the disciplinary results. The XML dataset was created by querying the stored disciplinary analysis and optimization data. Fig 9 shows the integrated environment containing a simplified representation of the gear reducer structure (the model was created in the ProEngineer
TM
environment and imported into the visualization environment using the process
previously described) along with the VDSM model for the speed reducer problem (with four subsystems, each associated with analysis linked to the behavior variables). Fig 12 shows how specific design data can be viewed through selection in the Control Panel. Other information, such as DSM data, can also be viewed in the same way.
Fig. 12 Data associated with the current state of the process. With this interactive framework, users can select a component for which they wis h to make a design change.
Submitted for review to ASME Journal of Computing and Information Science in Engineering
Page 22/29
Web-based Visualization Framework for Decision-making in Multidisciplinary Design Optimization
G. Agrawal, et al
This component is then highlighted. Simultaneously, the impact of that design change on the analysis is shown in the VDSM frame. One can see what type of reanalysis would be required in order to accomplish the desired redesign, and then what the resulting impact on time and cost would be. Armed with this information, the designer (or designers, given the web environment and chat interface), could then identify which couplings in the MDO problem are truly important and which might be able to be suspended so as to increase the efficiency of the redesign without adversely affecting the accuracy of the final solution.
7.2 Pipeline Design Problem The optimization and analysis equations for the problem are given in Reference [40] and the physical representation is described in detail in Reference [41]. In order to save space here, only functional relations are provided in Table 2. Table 2 Optimization Problem Statement for the Pipeline Design Problem Minimize F = f(x1 – x 11 ,Y1 – Y4 ,Y8 - Y10 ) Subject to: g1 = f(x1 – x3) g2 = f(x4, x5,Y 1, Y 4 ,Y 9) g3 = f(x2, x4 - x 6,Y 1, Y3) g4 = f(x4, x6 – x10,Y 1, Y 2, Y4, Y 8, Y 10) Design Variables: x 1 – x 11
Maintained within upper and lower bounds Coupled Analysis Representation: Y 1=f(X1,Y 9) Y 6=f(X6, X8,Y 1, Y 8) Y 2=f(X1,Y 4, Y 7) Y 7=f(X11) Y 3=f(X2, X3,Y 4, Y 5 ,Y6, Y7 ,Y 10) Y 8=f(X10, X11) Y 4=f(X4, Y 1, Y 5 ,Y 6, Y8 ) Y 9=f(X10,Y 4, Y 5) Y 5=f(X9,Y 4, Y 8) Y 10=f(X10,Y 3, Y4)
Again, in Fig 13 we see the representation of both coupled analysis as well as the physical model simultaneously in the interactive MDO FAD. The interactivity provided by VRML enables the designers to translate and rotate both representations. The process developed in Section 4 allows the designers to click on a component in the physical representation and then see the impact on the analysis in the VDSM representation. The time and cost impacts associated with a particular component change will show in the VDSM Data Window, while the component data will show in the Component Data Window.
Submitted for review to ASME Journal of Computing and Information Science in Engineering
Page 23/29
Web-based Visualization Framework for Decision-making in Multidisciplinary Design Optimization
G. Agrawal, et al
Fig 13 Pipeline Design Problem in Interactive MDO Framework for Analysis and Design
8
Conclusion
This work demonstrates a methodology for combining a physical representation of a design artifact with the associated design process and sensitivities, specifically in the context of an MDO problem. A new XML data structure enables easy integration and representation of analysis and design data. The interactive MDO FAD (Framework for Analysis and Design) provides designers with a capability to simultaneously consider the impact a design change will have both on the product being designed and the analyses necessary to evaluate the impact of any changes in the product design. By combining representations of the three dimensional product with system state variables and sensitivities in a platform- and geographically independent file format, a web-based decision support tools has been developed to support the decision making process. The development and application of an XML-based data structure for use in MDO problems to couple design data with geometry information provides an effective means of making data transmission more universal and transparent amongst disciplines. XML-based data transfer provides a self-describing data format that will provide engineers and scientists not familiar with particular disciplinary analysis tools a means of sharing data. XML-based services can also be used to mask internal proprietary codes, enabling collaboration between groups without requiring knowledge of individual routines or proprietary CAD data formats. The platform independence of the format does come at the expense of file size, but is necessary for distributed collaborative design. Further work is necessary to test the scalability of the XML structure and the benefits that may be achieved through file
Submitted for review to ASME Journal of Computing and Information Science in Engineering
Page 24/29
Web-based Visualization Framework for Decision-making in Multidisciplinary Design Optimization
G. Agrawal, et al
compression. In order to demonstrate the methodology, the MDO FAD was implemented on an MDO test case problem and a Pipeline design pseudo-problem. The Golinski Speed Reducer problem from the NASA MDO Test Suite was reformulated to include four behavior variables. The Speed Reducer was modeled in a CAD package and loaded into a web-based design environment that included both a VRML model of the speed reducer and a VDSM model of the analysis process. Individual components of the speed reducer could be selected and design changes could be entered, with the resulting impacts displayed using visual cues. The methodology was also applied to a pseudo problem for pipeline design, in which the analysis model was generated using the CASCADE simulator and a physical representation was modeled in a CAD package. The analysis model was linked to the physical parameters in order to show the impact of design changes on the system, both in the analysis and physical representation, using visual cues.
Acknowledgments The authors wish to acknowledge support provided by NSF Award DMII 0115444as well as support from the New York State Center for Engineering Design and Industrial Innovation (NYSCEDII) through the NYSTAR program of the State of New York.
References [1] Sobieszczanski-Sobieski, J., 1995, “Multidisciplinary Design Optimization: An Emerging, New Engineering Discipline,” Advances in Structural Optimization, Kluwer Academic: pp. 483-496. [2] Yoder, S., and Brockman, J., 1996, “A Software Architecture for Collaborative Development and Solution of MDO problems,” Proceedings of the 6th AIAA/NASA/ISSMO Symposium on multidisciplinary analysis and optimization, Bellevue, WA, pp. 1060-1062. [3] Allwright, S., 1996, “Technical Data Management for Collaborative Multi-Discipline Optimization,” Proceedings of the sixth AIAA/NASA/ISSMO Symposium on multidisciplinary analysis and optimization, Bellevue, WA, pp. 1524-1534. [4] Giesing, J. P., and Brathelemy, J. M., 1998, “A Summary of Industrial MDO Applications and Needs,” Proceedings of the 7th AIAA/USAF/NASA/ISSMO Symposium on Multidisciplinary analysis and optimization, St. Louis, MO.
Submitted for review to ASME Journal of Computing and Information Science in Engineering
Page 25/29
Web-based Visualization Framework for Decision-making in Multidisciplinary Design Optimization
G. Agrawal, et al
[5] Harold, E. R., 1999, “XML Bible,” IDG Books Worldwide, Inc., New York, NY. [6] Ryou, O., and Jerard, R. B., 2001, “NCML: An Internet Compatible Data Exchange Format for Custom Machined Parts,” NSF Design, Manufacturing & Industrial Innovation Research Conference, Tampa, Florida. [7] Shen, W., 2000, “Web-based infrastructure for collaborative product design: an overview,” Proc. of the Sixt h International Conference on Computer Supported Cooperative Work in Design, Hong Kong, pp. 239-244. [8] Huang, G. Q., and Mak, K. L., 1999, “Web-based collaborative conceptual design, Journal of Engineering Design,” 10(2), 183-194. [9] Kim, J. Y., and Han, S. B., 1999, “Web-enabled feature-based modeling in a distributed design environment,” Proc. of the ASME Design Engineering Technical Conferences and Computers and Information in Engineering Conference (CD-ROM), DETC99/DFM-8941. [10] Numata, J., 1996, “Knowledge Amplification: An Information System for Engineering Management,” Sony’s Innovation in Management Series, Vol.17, Sony Corp., Japan. [11] Pahng, G.-D. .F., Bae, S., and Wallace, D., 1998, “Web-based Collaborative Design Modeling and Decision Support,” Proc. of the ASME Design Engineering Technical Conferences and Computers in Engineering Conference (CD-ROM), DETC98/EIM-5681, Atlanta, GA. [12] Rajagopalan, S., Pinilla, J. M., Losleben, P., Tian, Q., and Gupta, S. K., 1998, “Integrated Design and Rapid Manufacturing over the Internet,” Proc. of the ASME Design Engineering Technical Conferences and Computers in Engineering Conference (CD-ROM), DETC98/CIE-5519, Atlanta, GA. [13] Roy, U., and Kodkani, S. S., 1999, “Product modeling within the framework of the World Wide Web,” IIE Transactions, 31(7), 667-677. [14] Xiao, A., Choi, H. J., Kulkarni, R., Allen, J. K., Rosen, D., Mistree, F., and Feng, S. C., 2001, “A Web-based Distributed Product Realization Environment,” Proc. of the ASME Design Engineering Technical Conferences and Computers and Information in Engineering Conference (CD-ROM), DETC2001/CIE-21766, Pittsburgh, PA. [15] Shen, W., and Ghenniwa, H., 2003, “A Distributed Multidisciplinary Design Optimization Framework: Technology Integration,” Transactions of the Society for Design and Process, Vol. 7, No. 3, pp. 95-108. [16] Deremaux, Y., Willcox, K., and Haimes, R., 2003, “Physically-Based, Real-Time Visualization and Constraint Analysis in Multidisciplinary Design Optimization,” AIAA Paper 3876.
Submitted for review to ASME Journal of Computing and Information Science in Engineering
Page 26/29
Web-based Visualization Framework for Decision-making in Multidisciplinary Design Optimization
G. Agrawal, et al
[17] Winer, E., and Bloebaum, C. L., 1999, “Using the World Wide Web to Employ Concurrent Design Methodologies,” proceedings of 3rd ISSMO/UBCAD/UB/AIAA World Congress of Structural and Multidisciplinary Optimization, Niagara Falls/Amherst, NY. [18] Eddy, J. P., and Lewis, K., 2002, “Multidimensional Design Visualization in Multi- Objective Optimization,” 9th AIAA/USAF/NASA/ISSMO Symposium on Multidisciplinary Analysis and Optimization, Atlanta, GA, AIAA-2002- 5621. [19] Stump, G. M., Yukish, M., Simpson, T. W., and Bennett, L., 2002, “Multidimensional Visualization and Its Application to a Design by Shopping Paradigm,” 9th AIAA/USAF/NASA/ISSMO Symposium on Multidisciplinary Analysis and Optimization, Atlanta, GA, AIAA-2002-5622. [20] Messac, A., and Chen, X., 1998, “Visualizing the Optimization Process in Real-Time Using Physical Programming,” AIAA-98-39707. [21] Huang, C. H., Bloebaum, C. L., 2004, “Visualization as a Solution Aid for Multi-Objective Concurrent Subspace Optimization in a Multidisciplinary Design Environment,” proceedings of 10th AIAA/ISSMO Multidisciplinary Analysis and Optimization Conference, Albany, NY. [22] Agrawal, G., Lewis, K., Bloebaum, C. L., 2005, “Intuitive Design Selection Using Visualized n-Dimensional Pareto Frontier,” Proceedings of 1st AIAA Multidisciplinary Design Optimization Specialist Conference, Austin, Texas, April 18-21. [23] Winer, E. H., and Bloebaum, C. L., 2002, “Development of Visual Design Steering As an Aid in Large-scale Multidisciplinary Design Optimization. Part I: Method Development,” Structural and Multidisciplinary Optimization, Vol. 23, No. 6. [24] Winer, E. H., and Bloebaum, C. L., 2002, “Development of Visual Design Steering As an Aid in Large-scale Multidisciplinary Design Optimization. Part II: Method Validation,” Structural and Multidisciplinary Optimization, Vol. 23, No. 6. [25] Winer, E. H., and Bloebaum, C. L., 2001, “Visual Design Steering for Optimization Solution Improvement,” Structural and Multidisciplinary Optimization, Vol. 22, No. 3. [26] Goel A., et al, 1999, “VizCraft: A Multidimensional Visualization Tool for Aircraft Configuration Design,” Proceedings of IEEE Visualization, San Francisco, Cal., pp. 425-428. [27] Kingsley, G., Siegel Jr. J. M., Harrand, V. .J., Lawrence, C., and Luker. J. J., 1998, “Development of A Multi-
Submitted for review to ASME Journal of Computing and Information Science in Engineering
Page 27/29
Web-based Visualization Framework for Decision-making in Multidisciplinary Design Optimization
G. Agrawal, et al
disciplinary Computing Environment (mdice),” Proceedings of 7th AIAA/USAF/NASA/ISSMO Symposium on Multidisciplinary Analysis and Optimization, AIAA-98-4738, pp. 251-260. [28] Kingsley, G., Harrand, V. J., and Lawrence, C., 1996, “A visual computing environment for computational Aerosciences,” Proceedings of the 1996 Computational Aerosciences Workshop, pp. 331-338. [29] Rogers, J. L., “DeMAID – A Design Manager’s Aide for Intelligent Decomposition Users Guide,” NASA Technical Memorandum 101575, 1989. [30] Steward, D. V., 1981, “System Analysis and Management: Structure, Strategy and Design,” Princeton, NJ: Petrocelli Books. [31] Rogers, J. L. and Bloebaum, C. L., 1994, “Ordering Design Tasks Based on Coupling Strengths,” AIAA, AIAA-94-4326-CP. [32] English, K., and Bloebaum, C. L., 2002, “Subsystem and Coupling Cost Considerations Using A Visual Dependency Structure Matrix,” 40th AIAA Aerospace Sciences Meeting and Exhibit, Reno, NV. [33] Ames, A. L., Nadeau, D. R., and Moreland, J. L., 1996, “The VRML 2.0 Sourcebook,” Second Edition, New York, NY: John Wiley & Sons, Inc. [34] Cortona VRML Plug-In, Parallel Graphics, http://www.parallelgraphics.com/products/cortona/ [35] Cosmoplayer VRML Plug-in, Cosmo Software, http://www.sgi.com/products/software/cosmo/?/ [36] Extensible Graphics Language, 2002, XGL Group, http://www.xglspec.org/,. [37] W3C World Wide Web Consortium, 2000, Extensible Markup Language (XML), www.w3.org/XML,. [38] PHP3: PHP: Hypertext Preprocessor, http://www.php.net. [39] Sobieszczanski-Sobieski, J., 1990, “On the Sensitivity of Complex, Internally Coupled Systems,” AIAA Journal, 28(1): p. 153-160. [40] Parashar, S., English, K., and Bloebaum, C. L., 2004, “Data Transmission in Multidisciplinary Design Optimization Using Platform-Independent Data Structure,” 41st AIAA Aerospace Sciences Meeting and Exhibit, Reno, NV. [41] Agrawal, G., English, K., Bloebaum, C. L., Bisantz, A., and Uggirala, A., 2004, “Web-based Visualization Environment
Submitted for review to ASME Journal of Computing and Information Science in Engineering
Page 28/29
Web-based Visualization Framework for Decision-making in Multidisciplinary Design Optimization
G. Agrawal, et al
[42] Padula, S.L., Alexandrov, N., and Green, L.L., 1996, “MDO Test Suite at NASA Langley Research Center,” Sixth AIAA/NASA/ISSMO Symposium on Multidis ciplinary Analysis and Optimization, Bellevue, WA. [43] Hulme, K. F., and Bloebaum, C. L., 1997, “Development of a Multidisciplinary Design Optimization Test Simulator,” Structural Optimization, Volume 14, Number 2-3, pp. 129-137. [44] Golinski, J., 1970, “Optimal Synthesis Problems Solved by Means of Nonlinear Programming and Random Methods,” Journal of Mechanisms, Vol. 5, pp. 287-309. [45] Golinski, J.: 1973, “An Adaptive Optimization System Applied to Machine Synthesis,” Mechanism and Machine Theory, Vol. 8, pp. 419-436. [46] PTC, Parametric Technology Corporation, http://www.ptc.com/products/pvexpress/index.htm [47] Roger N. Nagel, Walt W. Braithwaite, and Philip R. Kennicott, 1980, “Initial Graphics Exchange Specification IGES, Version 1.0,” NBSIR 80-1978, National Bureau of Standards, Washington, DC. [48] STEP, http://www.cadcamcenter.com/cadcam/step.htm
Submitted for review to ASME Journal of Computing and Information Science in Engineering