Exploring Geovisualization
Web-Based Visualization of 3D Geospatial Data Using Java3D eb-based visualization of 3D geospatial data has long been an area of research within the geospatial information community. It’s a proven reliable and effective method for integrating heterogeneous data sets from different application domains and communicating the contents to the user. Early research used the Virtual Reality Modeling Language (VRML) for creating 2.5D and 3D virtual worlds. Since then, however, researchers have made significant advances in geospatial information technology that could potentially help improve Web-based 3D geographic information systems (GISs). For example, the geospatial information community has standardized relational models for holding 3D spaSpatial database servers allow tial data. Researchers have also made for the storage and access of significant advances in the development of spatial database engines 3D geospatial data using Open such as MySQL (see http://www. Geospatial Consortium mysql.org), Oracle, and PostgreSQL/ standards. The Geospatial PostGIS (see http://www.postgresql. Database Online Visualization org). Furthermore, Sun MicrosysEnvironment (GeoDOVE) is a tems’ Java3D offers new developprototype 3D Web-based ments in Web-based 3D visualization. Because of these advances, the geographic information system GIS community can potentially disthat demonstrates how Java3D seminate both 3D spatial data and can reduce bandwidth and functionality to anywhere on the allow direct connectivity to World Wide Web. spatially enabled database Although Web-based tools for 3D hydrological,1 urban,2 and geologisystems. cal modeling3 exist, they focus on individual simulation models and extract data only from specific data sources. Our study aimed to determine whether existing technologies allowed for the development of a Web-based GIS application that could offer dynamic connectivity to conventional relational database management systems (RDBMS) holding standard 3D geospatial data. By standard geospatial data we’re referring to the Open Geospatial Consortium Simple Features data model. The OGC is an international organization that promotes interoperability between GISs and their vendors. It’s allied to the International Organiza-
W
28
July/August 2006
Gobe Hobona, Philip James, and David Fairbairn University of Newcastle upon Tyne
tion for Standardization (ISO), which has adopted the Simple Features model as the ISO19125 specification.4 We’ve developed GeoDOVE, a Java3D-based prototype system that retrieves geospatial data from conventional spatial database servers, allows modification of the visualization during runtime, and lets users remotely modify attributes using the Structured Query Language (SQL).
GeoDOVE system architecture The current version of VRML⎯VRML97⎯offers two approaches for linking a 3D model to external programs and data sources: ■ script nodes and ■ the Java external authoring interface (EAI).
Although the EAI provides a more flexible approach to linking a VRML model to external programs than the script node, vendors have found it particularly unstable when implemented because the Java classes varied across vendors.5 A possible solution is a platform-independent and Web-deployable 3D graphics environment. Of the four rendering engines that we examined in our study⎯DirectX, OpenGL, OpenGL Performer, and Java3D⎯only Java3D met both requirements. The official GeoVRML Working Group has raised other limitations of VRML and its geospatial extension, GeoVRML (see http://www.geovrml.org). Support for more coordinate systems, larger grid-based terrain representation, data interchange, higher resolution, and accuracy could overcome some of these limitations. The GeoDOVE system addresses some of these issues. Its architecture, shown in Figure 1, includes different spatially enabled relational database engines and files encoded in the Geography Markup Language. It currently supports PostGIS, MySQL, and the ArcGIS Spatial Database Engine (ArcSDE). These relational database engines use the OGC’s Simple Features model for SQL (SFS), shown in Figure 2, which is also implemented within GeoDOVE’s internal geometry model. This provides convenient mappings between objects in the data source and objects in the client application.
Published by the IEEE Computer Society
0272-1716/06/$20.00 © 2006 IEEE
Using the Java database connectivity (JDBC) API, Server side Client side GeoDOVE can connect to and send an SQL query to any of these spatially enabled database engines. GeoDOVE PostGIS parses and reconstructs the query results into its own internal geometry object model. Thus, rather than retrieving data using the conventional select ∗ from layer ArcGIS query, which retrieves all records in a table, we can use spatial more sophisticated SQL queries to filter the retrieved database engine Java 3D-based records⎯for example, select field1, field2, Java GeoDOVE database field3 from table1 where (field1 = 100 or applet connectivity field1 = 200) and field3 like “A∗”. If the appliMySQL cation is connected to a spatially enabled database engine such as PostGIS, GeoDOVE can invoke spatial queries on the server⎯for example, select geom from geom_ Geography Geography table where distance(geom, geomfromtext HTTP Markup Markup (‘point (100000 200000)’, −1)) < 100. This Language Language server capability lets the system use some of the spatial dataShapefile shapefile base engines’ computational resources. Spatial compuSHP tations can impose a significant load on the client if performed on the client machine. In contrast, server-side spatial computations let the user send spatially enabled SQL queries to the server. The server sends the resultant layers back to the client, where they require no further 1 The GeoDOVE system architecture. processing. The JDBC also makes writing to the data source Geometry SpatialReferencingSystem possible. For example, the user could add a field that stores the 3D distance from a particular point to each 3D shape in the data source. GeoDOVE then calculates the 3D distance using Java3D and updates the database through the SQL commands Point Curve Surface GeometryCollection alter table and set. The ability to write back to a database also makes persistent storage of project information possible. This information includes references to all previously loaded layLineString Polygon MultiSurface MultiCurve MultiPoint ers, symbol settings, and the viewer’s last known position and orientation. Most viewers for VRML, X3D, and other 3D file formats don’t offer facilities for such persistent storage. The SFS model, the basis of the ISO19125 Line LinearString MultiPolygon MultiLineString standard, defines a basic interface for vector geospatial data types such as Points, LineStrings, and Polygons. This means that GISs that implement SFS encode their vector geometries in much the same way, although Key: sometimes with different names for certain Class A Class A geometries. For example, PostGIS and MySQL use the well-known text format for returning Aggregation Inheritance geometries as ASCII text. Thus, they both refer (has-a) (is-a) to a concatenation of line segments as a Class B Class B LineString, or a MultiLineString for concatenation of multiple LineStrings. In contrast, ArcSDE refers to a similar geometry 2 Class hierarchy of Open Geospatial Consortium Simple Features model for SQL.4 type as a Polyline. A major limitation of VRML is that it doesn’t handle precision floating-point positioning⎯from Point3f double-precision floating-point numbers, offering only and Point3d classes, respectively⎯and therefore single-precision floating-point numbers. Because geo- maintains positional accuracy. The geospatial compographical data⎯particularly grid or geographical ref- nent of X3D, VRML’s successor, will also offer doubleerences⎯is often supplied in double-precision numbers, precision floating-point numbers. this limitation results in the loss of positional accuracy.5 Each geometry feature or feature collection in SFS GeoVRML supports the use of a single, static local coor- contains a reference to a defined coordinate system, the dinate system for dealing with floating-point limitations. spatial reference system (SRS). Typically, the server enComparatively, Java3D offers both single- and double- codes geographic information using either a geodetic
IEEE Computer Graphics and Applications
29
Exploring Geovisualization
Key: Vertex Vertex sequence direction
(a)
Wall height (b)
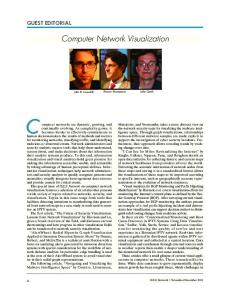
3
Vertex ordering for the extrusion of LineString and LinearRing (closed LineString) geometries: (a) LineString before extrusion and (b) wall created from extruded LineString.
coordinate system (GCS), for longitude, latitude, and altitude; or a projected coordinate system (PCS), for easting, northing, and height. Java3D implements a geocentric Cartesian coordinate system (CSS), for x, y, and z. The European Petroleum Survey Group (EPSG)—an international authority in geodesy and SRS—recommends that to transform coordinates from PCS to CSS, a user should first transform the coordinates to GCS.6 Spatial database engines such as PostGIS and ArcSDE allow for server-side coordinate transformations, letting users retrieve data sets in any GCS, including the commonly used World Geodetic System 1984. GeoDOVE exploits these server-side coordinate transformations by specifying WGS84 as its SRS in an SQL request⎯for example, select transform(geom, 4326) as geom from geom_table. After GeoDOVE has retrieved the data, but prior to rendering, it converts it from WGS84 (EPSG code 4326) to CSS (x, y, z) coordinates using formulas recommended by the EPSG. Conversion to CSS therefore occurs on the client side but is transparent to the user. GeoVRML currently supports only three coordinate systems, 21 ellipsoids, and one geoid. PostGIS and ArcSDE each define more than 2,000 unique SRSs, more than both GeoVRML and X3D. Furthermore, spatial database engines define SRS using several parameters, including semimajor axis, inverse flattening, latitude of origin, and central meridian. Thus, each spatial database engine can include new SRS definitions.
From OGC to Java3D geometry Java3D programs create 3D shapes by instantiating the Shape3D class. Shape3D objects consist of Geometry and Appearance objects. Using geometry objects, GeoDOVE can represent vector MultiPolygon and MultiLineString geometries by extruding the LineString and LinearRing subclasses (see Figure 2 for the SFS model). It can display extruded LineStrings as flat walls by creating geometries from either TriangleArray or the QuadArray classes of the Java3D API. The TriangleArray object renders the array of vertices as individual triangles⎯each group of three vertices defining a triangle to be rendered. Thus, two triangular planes represent each line segment along the polygon. The QuadArray object renders the array of vertices as individual rectangles. Therefore, each line
30
July/August 2006
segment has two fewer Point3f or Point3d objects when using a QuadArray than when using a TriangleArray. Figure 3a shows four vertices and their order within a LineString object. To extrude the LineString, GeoDOVE adds two vertices to each pair of adjacent vertices in a line segment (defined as two adjacent vertices in a LineString). The result is a set of four vertices defining a four-sided wall for each line segment in the original LineString, as Figure 3b shows. Figure 4 shows polygons extruded using the QuadArray class. Whereas LineStrings don’t need a roof structure, GeoDOVE completes each extruded LinearRing by creating a roof that adopts the polygonal base’s shape. As a result, GeoDOVE extrudes LinearRing objects following the procedure illustrated in Figure 3. GeoDOVE creates roof models using the Java3D GeometryInfo class to decompose a multisided polygon into a group of triangles. Lastly, for SFS Point features, the user can choose to render point geometry as a sphere, an extruded circle (vertical cylinder), or a predefined model such as a tree. After computing the extruded LineString or LinearRing coordinates, GeoDOVE calculates normals to each triangular plane so the rendering engine can shade the plane according to the defined lighting parameters. Each triangular plane’s normal is equal to the cross product of the vectors defined by the triangle’s vertices. The cross product of two vectors gives a vector that is orthogonal to both. The Java3D vecmath library offers functions for 3D and 4D vector calculations and can thus be used to compute normals. For objects created using the GeometryInfo class (such as rooftops), the NormalGenerator class lets GeoDOVE automatically compute normals. We observed, however, that the algorithm used by the NormalGenerator was computationally expensive for large-scale urban visualization, so computed normals directly using Vector3f classes from the vecmath library. For databases that store georeferenced raster data, the TriangleStripArray class lets users create a surface, such as a digital elevation model (DEM). Each TriangleStripArray object defines an array of vertices as a set of connected triangle strips. Each strip specifies the vertices that define a series of triangles. Figure 5 shows a DEM created from raster data and draped with elevation color shading. GeoDOVE retrieves the raster data set as a single complete grid from the database engine. Once the raster data set is on the client side, GeoDOVE decomposes it into smaller 2,048 × 2,048pixel images and renders it onto similar-sized DEMs. GeoDOVE adds these smaller DEMs’ geometries to the Shape3D object representing the complete raster. This entire process is transparent to the user. Performing raster decomposition on the client machine helps overcome the issue of terrain representation encountered when rendering raster DEMs using GeoVRML. The GeoVRML Working Group highlighted the significant load on bandwidth when transmitting several millions of polygons over the Internet. The client-side decomposition of the raster grid alleviates some of the load on
(Based on Ordnance Survey material with the permission of Ordnance Survey © Crown Copyright 2006)
bandwidth and thus demonstrates another major benefit of Java3D-based applets. After creating the smaller raster grids, GeoDOVE renders each grid cell as two triangular planes. For each vertex on these triangular planes, the system must compute a texture coordinate. These provide mappings from texture coordinate space to geometry space. Java 3D offers the TexCoordGeneration class for automatically computing texture coordinates. As Java3D scales the two axes in texture coordinate space from zero to one, GeoDOVE generates the texture coordinates for each vertex (x, y) using: S coordinate = planeS ∗ x + sOffset T coordinate = planeT ∗ y + tOffset where planeS = 1/(maxx − minx); planeT = 1/(maxy − miny); sOffset = −minx ∗ planeS; tOffset = −miny ∗ planeT; minx = minimum x coordinate; miny = minimum y coordinate; maxx = maximum x coordinate; and maxy = maximum y coordinate.
4
Visualization with buildings presented as extruded polygons.
5
Digital elevation model using color shading.
Performance evaluation Comparing 3D Web-based GISs is difficult because their functionality varies significantly. For example, native Web-based 3D viewers are faster because they run directly from the client, whereas Java3D applets are slightly slower because they run from a Java virtual machine.7 The JavaVM runs on the client, resulting in a three-tier model instead of the two-tier native model. However, Java3D offers advanced functionality, including the ability to upload VRML and other 3D file formats.8 Consequently, to determine whether our architecture offers acceptable system performance, we based our evaluation on the widely accepted 10-second limit for keeping users’ attention on a task.9 Our evaluation aimed to show that GeoDOVE performs tasks within this 10-second limit. Because data load directly affects system performance, we also evaluated GeoDOVE with different sized data sets. The data sets included a range of both raster and vector geospatial layers, varying in size and extent, to simulate a complete geospatial visualization. As an additional performance indicator, the evaluation also included monitoring the frame rate as the user navigated through the visualization. The client machines were Windows PCs with 3.0GHz Intel processors. We ran the applet from a Java 1.5 VM. We separated the tasks into data upload and visualization operations. The upload timer started at the moment a client sent a data set request to the server. The visualization timer started when the user told the system to start creating the 3D geometry (a DEM from raster data or extruded polygons from vector data). Figure 6a (next page) shows the results from the upload and visualization of vector data as extruded polygons. The vector file sizes ranged from 0.4 Mbytes for 1,000 polygons to 15.2 Mbytes for 14,000 polygons. To improve objectivity, the vector layers had coincidental centers; thus, every large file contained all polygons in files smaller than it. We selected the city of Newcastle upon Tyne as the study area because of its high building
density, as Figure 7 shows. Figure 6b shows results for the upload and visualization of raster data as a DEM.
Results As Figure 6a illustrates, for vector files of up to 12,500 polygons (10 Mbytes in size), the application extrudes polygons within the accepted 10-second (10,000millisecond) limit. Vector file uploading is slightly faster than vector extrusion, particularly as the number of polygons increases (the uploading stage exceeds the limit specified only when the number of polygons is greater than 13,000 polygons, or 11 Mbytes). Expectedly, complex polygons such as St. James’ Park stadium (see Figure 7) took longer to upload or extrude because of the higher numbers of vertices. DEM creation from raster data sets was significantly faster and more con-
IEEE Computer Graphics and Applications
31
Exploring Geovisualization
Response time (milliseconds)
16,000 Upload Extrusion
14,000 12,000 10,000 8,000 6,000 4,000 2,000 0
1
2
(a)
3
4 5 6 7 8 9 10 11 12 13 14 Number of polygons (thousands)
22,500 Upload
Response time (milliseconds)
20,000
Digital elevation model creation
17,500 15,000 12,500 10,000 7,500 5,000 2,500 0
250
500
(b)
750 1,000 1,250 1,500 1,750 2,000 2,250 2,500 Image width and height (pixels)
6 Response times for (a) the upload and extrusion of vector layers and (b) the upload and creation of DEMs from raster layers.
St. James’ Park
7 32
The study area selected for the evaluation.
July/August 2006
(Based on Ordnance Survey material with the permission of Ordnance Survey © Crown Copyright 2006)
stant than raster upload, as Figure 6b indicates. Surprisingly, DEM creation from raster data sets never appears to reach the 10-second limit. Instead, raster upload exceeds our limit for files larger than 2,100 × 2,100 pixels (15 Mbytes in size). The frame rate we observed during the vector data set rendering ranged from 19 to 34 frames per second (fps). We recorded the lower frame rate only when displaying all buildings at once. We observed the higher
value when flying through the extruded buildings. This range in frame rate is acceptable because, as Selman notes in Java 3D Programming, “for smooth animation, a rate of 20 fps or more is desirable.”7 Reducing the Java applet’s size to approximately 500 × 500 pixels appeared to improve performance. Rendering raster data sets on flat polygons produced the highest frame rate (61 fps); however, draping raster data sets on DEMs reduced the frame rate to approximately 23 fps. We attribute this decrease in frame rate to the higher number of triangles inherent in a DEM. As before, the frame rate increases when flying through the DEM because there are fewer triangles to render in the field of view.
Conclusion Our prototype can connect to heterogeneous relational databases. It reads the geospatial data directly from the RDBMS without needing either middleware or translation into intermediary 3D modeling languages. We can alter the appearance of 3D shapes created in the virtual world during runtime, making the 3D visualization dynamic even after the system has retrieved the data from the RDBMS. GeoDOVE’s direct connectivity to spatially enabled RDBMSs demonstrates a significant advantage of using Java3D for geovisualization, because it allows for server-side coordinate transformations between the WGS84 system and more than 2,000 spatial reference systems. Likewise, client-side raster decomposition highlights a significant benefit of using Java3D for geovisualization, because it reduces the load on bandwidth. Java3D’s capabilities address some of the issues raised by the GeoVRML Working Group with regard to VRML and GeoVRML. We thus conclude that Java3D can support Web-based 3D geospatial visualization of vector and raster files. Further research could investigate the relationship between response time and increasing processor speed. Results from such research could help researchers predict the speed of Java3D-based WebGISs on faster future machines. ■
Acknowledgments We produced this article from PhD research jointly funded by the University of Newcastle upon Tyne and the Overseas Research Students Awards Scheme (ORS Ref: 2004029022) of the Universities UK organization. The study uses Ordnance Survey’s OS MasterMap data.
References 1. B. Huang, “Web-Based Dynamic and Interactive Environmental Visualization,” Computers, Environment, and Urban Systems, vol. 27, no. 6, 2003, pp. 62-636. 2. M. Batty et al., “Modelling Virtual Urban Environments,” Center for Advanced Spatial Analysis, University College London, 1998; http://www.casa.ucl.ac.uk/modelvue.pdf. 3. J. Gong, P. Cheng, and Y. Wang, “Three-Dimensional Modeling and Application in Geological Exploration Engineering,” Computer and Geosciences, vol. 30, no. 4, 2004, pp. 391-404.
4. Open Geospatial Consortium, “Simple Features⎯SQL,” 2005; http://portal.opengeospatial.org/files/?artifact_ id=13228. 5. K. Moore, J. Dykes, and J. Wood, “Using Java to Interact with Geo-Referenced VRML within a Virtual Field Course,” Computers and Geosciences, vol. 25, no. 10, 1999, pp. 11251136. 6. European Petroleum Survey Group, “Coordinate Conversions and Transformations Including Formulas,” guidance note 7, part 2, 2005; http://www.epsg.org/guides/docs/ G7-2.pdf. 7. D. Selman, Java 3D Programming, Manning Publishers, 2002. 8. A.E. Walsh and D. Gehringer, Java3D API Jump-Start, Prentice-Hall, 2002. 9. J. Nielsen, Designing Web Usability, New Riders Publishing, 2000.
Gobe Hobona is a PhD candidate in geomatics at the University of Newcastle upon Tyne. His research interests include applications of visualization and data mining techniques in geographic information retrieval. Hobona has a BSc (hons) in geographic information science from the University of Newcastle upon Tyne. Contact him at G.E.Hobona@ncl. ac.uk PURPOSE The IEEE Computer Society is the world’s largest association of computing professionals, and is the leading provider of technical information in the field. MEMBERSHIP Members receive the monthly magazine Computer, discounts, and opportunities to serve (all activities are led by volunteer members). Membership is open to all IEEE members, affiliate society members, and others interested in the computer field. COMPUTER SOCIETY WEB SITE The IEEE Computer Society’s Web site, at www.computer.org, offers information and samples from the society’s publications and conferences, as well as a broad range of information about technical committees, standards, student activities, and more. BOARD OF GOVERNORS Term Expiring 2006: Mark Christensen, Alan Clements, Robert Colwell, Annie Combelles, Ann Q. Gates, Rohit Kapur, Bill N. Schilit Term Expiring 2007: Jean M. Bacon, George V. Cybenko, Antonio Doria, Richard A. Kemmerer, Itaru Mimura,Brian M. O’Connell, Christina M. Schober Term Expiring 2008: Richard H. Eckhouse, James D. Isaak, James W. Moore, Gary McGraw, Robert H. Sloan, Makoto Takizawa, Stephanie M. White Next Board Meeting: 01 Nov. 06, San Diego, CA
IEEE OFFICERS President : MICHAEL R. LIGHTNER President-Elect: LEAH H. JAMIESON Past President: W. CLEON ANDERSON Executive Director: JEFFRY W. RAYNES Secretary: J. ROBERTO DE MARCA Treasurer: JOSEPH V. LILLIE VP, Educational Activities: MOSHE KAM VP, Pub. Services & Products: SAIFUR RAHMAN VP, Regional Activities: PEDRO RAY President, Standards Assoc: DONALD N. HEIRMAN VP, Technical Activities: CELIA DESMOND IEEE Division V Director: OSCAR N. GARCIA IEEE Division VIII Director: STEPHEN L. DIAMOND President, IEEE-USA: RALPH W. WYNDRUM, JR.
Philip James is a lecturer in geographic information science at the University of Newcastle upon Tyne. His research interests include spatial databases management, Web-based data dissemination techniques, and applications of Grid-based computing in GIS. James has a BA in Japanese from the University of Newcastle upon Tyne. Contact him at
[email protected]. David Fairbairn is a senior lecturer in geomatics at the University of Newcastle upon Tyne, and is a vice president of the International Cartographic Association. His research interests include cartography and geovisualization and their applications, such as urban growth modeling, disaster management, and map use. Fairbairn has a PhD in geomatics from the University of Newcastle upon Tyne. Contact him at
[email protected].
For further information on this or any other computing topic, please visit our Digital Library at http://www. computer.org/publications/dlib. EXECUTIVE COMMITTEE President:
DEBORAH M. COOPER* PO Box 8822 Reston, VA 20195 Phone: +1 703 716 1164 Fax: +1 703 716 1159
[email protected]
COMPUTER SOCIETY OFFICES Washington Office 1730 Massachusetts Ave. NW Washington, DC 20036-1992 Phone: +1 202 371 0101 Fax: +1 202 728 9614 E-mail:
[email protected] Los Alamitos Office 10662 Los Vaqueros Cir., PO Box 3014 Los Alamitos, CA 90720-1314 Phone:+1 714 821 8380 E-mail:
[email protected] Membership and Publication Orders: Phone: +1 800 272 6657 Fax: +1 714 821 4641 E-mail:
[email protected] Asia/Pacific Office Watanabe Building 1-4-2 Minami-Aoyama,Minato-ku Tokyo107-0062, Japan Phone: +81 3 3408 3118 Fax: +81 3 3408 3553 E-mail:
[email protected]
President-Elect: MICHAEL R. WILLIAMS* Past President: GERALD L. ENGEL* VP, Conferences and Tutorials: RANGACHAR KASTURI (1ST VP)* VP, Standards Activities: SUSAN K. (KATHY) LAND (2ND VP)* VP, Chapters Activities: CHRISTINA M. SCHOBER* VP, Educational Activities: MURALI VARANASI† VP, Electronic Products and Services: SOREL REISMAN† VP, Publications: JON G. ROKNE† VP, Technical Activities: STEPHANIE M. WHITE* Secretary: ANN Q. GATES* Treasurer: STEPHEN B. SEIDMAN† 2006–2007 IEEE Division V Director: OSCAR N. GARCIA† 2005–2006 IEEE Division VIII Director: STEPHEN L. DIAMOND† 2006 IEEE Division VIII Director-Elect: THOMAS W. WILLIAMS† Computer Editor in Chief: DORIS L. CARVER† Executive Director: DAVID W. HENNAGE† * voting member of the Board of Governors † nonvoting member of the Board of Governors
EXECUTIVE
STAFF
Executive Director: DAVID W. HENNAGE Assoc. Executive Director: ANNE MARIE KELLY Publisher: ANGELA BURGESS Associate Publisher: DICK PRICE Director, Administration: VIOLET S. DOAN Director, Information Technology & Services: ROBERT CARE Director, Business & Product Development: PETER TURNER Director, Finance and Accounting: JOHN MILLER rev. 18 May 06