Kim3}@unlv.edu. Abstractâ Many scientific applications generate massive data that ... based data visualization tools, that is, Google Charts, Flex,. OFC, D3, and ...
2014 IEEE International Conference on Systems, Man, and Cybernetics October 5-8, 2014, San Diego, CA, USA
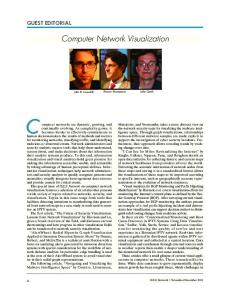
Performance Testing of Web-Based Data Visualization Sungchul Lee1, Ju-Yeon Jo2, Yoohwan Kim3 Department of Computer Science, University of Nevada, Las Vegas, NV, USA lees1731@ unlv.nevada.edu {Juyeon.Jo2, Yoohwan.Kim3}@unlv.edu � project. Section II shows the related work and Section III Abstract— Many scientific applications generate massive explains the current NCCP data processing structure. data that requires visualization. For example, the Nevada Section IV explains some of the most widely used web Solar Energy-Water-Environmental Nexus project has visualization tools. Section V explains our challenges and been generating a large amount of environmental chart test environment. Also, we show the testing results monitoring data in textual format. As the data is available and the analysis. Lastly, section VI presents the on the web, a web-based visualization tool is desirable for conclusions. the project rather than a standalone tool. This research analyzes the processing mechanisms of four popular webII. RELATED WORK based data visualization tools, that is, Google Charts, Flex, OFC, D3, and compares their performances. A standalone Data visualization in an off-line environment has been visualization tool, JfreeChart, have been also used for used for long time. So, most of visualization data research comparison. The processing times have been divided into is performed by off-line visualization tools. Mathematical three segments, layout time, data transformation time, and tools such as Matlab [5], Mathematica [6], GODIVA [7] rendering time, and separately measured. The actual and so on, typically included visualization routines. And temperature data from the Nevada Nexus project has been quite a few off-line visualization tools such as Origin [8], used for testing in different scales ranging from 100 to Mayavi [9], R-software [10] and so on. Nowadays, 100,000 data points. The result shows that each however, the need for web based data visualization is visualization tool has its own ideal environment. growing due to the popularity of web interface. Figure 1 illustrates the different styles of visualization for webKeywords- Data Visualization, Sensor Data, Google Charts, based and standalone processing. Figure 1(a) shows the D3.js, Open Flash Chart, JFreeChart, Flex process of web-based visualization where a web-based I. INTRODUCTION server fetches the data from data storage, processes it to a graphical format, and delivers it to a web client. Once the Scientific data visualization is useful in understanding visualization is done, the result is delivered in a graphics the nature of the data and its underlying systems [1]. file. Unlike the standalone processing where all the data Especially when the data size is large, the utility of and visualization software reside on one machine, the webvisualization is more pronounced. However, a large-scale based visualization does not have the data in advance and data visualization in real-time can be challenging due to the data must be transferred from the database to the web communication delay and the processing overhead [2]. server, and then to the web client. This is negligible in case The Solar Energy-Water-Environment Nexus project of small data, but the delay could be significant in case of in Nevada generates a large amount of data from sensors large data [11]. [3]. This data is useful for a number of research fields, such The processing time can be broken down to stages such as soil, atmosphere, biologic, ecologic, and so on. Variety as display time, data transfer time, system execute time and of environmental data has been collected and made so on. However, most research measures the processing available publicly at Nevada Climate Change Portal time as a whole without defining the stages [12]. Also, (NCCP) site since 2011 [4]. Sensors are installed at nine most of the previous researches on web-based different sites in Nevada and each site collects 85 different visualization focused on a single tool, such as EnVision types of data. Currently the data is available for download [13] or D3 [7], not a comparison of multiple tools. In in a textual format, but it is desirable to deliver a graphical another case, the test was performed only on the client side representation of the data on the web. We found that the process of visualization is somewhat challenging due to the volume of data. NCCP collects sensor data every minute Web from each site, and as a result, over four hundred million HTML5 SQL Visualization JavaScript DataBase library data points are collected at NCCP database per year. There are over five hundred thousand data points just for Web Browser Web Server (a) temperature alone in one site. Transforming this data into a graphical format in real-time on the web server is quite demanding. Pre-processing them is difficult because there Visualization SQL DataBase tools are so many sensor data combinations, chart types, and the lengths of period which could be requested by the users. Application (b) In this paper, we present the findings from the test of popular web-based data visualization tools in processing a Figure 1. Comparison of Visualization Processes (a) Web-based visualization; (b) Standalone application-based visualization. large volume of data that are obtained from Nevada Nexus
978-1-4799-3840-7/14/$31.00 ©2014 IEEE
1648
Sheep 1 Met CR3000 TenMin ……………………… CPU:SHEEP1.CR3 55878 ……………………… 201000 ……………………… 12.224.437701
seconds delay [16]. Therefore we are interested in finding the best software in efficiency and reliability. In the next section, we introduce popular web-based visualization tools and compare their features. IV. WEB VISUALIZATION TOOLS While most of the data visualization researches focused on small amount of data, our intention is investigating their capability in handling large data. For this purpose, we examined four different types of web-based visualization tools, namely, Google Chart, Open Flash Chart (OFC), Adobe Flex, and D3.js. The visualization is fundamentally a series of data transformation (Figure 8). The raw data is transformed into a specific input data format for each tool such as XML, JSON or DataTable. This input data is converted into a set of parameters specifying the graphics. These parameters are finally rendered into a graphics file such as SVG or JPG. There are different formats for the charts. OFC and Flex use Flash library for its rendering engine, while Google and D3 use the built-in rendering functions in HTML5. HTML5 is the latest standard of the Hyper Text Markup Language (HTML), can play animation or music natively without any additional plugins [17]. Therefore an HTML5 enabled web browser is necessary to use Google Charts or D3, such as MS Internet Explorer 9 or later. All four tools generate the charts in Scalable-VectorGraphics image (SVG), an XML-based vector image format for two-dimensional graphics, interactivity, and animation [18]. SVG can interact with the client without additional sever connection. For example, users can change the period of time and filter the data locally without contacting the server. The SVG browser supports interactivity through variety of menus, such as visual entity in the chart, category pickers, range sliders, etc. For comparing these web-based visualization tools with a standalone off-line tool, we made a chart using Jfreechart, a free java chart library [19]. With Jfreechart, it is easy to visualize the raw data on the client side. However, it can be also used on the server side to generate a static image. Figure 3 shows the visualization result from the four tools with the same input data. For a fair comparison, the simplest graph format (line graph) was chosen. 1) Google Charts: Google charts is one of the free tools for web chart. Figure 3(a) shows a sample Google Charts graph with dashboard. It has various chart types such as line, calendar, maps, tree map, etc. [20]. Google Charts supports dashboards to provide a high level of interactivity and a wide selection of rendering features. It provides a cross-browser compatibility, e.g., for IE, or Firefox, and cross-platform portability, e.g., for iPad, iPhone or Android [21]. Therefore, web developers do not need to be aware of the end-user’s devices. Google Charts uses the DataTable class for feeding the data into visualization engine [22]. The DataTable class makes it easy to switch different charts and dashboards. It has various functions such as sorting, modifying, finding (max, min) and filtering. Also, the DataTable can be implemented by Google Spreadsheets or Fusion Tables.
Figure 2. Sample data from NCCP
without consideration of the server side processing. [14]. Other research focus only on the server side without considering the processing time on the client side such as rendering or the data transfer time [15]. In this paper, we investigate the data processing frameworks of popular web-based data visualization tools and compare their performances. We analyze their processing steps and measure the time consumption in each step for various volumes of data using the actual sensor data from the Nevada Nexus project. III. THE DATA SOURCE: NCCP� NCCP supports the Nevada infrastructure for climate change science, education, and outreach. NCCP operates the Nevada climate-eco-hydrology assessment network (NevCAN) for measuring environmental data such as, precipitation, pant canopy interception of snow, subsurface soil water flow, soil water content, snow depth, soil temperature, thermal flux, solar radiation, and so on [4]. NevCAN is connected to two regions in Nevada, i.e., Snake Range and Sheep Range, which has eight and five sites respectively. And each site collects 85 different types of data. This data has been saved since 2011 and there are currently over 500 GBytes of data. As new sensors are installed, the amount of data collected is growing. Figure 2 shows a sample data structure that is collected by NevCAN. It is structured in Extensible Markup Language (XML) format. The head tag specifies the environment where the data was taken and the description of the data fields. The data tag contains the measurement time and data. This data is stored in Microsoft SQL Server, and made available to public through via the NCCP website. Users can specify the data types, locations, and the length of period, then download the data in text format. We are investigating the best method to visualize the data on the NCCP web site and discovered that it is challenging when the data size is large. We use temperature data for the purpose of testing the visualization performance. This temperature data alone contains more than 500,000 data points. With the current advanced computing systems, it may sound trivial to visualize them, but in reality, it takes significant time to process them. For instance, if responding time is 1 second late, users can generally feel the delay. Moreover, users will be losing focus after 10
1649
�D
�E
�G
�F
Figure 3.
Visualization outputs: (a) Google Chart; (b) OFC; (c)Flex; (d) D3
2) Open Flash Chart: OFC is also free web charts tool [23]. Figure 3-(b) shows a sample OFC graph with the same data as Google Chart. It has 12 basic chart types such as bar, line, 3D, Glass, fade, sketch, area, pie, scatter, highlow-close, candle, and mixed scatter. Although OFC does not have advanced chart features compared with other chart tools, it is easier to learn than other tools to draw chart.� � The chart uses the SVG image format, so the user can interact with the chart. For example, the user can display information of entities when the mouse pointer is over a point on the line. Like Google Charts, it is also crossbrowser and cross-platform. Even though OFC has not been updated since 2007, December, many web sites still use it because of the high availability of the source code. 3) Adobe Flex: Figure 3(c) shows the sample Adobe Flex graph with the same data. It is software development kit (SDK) for the deployment of cross-platform Rich Internet Applications (RIA) based on the Adobe Flash platform [24]. The online application is executed on the client side like a desktop application using RIA [25]. This reduces the workload on the server [26]. Adobe Flex works crossplatform and uses the SVG format. So, the chart created by Adobe Flex can be interacted with the users locally. Since NCCP’s data format is XML [27], the data can be used natively by Adobe Flex which uses MXML (Mining eXtensible Markup Language), an XML-based user interface markup language [28]. Also, data can be visualized in various types, e.g., picture, animation, or charts. Adobe Flex requires Adobe Flash running on the client machine. Adobe Flex application (Adobe Flex Builder 3.0) that is used for creating an MXML file is not free, but the reader (SDK) is available freely.� 4) D3.js: Figure 3(d) shows D3 chart using same data as Google chart. It is freely available under Berkeley Software Distribution (BSD) license. D3.js supports various types of visualization in W3C-compliant computing. It uses a JavaScript library for data-driven document [7]. For the graphical representation, it uses SVG, HTML5, and Cascading Style Sheets (CSS) [12]. D3 is difficult to learn than Google Charts, OFC or
Adobe Flex. But it is more powerful than other tools in scientific data analysis. D3 supports advanced visualization algorithms such as geography, geometry, and behaviors. The complicated data can be easily displayed by D3’s array operations. It has various functions to assist visualization and data analyze such as math, ordering, shuffling, permuting, merging, bisecting, nesting, manipulating associative arrays and map, and set collections. Table 1 shows the summary of four web chart tools and one application chart tool. Those five chart tools can visualize data with free licenses. Among the four web chart tools, Flex and D3 can visualize data with more diverse methods. Google Charts and OFC are easier to learn than others, although limited in expressive power. So, they are more useful in visualizing simple data quickly. Flex and D3 have not only chart functions but also various visualization functions such as animation and interactions. They are suitable for complex data analysis and more powerful visualization. However, the benefit of advanced visualization capability diminishes as the data size increases. In the performance testing, presented in section V, Flex showed a dramatically poor performance at a high data size, i.e., at 50,000 data points. It also stopped responding occasionally. Google Charts and D3 did not stop when handling over 100,000 data points. In other words, we observed a trade-off between capability and reliability. Basically, web-based visualization process is divided into two parts, one on the client side and the other on the server side. However, each tool employs different technology on the client and server sides. Figure 4(b) Data type SVG Web base performance
Google Charts DataTable o o slowest
OFC JSON o o fast
Flex XML o o fast
D3.js Jfreechart JSON,XML,CVS Raw data o x o x fast fast
interface
various
simple
various
various
simple
Learning tree
easy
easy
normal
hard
hard
any web any web any web any web Compatibility application browser browser browser browser (IE: over ver. 9) (Flash required) (Flash required) (IE: over ver. 9) License free GNU Apache License BSD LGPL
1650
Table 1. Comparison of five chart tools
(a) Google Charts
(b) Flex and OFC
(c) D3
Figure 4. Flow chart of visualization tools with server
shows the interaction diagrams of Flex and OFC. Although visualization library is embedded in the page, they need Flash software to visualize data in the client side. However, Google Charts uses a Google server to generate the visualization result in SVG format. Figure 4(a) shows the interaction sequence in Google Charts. In case of D3, it uses use the D3 visualization library embedded in the web browser. As shown in Figure 4(c), server responds with D3 visualization library. V. PERFORMANCE TESTING We measure the data handling it on the server side such as sending the data and formatting the charts, and the graph rendering time on the client side such as drawing the background and charts. In each test run, the measured times are slightly different because of the background tasks. We performed the test 10 times and the browser cache was cleared after each test run. The average data is shown in Figure 7. It is difficult to draw chart with 100,000s of data points. It may be easier to pre-process them to reduce the number of data points, e.g., averaging, but we lose the data fidelity. In this test, we used the raw data without any preprocessing. We draw charts using Google Chart, OFC, Flex and D3 with over 150,000 temperature data. This test was executed in Google Chrome using Chrome Developer tools and Speed Tracer. Chrome Developer can track the memory usage, CPU, heap area, etc., for the visualization tools. Figure 5 shows a screenshot of Chrome Developer for memory tracking. Speed Tracer shows events times such as XMLHttpRequest time, data request time, and duration to the server [29]. Figure 6 shows the screenshot of Speed Tracer. Using the event duration information in Speed Tracer, we can break down the time consumption
Figure 5. Chrome Developer with Memory Timeline
into Layout time, Data Transformation time, and Visualize Data time. In the next section, we clarify those times and explain them more in detail.� For more accurate analysis, we divided the processing time into three parts, i.e., Layout time, Data Transformation time, and Rendering time.� 1) Layout Time: Layout includes label and background of chart. When client requests a chart, RIA draws the layout first. Figure 7(a) is the layout time of the web visualization tools. X-axis indicates the number of data point and Y-axis indicates the time. Google Charts is slowest in the layout time, because Google Charts requests the library to be downloaded from the Google server as shown in Figure 4(a). Google Charts’ terms of service requires that the visualization libraries from the Google server should be dynamically loaded before each use. However, OFC and Flex use Flash software which is already installed at the client machine. In case of D3, its library is embedded within the HTML webpage. In summary, OFC and Flex display the layout using the client side library. D3 library is loaded by the server. However, Google Charts should load the library from Google server by using google.load() method.� � � � 2) Data Transformation Time: This time includes the time for the web server to fetch the data from the database, and the data transfer time from the web server to the web browser, the data transformation time from the raw data (XML) to input data type (e.g., DataTable), the time to generate the SVG parameters. As mentioned before, OFC, Flex, or D3, can use the raw data in XML, so there is no need for data transformation. But Google Charts requires the conversion to DataTable at the browser. The resulting DataTable is sent to the Google Charts server, where it is
Figure 6.Speed Tracer
1651
100 3 3 0 0
1k 3 4 1 1
10k 6 9 1 1
50k 21 30 2 1
100k 40 67 2 1
100
1k
10k
50k
100k
100
1k
10k
50k
100k
D3 Google OFC Flex
D3 Google OFC Flex
0.016 0.231 0.077 0.140
0.030 0.275 0.078 0.150
0.122 1.212 0.084 0.154
0.493 2.78 0.076 0.156
0.901 5.5 0.081 0.223
D3 Google OFC Flex
0.624 0.852 0.673 3.79
0.61 0.937 0.323 4.272
0.648 0.89 3.869 9.519
0.697 1.39 20.594 55.018
0.999 2.75 40.75 202.1
Jfree
N/A
N/A
N/A
N/A
N/A
Jfree
N/A
N/A
N/A
N/A
N/A
Jfree
0.089
0.172
1.038
5.146
9.224
(a) Layout Time (ms)
(b) Data Transformation Time (s)
(c) Rendering Time (s)
Figure 7. Compare performance of visualization tools
transformed in to the SVG parameters, then delivered to the web browser. This increases the processing time got Google Charts dramatically. Figure 7(b) shows the data transformation time of web visualization tools. Google Charts takes the longest time to transformation data. � � � � Figure 8 shows the data transformation flow. From the input file, the visualization tools generate the image data in SVG format. In D3 and Google Charts, the input data are passed to the visualization routine in JavaScript in HTML5-enabled web browser. However, OFC and Flex pass it to the visualization routine at Flash. Flash is a native program for the underlying hardware, and thus much faster than script execution within a web browser. So, OFC and Flex are faster than D3 or Google Charts in the data transformation time. 3) Rendering Time: This stage measures the duration from the time the web browser receives the SVG file to the time that a user sees the image on screen. Visualization tools spend most of the time in rendering the charts. Figure 7(c) shows the rendering times of web tools and also JfreeChart. We added Jfreechart to compare the performance of an offline standalone program. As shown in the figure 7(c), D3 and Google Charts are faster than JfreeChart in the visualization testing. Performance of other web visualization tools is worse than JfreeChart. � To understand the internal behavior of the tools, we studied the dynamic memory usages of the visualization tools using Heap Profile function in Developer Tools [30] in Chrome browser. Table 2 shows the memory usage of shallow sizes in the heap area in visualization tools. There are over three hundreds constructors such as raw data, date, number, etc., but we focus on Object (SVG), Array (contains SVG parameter data) and Total memory usage. This memory usage is related to the rendering time. As shown in Table 2, Flex and OFC use smaller memory than other tools. Interestingly, the memory usage of Flex and Constructor Array Object(SVG) Total
Google Charts 10k data 5,200,176 2,679,208 14.8MB
Google Charts 50k data 15,151 040 3,356,464 43.9MB
OFC 10k data 613,744 47,092 3.4MB
OFC 50k data 928,248 47,092 6.8MB
Flash Flex OFC XML JSON � Raw Data
SVG parameter Google D3 HTML5 Figure 8. Data Transformation flow
OFC increase only by small amount upon increasing the data size. Flex uses 1.3MB memory for 10000 data points and but only 1.7 MB for 50000 data points. However, D3 uses 4.2 MB for 10000 data points and 10.1MB for 50000 data points. Since we do not have the source code, we do not know how the memory is handled. One possible conjecture is that the XML file is retained as a whole in the memory in case of browser-based tools such as Google Charts and D3 resulting in a large memory usage, while it is converted to numbers in case of Flash-based tools such as OFC and Flex. We leave this analysis as a future work. We also tested the performance with other browsers such as IE and Firefox. However, only the total time was available with them, not the time by the stage. We observed the relative order of the total time is still the same, so we only presented the data with Chrome. The test results show us that each tool has its own wellsuited environment. D3 is fastest in handling large amount of data with reasonable memory usage. Flex is most useful for small amount of data. It can also visualize the data not only in charts but also by animation or in many different types. OFC is easy to implement and it uses less memory. It has a reasonably good performance, so it may be best if the memory usage is a concern. Google Charts is the slowest due to the communication overhead with the server. But it has a strong ground in the web environment because the DataTable in Google Chart can be easily converted to other web tools such as Google sheet, map, and so on. � D3 10k data 956,140 171,772 4.2MB
D3 50k data 2,401,920 231,696 10.1MB
Table 2. Memory usage of Google Charts, OFC, D3, and Flex (in bytes)
1652
SVG file
Flex 10k data 313,848 25,748 1.3MB
Flex 50k data 402,644 28,812 1.7MB
VI. CONCLUSION This paper surveyed popular web-based data visualization tools and measured their performances. The goal of this research is finding the best visualization method for a large volume of data such as in Nevada Nexus project where a large volume of environment monitoring data is collected. We tested four different types of visualization tools, that is, Google Charts, Flex, OFC and D3 as well as a standalone visualization tool, JfreeChart. Their visualization processes and interactions have been analyzed. The processing time has been divided into three segments, layout time, data transformation time, and visualization time, and their performances were measured with 100,000 data points that were actually collected at the Nevada Nexus project. The results show that each visualization tool has strength in some areas. Google Charts is best for general users with user-friendly interface with somewhat limited functionality. OFC is good for handling a large amount of data for rendering charts. Flex can make various types of visualization such as table, animation, or 3D graphics. D3 is suitable for scientific visualization with various display types with minimal processing delay. In case of the Nevada Nexus project, D3 is considered best with its high processing speed. The memory performance has been also analyzed, which showed a trade-off relationship between the speed and memory usage. ACKNOWLEDGEMENT This material is based upon work supported by the National Science Foundation under grant number IIA1301726. DISCLAIMER Any opinions, findings, and conclusions or recommendations expressed in this material are those of the author(s) and do not necessarily reflect the views of the National Science Foundation. REFERENCES [1] Jianghui Ying, Gracanin D, Chang-Tien Lu, “Web Visualization of Geo-Spatial Data using SVG and VRML/X3D”, Multi-Agent Security and Survivability, 2004 IEEE First Symposium on, Dec. 2004, pp. 497-500 [2] Kwan-Liu Ma, ”Visualizing visualizations. User interfaces for managing and exploring scientific visualization data”, Computer Graphics and Applications, IEEE, Sep/Oct 2000, pp. 16-19 [3] Sungchul Lee, Juyeon Jo, Yoohwan Kim, Haroon Stephen, “A Framework for Environmental Monitoring with Arduino-based Sensors using Restful Web Service” Services Computing (SCC), 2013 IEEE International Conference on, June 28 2013 [4] Nevada Climate Change Portal Online available: http://sensor.nevada.edu/NCCP/Default.aspx [5] Azemi A, Stook C, “Utilizing MATLAB in undergraduate electric circuits courses”, Frontiers in Education Conference, 1996. FIE '96. 26th Annual Conference., Proceedings of, 6 Nov 1996,pp.599 -602 [6] Savory, P.A, “Using Mathematica to Aid Simulation Analysis”, Simulation Conference Proceedings, 1995. Dec 1995, pp. 1324-1328 [7] Xiaosong Ma, Winslett, M, Norris, J, Xiangmin Jiao, “GODIVA: Lightweight Data Management for Scientific Visualization Applications”, Data Engineering, 2004. Proceedings 20th International Conference on, 30 March 2004, pp. 732-743 [8] Yingqi Hao, ”Application Research on deformation monitoring of SMW method H steel pile using BOTDA”, Multimedia Technology,
2011 International Conference on, July 2011, pp. 3862 - 3865 [9] Ramachandran, P. Varoquaux, G, “Mayavi: 3D Visualization of Scientific Data”, Computing in Science & Engineering , March 2011, pp. 40- 51 [10] Voulgaropoulou, Sophia, Spanos, Georgios, Angelis, Lefteris, “Analyzing Measurements of the R Statistical Open Source Software”, Software Engineering Workshop (SEW), 2012 35th Annual IEEE, 12 Oct. 2012, pp. 1-10 [11] Rong Yao, Wang Jiandong, Ding jianli, “RIA-based visualization platform of flight delay intelligent prediction”, Computing, Communication, Control and Management, Aug. 2009, pp. 94- 97 [12] Bostock, M, Ogievetsky, V, Heer, J, “D3: Data-Driven Documents”, Visualization and Computer Graphics, IEEE Transactions on, Dec. 2011, pp. 2301- 2309 [13] Johnson G.P, Westing B.M, Johnson G.S, “EnVision: A Web-Based Tool for Scientific Visualization”, Cluster Computing and the Grid, 2009. CCGRID '09. 9th IEEE/ACM International Symposium on, 18 May 2009, pp. 603- 608 [14] Vogel B, Kurti A, Milrad M, Kerren A, “An Interactive Web-Based Visualization Tool in Action: User Testing and Usability Aspects”, Computer and Information Technology (CIT), 2011 IEEE 11th International Conference on, Aug. 31 2011, pp. 403-408 [15] Laufenberg M.J, “Integration of Large-Scale Visualization Systems into a Control Center”, Power Engineering Society General Meeting, 2005. IEEE, 12 June 2005, pp. 2712-2714 [16] Fiona Fui-Hoon Nah, “A study on tolerable waiting time: how long are Web users willing to wait?”,, AMCIS 2003, pp. 285 [17] Xixi Gong, Yuehui Jin, Yidong Cui, Tan Yang, ”Web Visualization of Distributed Network Measurement system based on html5”, Cloud Computing and Intelligent Systems (CCIS), 2012 IEEE 2nd International Conference on, Oct. 2012, pp. 519-523 [18] Quint A, ”Scalable Vector Graphics”, MultiMedia, IEEE (Volume:10 , Issue: 3 ), July. 2003, pp. 99-102 [19] Young Lee, Jeong Yang, Chang, K.H, “Metrics and Evolution in Open Source Software”, Quality Software, 2007. QSIC '07. Seventh International Conference on, 11 Oct. 2007, pp. 191-197 [20] Ying Zhu, ”Introducing Google Chart Tools and Google Maps API in Data Visualization Courses”, Computer Graphics and Applications, IEEE, Nov. 2012, pp. 6-9 [21] Sakamoto Y, Matsumoto S, Nakamura M, “A Integrating Service Oriented MSR Framework and Google Chart Tools for Visualizing Software Evolution”, Empirical Software Engineering in Practice (IWESEP), 2012 Fourth Int’l Workshop on, Oct. 2012, pp. 35-39 [22] Google Chart [Online]. Available: https://developers.google.com/chart/interactive/docs/index [23] Open Flash Chart (OFC) [Online]. Available: http://teethgrinder.co.uk/open-flash-chart/ [24] Juszkiewicz P, Sakowicz B, Mazur P, Napieralski A, “The use of Adobe Flex in Combination with Java EE Technology on the Example of Ticket Booking System”, CAD Systems in Microelectronics (CADSM), 2011 11th Int’l Conf. The Experience of Designing and Application of, Feb. 2011, pp. 317-320 [25] Heidenbluth N, Schweiggert F, ”Status Sensitive Components: Adapting Rich Internet Applications to their Runtime Context”, Digital Society, 2009. ICDS '09. Third International Conference on, 1 Feb. 2009, 133- 138 [26] Peintner D, Kosch Harald, Heuer J, “Efficient XML Interchange for Rich Internet Applications”, Multimedia and Expo, 2009. ICME 2009. IEEE International Conference on, June. 2009, 149-152 [27] Dittrich A, Dascalu S, Gunes M, “ATMOS: A Data Collection and Presentation Toolkit for the Nevada Climate Change Portal”, Proceedings of the Int’l Conf. on Software Eng. and Applications (ICSOFT-EA 2013), Reykjavik, Iceland, July 2013, pp. 206-2013. [28] Nammakhunt A, Romsaiyud W, Porouhan, P, Premchaiswadi W, “Process mining: Converting data from MS-Access Database to MXML format”, ICT and Knowledge Engineering, 2012 10th International Conference on, Nov. 2012, pp. 205-212 [29] Google Web Toolkit, Speed Tracer Online available: https://developers.google.com/web-toolkit/speedtracer/ [30] Chrome developer tools Online available: https://developers.google.com/chrome-developertools/docs/javascript-memory-profiling
1653