vironment, economy, and society) requires the construction of large .... a visual analytics approach to support the design of disease control strategies at ...
Workshop on Visualisation in Environmental Sciences (EnvirVis) (2015) A. Middel, G. Weber, and K. Rink (Editors)
Web-Based Visualization of the Global Change Assessment Model W. Luo1 , Z. Chang1 , L. Kong2 , R. Link3 , M. Hejazi3 , L. Clarke3 , and R. Maciejewski1 1 School
3
of Computing Informatics and Decision Systems Engineering, Arizona State University, Tempe, Arizona, USA 2 Center for Science and the Imagination, Arizona State University, Tempe, Arizona, USA
Joint Global Change Research Institute, Pacific Northwest National Laboratory, College Park, Maryland, USA
Abstract The Global Change Assessment Model (GCAM) is an integrated assessment tool for exploring consequences and responses to global change. However, the current iteration of GCAM relies on NetCDF file outputs which need to be output from the model and then exported for visualization and analysis purposes. Such a requirement limits the uptake of this modeling platform for analysts that may wish to explore future scenarios. In this work, we present a web-based geovisual analytics interface for GCAM. Challenges of this work include enabling both domain expert and model experts to be able to functionally explore the model. We explore the use of various aggregation layers, coordinated views and how choices of icons can enhance the understanding of the underlying data. Our primary focus is on understanding the simulated impact of climate change on sectors of the global economy. To demonstrate our work, we present a case study which explores the potential impact that the China south-north water transportation project in the Yangtze River basin will have on projected water demands. Categories and Subject Descriptors (according to ACM CCS): I.3.8 [Computer Graphics]: Applications—
1. Introduction Population growth and global climate change are two major stressors which have been indicated as a leading cause of concern for current fresh water supplies [VMG∗ 10]. While future projections agree that there will be water scarcity, understanding the links between water scarcity and other sectors (such as energy, economy, etc.) can be difficult. These difficulties pose challenges for analysts and policy makers when exploring the impacts of potential future city growth and infrastructure projects. The major issue is that applying simulation to the scope of sustainability (including environment, economy, and society) requires the construction of large asynchronous simulation pipelines, where the output of simulation models becomes the input for one or more other simulations arranged in a sequence with feedback. Future sustainability issues need to be assessed in the context of climate change and climate mitigation policies (for example, estimating both water supply and water demand), and while models combining climate model outputs, water budgets, and socioeconomic information have been developed to understand future water scarcity [VGSL00], it is difficult to understand their strictly quantitative outputs. Integrating c The Eurographics Association 2015.
those models into a visual analytics interface will enable users to make sense of data, facilitate their hypothesis development, and support their decision-making process. GCAM is a global integrated assessment model with particular emphasis on the interactions between global economic, energy, agricultural, land use, and technology systems. The version of GCAM used here is global in scope and disaggregated into 14 geopolitical regions, explicitly linked through international trade in energy commodities, agricultural and forest products, and other goods. This model has been widely applied to the assessment of changes in energy, agriculture, climate, and water, with a focus on understanding consequences and responses to global change [HEC∗ 14b]. However, GCAM has limited visualization abilities, relying on data exports to other programs to explore the outputs of their model. This lack of coupling makes the use of such models difficult, specifically in the policy space where users need to explore and compare impacts, trace policy decisions, and try to understand impact in both local and global contexts [PKSG12]. This paper presents a web-based geovisual analytics approach for enabling the exploration of simulation runs from
W. Luo, Z. Chang, L. Kong, R. Link, M. Hejazi, L. Clarke & R. Maciejewski / GCAM Visual Analytics
GCAM. Our tool consists of geographical, temporal, and multidimensional spaces, which allows users to explore water scarcity in terms of geographical variations, temporal change, and scenario comparison with different future climate policies. In this work, we explore design decisions for enabling policy makers to explore complex models. We also present a case study demonstrating the use of our system exploring the China south-north water transportation project. While still in the early stages of research, our goal is that this workshop paper will spark discussion on the need for visual analytics to also work in the policy space to enable effective decision making. 2. Related Work Previous work from visual analytics has focused primarily on the computational steering side of simulations. For example, Waser et al. proposed World Lines [WFR∗ 10] and Visdom [RWF∗ 13] to manage ensemble simulations of complex flooding scenarios. Ko et al. presented VASA [KZX∗ 14] for exploring supply chains and critical infrastructure links. We argue that there needs to be more focus on the policy side of the visualization component. Essentially, there is a large potential for applying visual analytics to complex systems that involves both the efficient presentation of simulation results to analysts and to policy makers. In this section, we will discuss previous work in visualizing the modeling and simulation domain and climate visualization. 2.1. Modeling and Simulation Visualization In the realm of sustainability, we must handle systems of systems where data in each simulation module resides at different spatial and temporal resolutions, the output from the models need to be explored, compared, and cross-correlated, and, most importantly, the interactions between models must also be understood. Traditionally, visualization of simulation runs focuses on the domain expert analyst or model builder. For example, Matkovic et al. [MGJ∗ 10] show that visual analytics can reduce the number of simulation runs by focusing users on interesting aspects of the data. Maciejewski et al. [MLR∗ 11] applied visual analytics techniques to support the exploration of parameter changes during disease simulation spreads, and Andrienko et al. [AA13] proposed a comprehensive visual analytics environment for spatial modeling libraries. Other work includes the IBM Supply Chain Simulator (SCS) [BA05] which visualizes relationships in the supply chain. Perez [BA05] also used Tableau to develop a supply chain model snapshot. Malik et al. [MMT∗ 14] presented a predictive visual analytics environment in supporting decision-making in terms of effective resource allocation and deployment through allowing users to focus on appropriate spatiotemporal resolution levels. Luo [Luo14] applied a visual analytics approach to support the design of disease control strategies at appropriate spatial resoultions in the epidemic domain. Kothur, et al. [KSDD14] presented a visual
analytics tool to compare ocean model output with reference data in order to detect and analyze geophysical processes in terms of their differences and similarities. 2.2. Climate Visualization Visualization has been considered as a key technology for representing and analyzing climate models and observations as well as relevant social and environmental data [NSBW08]. Designing intuitive visual representations in the climate context to faciliate hypothesis development by identifying complex patterns is an active research area. For example, Kehrer et al. [KLM∗ 08] demonstrated how interactive visual exploration can faciliate hypothesis generation with climate data. Ladstädter et al. [LSL∗ 10] demonstrated that the integration of classical statistics and interactive visual exploration can enhance the workflow of climate analytics. Hai and Guo [JG09] presented a multivariate geovisualization tool to support discovery and understanding of unknown complex patterns from the heterogeneity of climate related data, including space, time, and multiple variables. In addition to supporting pattern identification and hypothesis generation, the evaluation of climate models through visual analytics is another major research direction. For example, Steed et al. [SST∗ 12] evaluated climate models by identifying relationships between climate variables and their geographic associations. Potter et al. [PWB∗ 09] integrated ensemble datasets that combine multiple numeric climate models into the ViSUS/Climate Data and Analysis Tools (CDAT), in order to support uncertainty exploration. Poco et al. [PDW∗ 14] proposed a visual analytics tool to understand the correlation between similar spatio-temporal behaviors and similar grouping behaviors in the context of climate model comparisons. Overall, our work aims to develop visual analytics to support both model exploration and comparison in the climate context, in order to address the analysis of complex modeling tools with a focus on how to enable simulation comparison for advanced analysis. We propose a novel web-based tool that allows the exploration of water scarcity in terms of geographical variations and temporal change. The tool also enables users to formulate "what-if" questions by building different scenarios with different future climate policies. 3. System Design Our system provides a web-based visualization tool for GCAM which explores water-related climate change scenarios. GCAM is a dynamic-recursive model including representations of the global economy, the energy system, agriculture and land use, and climate [KEL∗ 06, CEJ∗ 07]. Hejazi et al [HEC∗ 14a] explicitly incorporated water demand, water supply, and water scarcity in GCAM. Water demand includes the following categories: irrigation, livestock, electricity, manufacturing, domestic, and primary enc The Eurographics Association 2015.
W. Luo, Z. Chang, L. Kong, R. Link, M. Hejazi, L. Clarke & R. Maciejewski / GCAM Visual Analytics
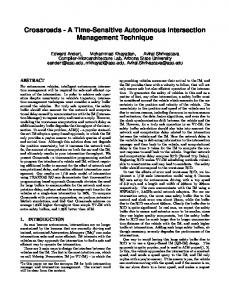
Figure 1: GCAM visual analytics tool at the basin scale. The legend design for water scarcity index (WSI) is adopted from Raskin’s definition [RGK∗ 97]: no scarcity(0∼0.1), low scarcity (0.1∼0.2), moderate scarcity (0.2∼0.4),severe scarcity (0.4∼1), and extreme scarcity (>1). The scenario design panel is on the left, the layer selection allows the map switch among grid scale, basin scale, and region scale. The time slider on the top allows users to explore different scenarios from a temporal perspective.
ergy production. GCAM tracks water demand, water supply, and water scarcity at different spatial scales, including 14 geopolitical regions, 235 water basins, and a grid scale of (0.5◦ × 0.5◦ ). GCAM estimates annual water demand, supply, and scarcity every five years from 2010 to 2090. The system is developed as a client-server architecture. On the server side, we implemented several RESTful services with JAVA for retrieving data from database and responding requests from clients. On the client side, we implemented functions using JavaScript to call the backend RESTful services through AJAX library to retrieve data. For web development, we applied D3.js library, OpenStreetMap, and other open source plugins to visualize the water related data. 3.1. GCAM Visual Analytics The GCAM visual analytics tool consists of three major views: the control scenario design view (Figure 1), the spatiotemporal view (Figure 1), and the scenario comparison view (Figure 2). The control scenario design view allows users to design different scenarios by combining four features: future precipitation, emission, global population, and the China South-North Water Project. The future precipitation features allow users to pick among three global climate models to caculate water availability at dry, mild, and wet futures. The emission feature allows users to design two mitigation strategies in terms of greenhouse gas emissions at low and high levels. The global population feature allows users to estimate the global population in 2050 from 8 to 10 billion in steps of 0.5 billion. The China South-North Water Transportation Project c The Eurographics Association 2015.
from the Yangtze River Basin to the Ziya He Basin allows users to turn on or off the project to understand its impact on both basins. In total, for the three future precipitations, two future emissions, five global populations, and two China South-North Water Projects, 60 (3 × 2 × 5 × 2) combinations are simulated for user exploration. The spatiotemporal view allows users to explore water supply, water demand, and water scarcity at three geographical scales: the grid scale at (0.5◦ × 0.5◦ ) resolution, the water basin scale with 235 different areas, and the geopolitical region scale with 14 regions every five years from 2010 to 2090. Three geographical maps are used to explore water supply, water demand, and water scarcity respectively. Water demand includes six different demand types: manufacture, irrigation, livestock, electricity, domestic and total. The three maps support coordination, so users can explore the same geographical locations from an integrated perspective of water supply, demand, and scarcity. The scenario comparison view allows users to compare the Yangtze River Basin and the Ziya He Basin in terms of their water scarcity over time. Users can compare the China South-North Water Transportation Project under different scenarios in terms of three future precipitations, two greenhouse gas emissions, and five global populations.
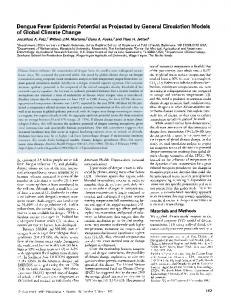
4. China South-North Water Transportation Project We apply our spatiotemporal view and scenario comparison view to explore the China South-North Water Transportation Project from the Yangtze River Basin to the Ziya He Basin. Figure 3 shows the spatial comparisons between Ziya He Basin in the China South-North Water Transportation Project. We pick the year 2030 with the scenario: dry future precipitation, low emissions, and 8 billion global population in the year of 2050. Compared to the left two figures, the right two figures show that the water supply and water scarcity appears to show some improvement when the China S-N project carries on. The water supply increases from approximately 43 km3 to approximately 72 km3 , whereas the water scarcity improves from extreme scarcity to severe scarcity. Figure 2 shows the temporal comparisons for water scarcity between the Yangtze River Basin and the Ziya He Basin in the China South-North Water Transporation Project from 2010 to 2090 under all possible combination scenarios among future precipitation, greenhouse gas emission, and population growth. All three sub figures exhibit consistently temporal patterns: No matter whether the China South-North Water Transportation Project carries on or not, the water scarcity becomes worse over time in the two basins; the water scarcity situations in Ziya He Basin improves significantly when the China South-North Water Transportation Project carries on, whereas the China South-North Water Transportation Project does not dramatically worsen the water scarcity situations in Yangtze River Basin. These spatial and temporal views allow us to easily isolate the project’s
W. Luo, Z. Chang, L. Kong, R. Link, M. Hejazi, L. Clarke & R. Maciejewski / GCAM Visual Analytics
Figure 2: Temporal comparisons for water scarcity in the China South-North Water Transportation Project: under future precipitation, future greenhouse gas emission, and future population growth scenarios from the top to the bottom.
Figure 3: Spatial comparisons between water supply and water scarcity in 2030 in the China South-North Water Transportation Project. The left two figures show that the China South-North Water Transportation Project is off, and the right two figures show that the project is on.
effects on scarcity over time in the simulation for both the donor and recipient basins. 5. Conclusion and Future Work In this paper, we implement a new web-based geovisual analytics tool for GCAM to allow analysts to explore water supply, water demand, and water scarcity in the context of climate change and climate change policies. We also demonstrate that such coupling can facilitate the decision-making
process with the China South-North Water Transportation Project by allowing analysts to explore and compare the impacts in both spatial and temporal contexts. We had a weekly meeting with GCAM team to collect their specific expectations and feedback to design and implement our tool. This tool is in the early stages of research, so four possible extensions of this work can be explored in the future: (a) given the close collaborations with analysts and policy makers from GCAM team, feedback from user-centered design will be continuously applied as the guidance for the future implementation; (b) according to the feedback from GCAM team, scenario comparison in a spatial context has been identified as our follow-up collaborative research; (c) given that the simulation results have been calculated beforehand for the current tool to visualize results, the next step is to couple the visualization tool with the simulation models into an integrated GUI; (d) our tool provides a visual-computational envrionment for NetCDF data, so it has the potential to be extended for broader climate-related research applications. Acknowledgements Some of the material presented here was sponsored by a grant from the Department of Defense and upon work supported by the National Science Foundation under Grant No. (NSF 1350573). Disclaimer: The views and conclusions contained herein are those of the authors and should not be interpreted as necessarily representing the official policies or endorsements, either expressed or implied, of ASU, DoD, or the U.S. Government. c The Eurographics Association 2015.
W. Luo, Z. Chang, L. Kong, R. Link, M. Hejazi, L. Clarke & R. Maciejewski / GCAM Visual Analytics
References [AA13] A NDRIENKO N., A NDRIENKO G.: A visual analytics framework for spatio-temporal analysis and modelling. Data Mining and Knowledge Discovery 27, 1 (2013), 55–83. 2 [BA05] B UCKLEY S., A N C.: Supply chain simulation. In Supply Chain Management on Demand. Springer, 2005, pp. 17–35. 2 [CEJ∗ 07] C LARKE L., E DMONDS J., JACOBY H., P ITCHER H., R EILLY J., R ICHELS R.: Scenarios of greenhouse gas emissions and atmospheric concentrations. US Department of Energy Publications (2007), 6. 2 [HEC∗ 14a] H EJAZI M., E DMONDS J., C LARKE L., K YLE P., DAVIES E., C HATURVEDI V., W ISE M., PATEL P., E OM J., C ALVIN K.: Integrated assessment of global water scarcity over the 21st century under multiple climate change mitigation policies. Hydrology and Earth System Sciences 18, 8 (2014), 2859– 2883. 2 [HEC∗ 14b] H EJAZI M., E DMONDS J., C LARKE L., K YLE P., DAVIES E., C HATURVEDI V., W ISE M., PATEL P., E OM J., C ALVIN K., ET AL .: Long-term global water projections using six socioeconomic scenarios in an integrated assessment modeling framework. Technological Forecasting and Social Change 81 (2014), 205–226. 1 [JG09] J IN H., G UO D.: Understanding climate change patterns with multivariate geovisualization. In IEEE International Conference on Data Mining Workshops, 2009. ICDMW’09 (2009), IEEE, pp. 217–222. 2 [KEL∗ 06] K IM S. H., E DMONDS J., L URZ J., S MITH S. J., W ISE M.: The objects framework for integrated assessment: Hybrid modeling of transportation. The Energy Journal (2006), 63–91. 2 [KLM∗ 08] K EHRER J., L ADSTADTER F., M UIGG P., D OLEISCH H., S TEINER A., H AUSER H.: Hypothesis generation in climate research with interactive visual data exploration. IEEE Transactions on Visualization and Computer Graphics 14, 6 (2008), 1579–1586. 2 [KSDD14] KOTHUR P., S IPS M., D OBSLAW H., D RANSCH D.: Visual analytics for comparison of ocean model output with reference data: Detecting and analyzing geophysical processes using clustering ensembles. IEEE Transactions on Visualization and Computer Graphics 20, 12 (2014), 1893 – 1902. 2 [KZX∗ 14] KO S., Z HAO J., X IA J., A FZAL S., WANG X., A BRAM G., E LMQVIST N., K NE L., VAN R IPER D., G AITHER K., ET AL .: Vasa: Interactive computational steering of large asynchronous simulation pipelines for societal infrastructure. IEEE Transactions on Visualization and Computer Graphics 20, 12 (2014), 1853 – 1862. 2 [LSL∗ 10] L ADSTÄDTER F., S TEINER A. K., L ACKNER B. C., P IRSCHER B., K IRCHENGAST G., K EHRER J., H AUSER H., M UIGG P., D OLEISCH H.: Exploration of climate data using interactive visualization*. Journal of Atmospheric and Oceanic Technology 27, 4 (2010), 667–679. 2 [Luo14] L UO W.: Geovisual Analytics Approaches for the Integration of Geography and Social Network Contexts. PhD thesis, The Pennsylvania State University, 2014. 2 [MGJ∗ 10] M ATKOVIC K., G RACANIN D., J ELOVIC M., A M MER A., L EZ A., H AUSER H.: Interactive visual analysis of multiple simulation runs using the simulation model view: Understanding and tuning of an electronic unit injector. IEEE Transactions on Visualization and Computer Graphics 16, 6 (2010), 1449–1457. 2 [MLR∗ 11] M ACIEJEWSKI R., L IVENGOOD P., RUDOLPH S., C OLLINS T. F., E BERT D. S., B RIGANTIC R. T., C ORLEY c The Eurographics Association 2015.
C. D., M ULLER G. A., S ANDERS S. W.: A pandemic influenza modeling and visualization tool. Journal of Visual Languages & Computing 22, 4 (2011), 268–278. 2 [MMT∗ 14] M ALIK A., M ACIEJEWSKI R., T OWERS S., M C C ULLOUGH S., E BERT D.: Proactive spatiotemporal resource allocation and predictive visual analytics for community policing and law enforcement. IEEE Transactions on Visualization and Computer Graphics 20, 12 (2014), 1863 – 1872. 2 [NSBW08] N OCKE T., S TERZEL T., B ÖTTINGER M., W RO BEL M.: Visualization of climate and climate change data: An overview. Digital earth summit on geoinformatics (2008), 226– 232. 2 [PDW∗ 14] P OCO J., DASGUPTA A., W EI Y., H ARGROVE W., S CHWALM C. R., H UNTZINGER D. N., C OOK R., B ERTINI E., S ILVA C. T.: Visual reconciliation of alternative similarity spaces in climate modeling. IEEE Transactions on Visualization and Computer Graphics 20, 12 (2014), 1923 – 1932. 2 [PKSG12] PARISH E. S., KODRA E., S TEINHAEUSER K., G AN GULY A. R.: Estimating future global per capita water availability based on changes in climate and population. Computers & Geosciences 42 (2012), 79–86. 1 [PWB∗ 09] P OTTER K., W ILSON A., B REMER P.-T., W ILLIAMS D., D OUTRIAUX C., PASCUCCI V., J OHHSON C.: Visualization of uncertainty and ensemble data: Exploration of climate modeling and weather forecast data with integrated visus-cdat systems. In Journal of Physics: Conference Series (2009), vol. 180, IOP Publishing, p. 012089. 2 [RGK∗ 97] R ASKIN P., G LEICK P., K IRSHEN P., P ONTIUS G., S TRZEPEK K.: Water futures: assessment of long-range patterns and problems. comprehensive assessment of the freshwater resources of the world. 3 [RWF∗ 13] R IBICIC H., WASER J., F UCHS R., B LOSCHL G., G ROLLER E.: Visual analysis and steering of flooding simulations. IEEE Transactions on Visualization and Computer Graphics 19, 6 (2013), 1062–1075. 2 [SST∗ 12] S TEED C. A., S HIPMAN G., T HORNTON P., R ICCI UTO D., E RICKSON D., B RANSTETTER M.: Practical application of parallel coordinates for climate model analysis. Procedia Computer Science 9 (2012), 877–886. 2 [VGSL00] V ÖRÖSMARTY C. J., G REEN P., S ALISBURY J., L AMMERS R. B.: Global water resources: vulnerability from climate change and population growth. Science 289, 5477 (2000), 284–288. 1 [VMG∗ 10] V ÖRÖSMARTY C. J., M C I NTYRE P., G ESSNER M. O., D UDGEON D., P RUSEVICH A., G REEN P., G LIDDEN S., B UNN S. E., S ULLIVAN C. A., L IERMANN C. R., ET AL .: Global threats to human water security and river biodiversity. Nature 467, 7315 (2010), 555–561. 1 [WFR∗ 10] WASER J., F UCHS R., R IBICIC H., S CHINDLER B., B LÖSCHL G., G RÖLLER E.: World lines. IEEE Transactions on Visualization and Computer Graphics 16, 6 (2010), 1458–1467. 2