Web-Scale Knowledge Extraction from Semi-Structured Tables
Recommend Documents
Abstract. In this paper we present preliminary results for information extraction (IE) performed over a set of HTML documents using Hid- den Markov Models ...
containing an anchor text, and the ratio of cells containing a font change. Lexical ... name or model); b) within the document or the html tag; and c) anchor ...
covering knowledge management to content delivery to mobile devices. The main difference between tables in plain text and the web tables is that the visual.
Mahesh A. Sale, Pramila M. Chawan, Prithviraj M. Chauhan / International
Journal of. Engineering Research and Applications (IJERA) ISSN: 2248-9622 ...
Si-cong Yuan,Liu dao-hua,Huang Jun. Knowlege's acquisition method based on ... Yin Ji Long,Liu a Yong,Peng Ying hong. Fuzzy-rough Method of Knowledege ...
Artificial neural networks (ANN) are very efficient in solving various kinds of problems ... A network unit has a rule for summing the signals coming in and a rule ...
Jun 20, 2008 - Keywords: Information extraction, knowledge representation. 1. INTRODUCTION. Digital libraries naturally occupy a middle ground between.
source of information for use in natural language processing because they ..... following outlines the various sources of difficulty in extracting information from.
Knowledge Extraction from Artificial Neural Networks Models. Depar. Zvi Boger*. Intelligent Process Control Systems. P.O. Box 15053, Be'er-Sheva 84003, ...
incredible detailed business rules and form the ... allows an existing software component to be accessed ... from legacy system database management system.
Scalable Knowledge Extraction from Legacy Sources with SEEK. Joachim Hammer. â . , William O'Brien. â¡. , and Mark Schmalz. â . University of Florida.
scientific papers stored in PostScript files. Metadata are ... In our system, we first translate the input PostScript file to a set of strings of text ..... http://ai.iit.nrc.ca/. 2.
Knowledge Extraction from Diagram and Text for Media Integration. Yuichi NAKAMURA, Miwa TAKAHASHI, Masayuki ONDA, Yuichi OHTA. Institute of ...
handcrafted dictionary of patterns in the terrorist domain (Riloff 1996). Therefore, there ..... materials) and processing payment (booking & payment), if applicable.
as the domain theory, and translation of the ... chose a more realistic domain (the National Building ..... domain the top-level (most abstract) rule for claiming.
based search procedure for the inverse problem and found a variety of readily ... the KE engine, HTE data and the human expert are working in concert, the process .... from rules, the parameters of the model are optimized by comparing the ...
Metal, Stream SDK, and Brook-GP. In terms of peak ...... ITCH is implemented in Java. SL was ...... In social networks like Facebook, people contact each other at ...
the results of a one year analysis conducted in the Italian and Polish ... status, list of the defendants with their lawyers, names of judges involved, etc.), legal.
This paper presents our work in extracting disease- chemical relationship knowledge from the UMLS. Co-occurrence table (MRCOC) using an automated.
redundant inputs and hidden neurons, deriving of causal ... hidden neuron behavior in classification. ANN. Example of the ..... -abstracts/24.html). [15] Z. Boger ...
Sep 13, 2009 - the implementation of the software features in the source code. Finally, in a post- .... We call this set of scenarios as feature-specific scenario set. ...... Technical report, Software Engineering Research Center (SERC),. 2004.
the results of a one year analysis conducted in the Italian and Polish ... status, list of the defendants with their lawyers, names of judges involved, etc.), legal.
Chess players: We used a list of 20 top chess players and their accounts.3 ... 3https://www.reddit.com/r/chess/comments/32t5ov/list_of_top_chess_.
Web-Scale Knowledge Extraction from Semi-Structured Tables
ãYou Save, Angels & Demons, $13.96ã. In ATTRIBUTE/VALUE tables, normally one column is devoted to the attribute names (mapping to predicates p) and ...
WWW 2010 • Poster
April 26-30 • Raleigh • NC • USA
Web-Scale Knowledge Extraction from Semi-Structured Tables Eric Crestan
Patrick Pantel
Yahoo! Labs 701 First Avenue Sunnyvale, CA 94089, USA
Yahoo! Labs 701 First Avenue Sunnyvale, CA 94089, USA
[email protected] In ATTRIBUTE/VALUE tables, normally one column is devoted to the attribute names (mapping to predicates p) and another column to the values of the attributes (mapping to the objects o). The biggest challenge in extracting semantic triples from ATTRIBUTE/VALUE tables lies in the detection of the subject of the table. We call this open research problem Protagonist Detection1.
ABSTRACT A wealth of knowledge is encoded in the form of tables on the World Wide Web. We propose a classification algorithm and a rich feature set for automatically recognizing layout tables and attribute/value tables. We report the frequencies of these table types over a large analysis of the Web and propose open challenges for extracting from attribute/value tables semantic triples (knowledge). We then describe a solution to a key problem in extracting semantic triples: protagonist detection, i.e., finding the subject of the table that often is not present in the table itself. In 79% of our Web tables, our method finds the correct protagonist in its top three returned candidates.
We investigate a random sample of 5000 HTML tables over a large crawl of 1.2 billion high quality English pages on the Web. We further filter the tables according to the following criteria: a) minimum of 2 rows; b) minimum of 2 columns; and c) no cell with more than 100 characters in it. The result was 1.3 billion tables. For each table, we asked paid human editors to classify it as a Layout table (i.e., non-relational tables, such as formatting or navigational tables), as an ATTRIBUTE/VALUE table, or as OTHER.
Not surprisingly, the majority of tables are for layout purposes, a total of 58%. 16% were ATTRIBUTE/VALUE tables and the remaining 26% were classified as OTHER types of relational tables.
Keywords
2. TABLE CLASSIFICATION
General Terms
We adopt a Gradient Boosted Decision Tree classification model GBDT [4], which consists of an ensemble of decision trees for the classes ATTRIBUTE/VALUE, LAYOUT, and OTHER, fitted in a forward step-wise manner to current residuals. The model is trained on our 5000 manually annotated random sample of tables, using the features described below.
Information extraction, structured data, web tables, classification.
1. INTRODUCTION Mining the vast amount of knowledge present in tables on the Web has the potential to power many applications such as query expansion [3] and textual advertising [6]. Recent efforts have focused on teasing apart tables consisting of relational information from those used strictly for multi-column layouts and formatting [6], and other efforts on extracting schemas and knowledge in the form of relational tuples [1][2][5].
Each (non-global) feature was extracted per row and per column for the two first rows and columns, as well as the last row and column. Features are grouped into three distinct classes: Global Layout Features: Accounting for the structure of the table as a whole, they include the maximum number of rows for each column, the maximum number of columns for each row and the maximum cell content length in characters.
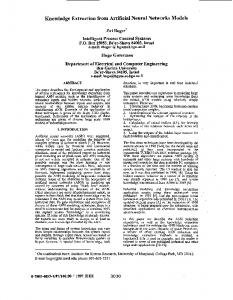
Relational tables considered in this paper encode facts, or semantic triples of the form 〈p, s, o〉, where p is a predicate or relation, s is the subject of the predicate and o is its object. These tables are rendered in many different ways, and of interest in this work are a specific table type called ATTRIBUTE/VALUE. These tables list one or more attributes but they rarely contain the subject in the table proper. ATTRIBUTE/VALUE tables are often used as factual sheets about an entity, such as for the specifications of a digital camera model. For example, Figure 1 illustrates an ATTRIBUTE/VALUE table consisting of the List Price and Price of a movie, where the table does not contain the actual movie name. From this example, we’d like to extract semantic triples such as:
Layout Features: Layout features are applied per column and per row. They are solely based on the size of the cells and their variance. They include features such as the average cell length, the variance in cell length, and the ratio of cells in a column or a row generated by a colspan attribute. Content Features: The following set of features focus on cell content. Two subdivisions can be distinguished based on whether the feature involves html tags or textual content. Html features include the ratio of distinct tags in the row/column, the ratio of cells containing table header
Copyright is held by the author/owner(s). WWW 2010, April 26–30, 2010, Raleigh, North Carolina, USA. ACM 978-1-60558-799-8/10/04.
1081
Beyond protagonist detection, a system must discover which columns and rows list attributes and objects, as well as normalize objects, find canonical forms for attributes and objects, and ultimately fuse triples across tables.
WWW 2010 • Poster
April 26-30 • Raleigh • NC • USA
Table 1. Classification performance of TabEx compared with various baselines. P = Precision; R = Recall; F = F-score. Layout P Global Features 0.558 Layout Features 0.738 Html Features 0.761 Lexical Features 0.766 TabEx 0.798
R 0.737 0.781 0.768 0.802 0.805
Attribute/Value F 0.648 0.759 0.764 0.784 0.801
P 0.390 0.643 0.618 0.777 0.767
R 0.267 0.661 0.704 0.721 0.764
F 0.329 0.652 0.661 0.749 0.766
Other P 0.309 0.523 0.580 0.614 0.664
R 0.217 0.451 0.480 0.553 0.598
F 0.263 0.487 0.530 0.584 0.631
containing an anchor text, and the ratio of cells containing a font change. Lexical features include the ratio of distinct strings in the row/column, the ratio of cells ending with the colon character, the ratio of cells where the content is a number, and the ratio of cells containing a digit.
Figure 1. Example webpage containing multiple table types.
2.1 Experimental Analysis 20-fold cross-validation over our 5000 randomly sampled tables is used in order to compare the performance of our classifier with several baseline versions of it using the different feature families described above. For each system, we report 3 measures: precision (P), recall (R) and F-measure (F). The results reported in Table 1 are an average over the 20 runs for each table type. The overall TABEX accuracy was 75.2%.
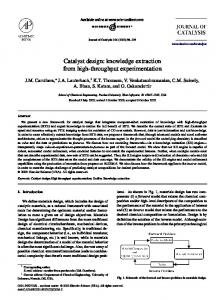
Quality of Protagonist Identification
Probablility of finding the protaagonist
1
From the results obtained using only the Global Features, the lack of modeling power is clearly exposed. Using only the Layout Features improves greatly over the simpler Global Features. ATTRIBUTE/VALUE tables benefit the most from Lexical Features. This observation follows the intuition that those tables contain knowledge offering in most of the cases certain regularity in its content. Finally, TABEX, our system using all the features performs the best overall in F-measure.
0.9 0.8 0.7 0.6 0.5 0.4 0.3 0.2
ProIde System Baseline
0.1 0 1
10
Top N suggestions
100
Figure 2. Probability of finding a correct protagonist vs. rank. candidate protagonists according to their anchor text frequencies. This baseline achieves a surprisingly high precision of 40%. Although our system performs statistically significantly better than the baseline (by more than 25%), ProIde concedes 35% errors when looking at only the top suggestion and 12% errors when considering the top-10.
3. PROTAGONIST DETECTION Extracting the predicate and object of semantic triples from 1 ATTRIBUTE/VALUE tables is generally straigthforward . Difficult however is recovering the often absent subject, which we call the task of protagonist detection. There are mainly three different places where the protagonist could be found: a) within the table (occasionally found in the table with a generic attribute such as name or model); b) within the document or the html tag; and c) anchor texts pointing to the page. While table cells and anchor texts offer well defined boundaries for identifying protagonist candidates, the document body proposes fewer clues. There is however a series of html fields that could help in defining entity boundaries such as the headers and the font tags.
Our approach must be improved, but it is a good starting point for reducing the set of candidates in a first pass (97% chance to find the correct protagonist in the top-100 ranked candidates). Then, more expensive approaches could be used in order to verify whether the triples hold in other contexts using other extractors.
4. REFRENCES [1] Cafarella, M.J.; Halevy, A.; Wang, D. Z.; Wu, E.; and Zhang, Y. 2008.. WebTables: Exploring the Powerpower of Tablestables on the Web. In Proceedings of VLDB-08. Auckland, New Zealand. pp. 538-549. [2] Chen, H.; Tsai, S.; and Tsai, J. 2000. Mining Tables from Large-Scale HTML Texts. In Proceedings of COLING-00. Saarbrücken, Germany.
Our corpus consists of 200 manually annotated tables. For each table, an editor identified the valid set of protagonists among the content of the document or the anchor text pointing to it. None of the cases presented to the editors lacked a protagonist, highlighting that most often ATTRIBUTE/VALUE tables do indeed contain relational knowledge.
[3] J. H.; Jiang, D.; Pei, J.; He, Q.; Liao, Z.; Chen, E.; and Li, H. 2008. Context-aware query suggestion by mining clickthrough and session data. In Proceedings of KDD-08. pp. 875– 883.
In order to identify all possible candidates, even if it is present in a paragraph of the document, we took an N-gram based approach. All possible 1 to 12-grams were extracted from the document and the anchor text (obtained from a commercial search engine’s web link graph). For each N-gram, its frequency combined with its position (e.g. anchor text, title, header, body, table, font…) was used as features for our GBDT regression model. For some tables, as many as 1700 candidates were extracted.
[4] Friedman, J.H. 2001. Greedy function approximation: A gradient boosting machine. Annals of Statistics, 29(5):1189– 1232. [5] Gatterbauer, W.; Bohunsky, P.; Herzog, M.; Krupl, B.; and Pollak, B. 2007. Towards Domain-Independent Information Extraction from Web Tables. In Proceedings WWW-07. pp. 71–80. Banff, Canada. [6] Wang, Y. and Hu, J. 2002. A Machine Learning Based Approach for Table Detection on the Web. In Proceedings of WWW-02. Honolulu, Hawaii.
We ran a 20-fold cross-validation experiment and present the results in Figure 2. Our system is labeled ProIde and it is compared against a simple baseline system that ranks the