IEEE TRANSACTIONS ON SIGNAL PROCESSING, VOL. 58, NO. 2, FEBRUARY 2010
1
Welch Method Revisited: Nonparametric Power Spectrum Estimation Via Circular Overlap Kurt Barbé, Rik Pintelon, and Johan Schoukens
Index Terms—Nonparametric, overlap, power spectrum, system identification, variance reduction, Welch’s method, windowing, WOSA method.
I. INTRODUCTION
N important application area of digital signal processing (DSP) is the power spectral estimation of periodic and random signals. Speech recognition problems use spectrum analysis as a preliminary measurement to perform speech bandwidth reduction and further acoustic processing. Sonar systems use sophisticated spectrum analysis to locate submarines and surface vessels. Spectral measurements in radars are used to obtain target location and velocity information [1]. The vast variety of measurements that spectrum analysis encompasses is perhaps limitless, and thus, the subject received a lot of attention over the last five decades [2]. Another important area of application is system identification. Frequency-domain system identification offers a
A
tool to identify the transfer function of a linear dynamic time-invariant system measured at angular frequencies , where . The user wants to identify the transfer function on a frequency band of interest such that a high-frequency resolution is desired. A high-frequency resolution implies long and costly experiments. When the noise characteristics are unknown, these are to be estimated from the input/output data. One can use nonparametric noise models to obtain this information, [3], which is closely related to nonparametric power spectrum estimation (PSE). There are mainly two classes of power spectrum estimators: the parametric and the nonparametric estimators. The class of parametric PSE [4], [5] tries to fit a parametric model (AR, ARMA, MA, etc.) to the signal by minimizing a given cost function; for example: Burg’s entropy method [6] and the Yule–Walker method [7]. In contrast to parametric methods, nonparametric methods do not make any assumptions on the data-generating process or model (e.g., autoregressive model, presence of a periodic component). There are five common nonparametric PSE available in the literature: the periodogram [8], the modified periodogram [2], Bartlett’s method [9], Blackman–Tukey [7], and Welch’s method [10]. However, all these nonparametric PSEs are modifications of the classical periodogram method introduced by Schuster [8]. The periodogram is defined as [2]
IE E Pr E oo f
Abstract—The objective of this paper is twofold. The first part provides further insight in the statistical properties of the Welch power spectrum estimator. A major drawback of the Welch method reported in the literature is that the variance is not a monotonic decreasing function of the fraction of overlap. Selecting the optimal fraction of overlap, which minimizes the variance, is in general difficult since it depends on the window used. We show that the explanation for the nonmonotonic behavior of the variance, as reported in the literature, does not hold. In the second part, this extra insight allows one to eliminate the nonmonotonic behavior of the variance for the Welch power spectrum estimator (PSE) by introducing a small modification to the Welch method. The main contributions of this paper are providing extra insight in the statistical properties of the Welch PSE; modifying the Welch PSE to circular overlap—the variance is a monotonically decreasing function of the fraction of overlap, making the method more user friendly; and an extra reduction of variance with respect to the Welch PSE without introducing systematic errors—this reduction in variance is significant for a small number of data records only.
Manuscript received November 27, 2008; revised August 14, 2009. . The associate editor coordinating the review of this manuscript and approving it for publication was Dr. Tryphon T. Georgiou. This work was supported by the Flemish Government under Methusalem Grant METH-1, the Belgian State, Prime Minister’s Office, Science Policy programming under the Belgian Program on Interuniversity Poles IUAP VI/4–DYSCO, and the Research Council of Vrije Universiteit Brussel (OZR). The authors are with Vrije Universiteit Brussel, 1050 Brussels, Belgium (e-mail:
[email protected];
[email protected];
[email protected];
[email protected]). Digital Object Identifier 10.1109/TSP.2009.2031724
It is well known that the periodogram is asymptotically unbiased but inconsistent because the variance does not tend to zero for large record lengths. One can show [2], [11] that the of an ergodic weakly stavariance on the periodogram for is asymptotitionary signal [12], , the square of the true power at frecally proportional to quency bin . The periodogram uses a rectangular time-window, a weighting function to restrict the infinite time signal to a finite time horizon, [13]. The modified periodogram uses a nonrectangular time window [14]. A way to enforce a decrease of the variance is averaging. into Bartlett’s method [9] divides the signal of length segments of length each. The periodogram method segments. The average of the is then applied to each of the resulting estimated power spectra is taken as the estimated power spectrum. One can show that the variance is reduced by a factor , but the spectral resolution is also decreased by a factor , [2]. The Welch method [10] eliminates the tradeoff between spectral resolution and variance in the Bartlett method by allowing the segments to overlap; see Fig. 1. Furthermore,
1053-587X/$26.00 © 2009 IEEE
2
IEEE TRANSACTIONS ON SIGNAL PROCESSING, VOL. 58, NO. 2, FEBRUARY 2010
Fig. 3.
Fig. 1. Regular overlap for
K = 2 and fraction of overlap r = 2=3.
Fig. 2. Circular overlap for
K = 2 and fraction of overlap r = 2=3.
However, it is clear by using circular overlap that the concatenation of the end of the record with the beginning of the record creates a discontinuity in the signal. We need to examine the influence of this discontinuity on the statistical properties of the PSE with circular overlap. It is shown that no extra systematic errors are introduced by the discontinuity, implying that the PSE with circular overlap is asymptotically unbiased. However, the convergence rate is slightly slower. Furthermore, we show that the bias is of the same order of magnitude as the bias of Welch’s method. The user can gain these properties for free, as the algorithm for computing the PSE via circular overlap is essentially the same as computing the Welch PSE, taking into account some minor modifications. In summary, the main contributions of this paper are: • providing further insight in the statistical properties of the Welch PSE; • improving the Welch PSE, which implies a decrease in un; certainty up to a factor • guaranteeing a monotonic decrease in variance of the PSE via circular overlap as a function of the fraction of overlap .
IE E Pr E oo f
the time window can also vary. Essentially, the modified periodogram method is applied to each of the overlapping segments and averaged out. Like in system identification, if a high-frequency resolution is desired, one can only split the record in a small number of segments of length . In system identification, the number of is typically 2,3, 6; see [15] and [16]. Unfortusegments nately, a small number of segments implies a higher variance of the estimated power spectrum. Therefore, it is worth looking into methods using overlapping subrecords for reducing the variance as the main processing algorithm remains unchanged. For more than three decades, many successful applications of the Welch PSE have been reported throughout the literature. However, there are still some open questions regarding the underlying theory of the Welch method. Indeed, only a handful of papers extend beyond the analysis of Welch [10]. In [10], the mean of the Welch PSE and the variance for a fraction of and were studied. In [13], the variance of overlap . the Welch PSE was discussed for a fraction of overlap In [17], the probability density function of the Welch PSE was investigated. A couple of papers [18], [19] reported a drawback connected to the Welch PSE: the variance is a nonmonotonically decreasing function of the fraction of overlap. The variance starts to grow when the fraction of overlap becomes too large. This makes the method difficult to apply, as it is not clear which fraction of overlap to use since the optimum also depends on the type of the window used. It is explained intuitively [18], [19] that this is a result of the competing effects of more segments (lowering the variance) and more overlap among segments (increasing the variance). In this paper, we show that this intuitive explanation does not hold. In particular, we illustrate that by using circular overlap (Fig. 2), the variance of the PSE is monotonically decreasing as the fraction of overlap increases. We explain that Welch’s method suffers from the nonmonotonicity due to the unequal weighting of the measured samples, increasing the uncertainty of the PSE considerably. Furthermore, we show that the variance of the PSE can be , with the fraction of overlap reduced up to a factor and the number of independent segments, with respect to the variance of the Welch PSE.
K = 2 independent segments of the data record.
1isiknowledge.com.
II. ASSUMPTIONS AND NOTATIONS
We assume that the signal with is a weakly stationary Gaussian process. The signal is disegments, as in Fig. 3, such that every segment vided into . Further, we extract different overlapping has length subrecords by following the scheme of Fig. 2. The th overlapsatisfies ping subrecord of the signal (1)
with , and denotes modulo imposing circular overlap. We need to impose that circular overlap implies an integer number of overlapping subrecords; further, the different subrecords need to overlap an integer number of time samples. One can show that these two properties are, respectively, satisfied if the following two conditions hold simultaneously: for for
(2)
The first expression in (2) implies that the number of subrecords extracted via circular overlap is an integer. The last expression implies that only an integer number of points are overlapped. In the beginning of the section, we assumed the signal to be weakly stationary. Next, we apply Wold’s decomposition theorem [12], which states that a weakly stationary Gaussian signal can be interpreted as filtered white Gaussian noise, where the filter has a square summable impulse response, but not necessarily stable in the bounded-input bounded-output
BARBÉ et al.: WELCH METHOD REVISITED: NONPARAMETRIC POWER SPECTRUM ESTIMATION VIA CIRCULAR OVERLAP
3
III. DIRECT GENERALIZATION OF THE PERIODOGRAM TO CIRCULAR OVERLAP In this section, we propose a direct generalization of the periodogram method and Welch method to circular overlapping subrecords and make a detailed analysis of both methods. For every subrecord as in Fig. 2, the estimated power for subis defined as record of the signal
Fig. 4. The Wold decomposition of a weakly stationary signal.
(5) By averaging over the different overlapping subrecords in (5), an estimate of the power spectrum of the signal is defined as (6) Before studying the bias and the variance of the estimator (6), we prove the following property. Theorem 1: Under the conditions of Assumptions 1 and 2, the equation shown at the bottom of the page holds asymptotically . Further, denotes the DFT of the filter , as explained in Section II and
IE E Pr E oo f
sense, which requires an absolutely summable impulse response; see Fig. 4. In the sequel of this paper, we shall assume the following. with is a Assumption 1: The signal weakly stationary Gaussian process, such that , where is zero-mean white Gaussian noise with unit denotes the impulse response of the corvariance and responding filter. We assume that the sequence satisfies . is Assumption 1 implies that the filter characteristic continuously differentiable. This condition can be relaxed to continuously filter characteristics, while the conclusions of this paper remain valid, except the convergence rate of the bias, to ; see [11] for more dewhich drops from tails. The main objective is to estimate the power spectrum of the . The true power spectrum at frequency of signal is defined as [2] a weakly stationary signal
(3)
denotes the expectation and the last equality is a diwhere rect consequence of Wold’s decomposition [12]. is assumed to be zero Assumption 2: The time window for . The windowing function is either a rectanor nonnegative, unimodal, gular window , such that . and symmetrical at Due to the fact that the time window is unimodal, Assumption 2 implies that the Riemann integral of the window function exists [20]. Furthermore, it is important to note that Assumption 2 captures all windows analyzed in [13]. We define the windowed discrete Fourier transform (DFT) of at frequency bin as the th subrecord (4)
with . The proof can be found in Appendix A. Remark 1: • In Theorem 1, the first convergence rate holds for the noncircular segments and the second convergence rate holds for the circular segments. is a windowing • Note that since the function function, and if , the function for . Furthermore, under Assumption 1, the filter characis continuously differentiable. Hence, teristic one can show, by applying [21, Theorem 3.15], that . Theorem 1 further implies the following. equal Corollary 1: The first two moments of
with . We corrected the phase, for the delay , to refer all subrecords to the same time origin.
for elsewhere
4
IEEE TRANSACTIONS ON SIGNAL PROCESSING, VOL. 58, NO. 2, FEBRUARY 2010
1) The Bias Contribution: In the case of circular overlap, and the bias contribution (7) is dominated by , which is not the magnitude of the DFT of the whole windowing function, where for the Welch PSE the bias contri. This observation indicates that bution is dominated by an extra leakage contribution is introduced by the circular segments. Therefore, by breaking the window, the good properties of the windowing function are ruined in the circular segments. 2) The Variance Contribution: Next, we study the variance contribution in the MSE of (6). Expression (8) reveals that the variance can be approximated by
with
The proof can be found in Appendix B. We can analyze the bias and the variance of the PSE (6). The expected value of the PSE (6) is given by
By taking circular overlap (2) into account, it can easily be seen that
IE E Pr E oo f
(9)
where correlation . Welch [10] showed that the variance of the Welch PSE equals
where the last equality comes from the fact that, for every
(10)
This indicates that the bias is given by Bias
(7)
and the variance is given by
(8)
where the last approximate equality holds asymptotically by application of Corollary 1. Since nonparametric PSEs are inconsistent, the variance does not vanish asymptotically but is dominated by (8). A. Collating the MSE of the PSE (5) With the MSE of the Welch Method
To study the differences between the MSE of (6) and the Welch method, we discuss first the bias contribution and secondly the variance contribution separately.
the number of overlapping with subrecords for regular overlap. Note that the expression for the variance of the Welch PSE uses an unequal weighting for the correlation between two overlapping subrecords. Circular overlap weights the correlation between two overlapping subrecords equally. Although the correlation between two overlapping subrecords does not depend on the method of overlap (circular overlap or regular overlap), the nonmonotonicity of the variance reported in [18] and [19] is not observed for circular overlap. Although we are not able to formally prove this claim, we can analytically show that the variance is a monotonically decreasing function of the fraction of overlap when a rectangular , the window is used. For a rectangular window and variance (9) equals (11)
The computation of (11) is found in Appendix C. Hence, the variance of the PSE via circular overlap is a . Extensive simulations, parabola with minimum for without a formal proof, revealed that for the windows described by Assumption 2, the following conjectured claim holds if the is -times continuously differentiable: window function (12)
BARBÉ et al.: WELCH METHOD REVISITED: NONPARAMETRIC POWER SPECTRUM ESTIMATION VIA CIRCULAR OVERLAP
5
with the lower bound for tending to one. Next, we compare the variance expression (9) for circular overlap with (10), the Welch method, as follows:
Since the correlation holds:
is positive, the following inequality
(13)
B. Numerical Example
IE E Pr E oo f
An important consequence of (13) is that the varican be reduced as low as ance . Hence, circular overlap . can reduce the variance of the Welch PSE up to factor 1 It is known that the variance of the Welch PSE is not monotonically decreasing as a function of overlap [18], [19]. A priori comparing (9) and (10) suggests that the reason the PSE via circular overlap outperforms the Welch PSE is due to the fact that more segments are averaged out. However, the fact that the variance of the Welch PSE is not monotonically decreasing implies that increasing the fraction of overlap will not provide a reduction in variance. Next, we illustrate these results with a numerical example. In Section IV, we address the question of whether it is possible to eliminate this bias–variance tradeoff.
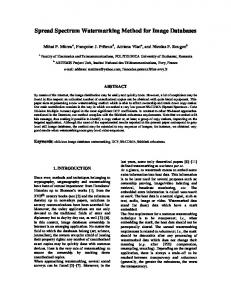
In this section, we illustrate the method of circular overlap as described in the last section. In particular, we shall illustrate the variance reduction (13) and the MSE. In a second example, we illustrate that the variance of the PSE via circular overlap is monotonically decreasing where the Welch PSE suffers from nonmonotonicity as reported in [19] and [18]. 1) Example: Keeping in mind the requirement of a maximal frequency resolution (e.g., system identification), we illustrate the method for (two data records only). We used a type 1 digital Chebychev filter of order two, a stopband ripple of 20 . A zero-mean white dB, and a cutoff frequency at points Gaussian noise sequence with unit variance of was generated. The sequence was partitioned in two records of points, and a Hanning window was applied. The light gray curve in the first plot shows one realization of the PSE via circular overlap, and the dark gray curve shows one realization of the PSE of Welch. The second plot shows the corresponding root mean squared error (RMSE) of the PSE via circular overlap and the PSE of Welch, respectively, both estimated on 10 000 Monte Carlo simulations. The third and fourth plots zoom in at the resonance. In Fig. 5, we see that we gain approximately 2
Fig. 5. PSE via circular overlap (r = 0:8) for a type–1 digital Chebychev filter of order two. The first plot shows the estimated power spectrum; the second plot shows the root mean squared error of the estimated PSE of the first plot. The third and fourth plots show a zoom-in at the resonance of the first and second plots, respectively. The dashed curve is the true power spectrum, the light gray curve is the PSE via circular overlap, and the dark gray curve is the Welch PSE.
dB in RMSE in the passband of the estimator, which is in agreeof (13). However, for the higher ment with a factor frequencies, it is clear that the PSE with circular overlap has difficulties following the slope towards infinity, where the Welch PSE does not suffer from this effect. Due to the fact that the variance of the PSE is proportional to the true power, the MSE for the higher frequencies is dominated by the bias contribution. We conclude that the variance of the PSE via circular overlap is reduced, but at the expense of an increase in bias. By introducing a small modification for the PSE via circular overlap, we show in Section IV that this extra bias can be suppressed. 2) Example: In this example, we use the same setup as in the previous example. We used a type–1 digital Chebychev filter of order two, a stopband ripple of 20 dB, and a cutoff frequency . A zero-mean white Gaussian noise sequence with at 0.15 points was generated via Matlab. unit variance of records of The sequence was partitioned in points, and a Hanning window was applied. We compute the variances of the PSE via circular overlap and the PSE of Welch as a function of the fraction of overlap. In particular, we choose all fractions of overlap between zero and 9 such that, for the Welch PSE, the number of segments is
6
IEEE TRANSACTIONS ON SIGNAL PROCESSING, VOL. 58, NO. 2, FEBRUARY 2010
overlap and the number of overlapping subrecords. It is important to stress that Fig. 6 illustrates the conjectured claim (12) as variance for the PSE with circular overlap decreases monotonically to a lower bound for tending to one. Note that the “x”-markers coincide with the theoretic curves within the accuracy of the Monte Carlo simulation ( with 95% confidence). Furthermore, this example shows that the common explanation for the nondecreasing behavior of the variance of the Welch PSE—that a tradeoff needs to be made between increasing the fraction of overlap (more correlation between two overlapping subrecords) and more subrecords to average—does not hold. The correlation, in the first plot of Fig. 6, between two subrecords is the same for both the Welch PSE and the PSE via circular overlap. However, the variance of the PSE via circular overlap is monotonically decreasing. In the next section, we discuss a way to obtain the reduction in variance without increasing the bias.
IE E Pr E oo f
IV. IMPROVED POWER SPECTRUM ESTIMATION VIA CIRCULAR OVERLAP
Fig. 6. The black curve indicates the theoretical normalized variance of the Welch PSE, and the gray curve indicates the theoretical variance of the PSE via circular overlap as a function of the fraction r in the top plot and as a function of the number of overlapping subrecords in the bottom plot. The “x”-markers are the simulated normalized variance at the resonance frequency on 6000 Monte Carlo simulations of the PSE of a type–1 digital Chebychev filter of order two.
In Section III, it was shown that the bias of the PSE via circular overlap is a function of and . We observed that the good properties of the windowing function were ruined by using circular overlap since, for instance, is a function of , which is not the magnitude of the DFT of the whole windowing function. This led to significant bias for the frequency lines , as illustrated in example where the true power B.1. The following modification solves this problem without losing the variance reduction. We introduce the following notation, which is needed in the be the windowing function used; then modification. Let we define for
an integer . For the PSE via circular overlap, we choose all the possible fractions satisfying (2). This is illustrated in the top plot of Fig. 6. Secondly, the top plot of Fig. 6 was redrawn, such that the -axis is a function of the number of overlapping segments. If the Welch PSE was computed for the fractions , we plotted the variance of the Welch PSE as a function of and similarly for the PSE via circular overlap. This is illustrated in the bottom plot of Fig. 6. In both figures, we normalized the computed variances by dividing these by the true power. It is clear that in both plots of Fig. 6, the variance of the Welch PSE (indicated in black) is not a decreasing function of both the fraction of overlap and the number of overlapping subrecords. The variance of the Welch PSE has a minimum that depends on the window used. In general, the question arises of which fraction of overlap to use in order to minimize the variance. In the case of the PSE via circular overlap, the variance (indicated by the gray curve) does not suffer from this effect. The variance is a monotonically decreasing function of both the fraction of
for
For the noncircular subrecords , no modification of the periodogram is needed. For the circular sub, we define records
(14)
where is defined as in (4), where the window with is used. The only difference between (5) and (14) is the use of the window for the circular segments, as illustrated in Fig. 7. The improved PSE via circular overlap becomes
(15)
BARBÉ et al.: WELCH METHOD REVISITED: NONPARAMETRIC POWER SPECTRUM ESTIMATION VIA CIRCULAR OVERLAP
Fig. 7. Illustration of the applied windows for each subrecord for .
r = 2=3
K = 2 and
A. Properties of (15) Following the scheme of Fig. 7, it is clear that the window applied to the circular segments will not lose its good properties. Applying Theorem 1 and repeating the same discussion as in Section III, the bias and the variance of (15) can be approximated by
(16) (17)
where
Fortunately,
due
to
as the bias of the Welch PSE and that the variance reduction (18) is approximately achieved. In the second example, we show that the variance of the modified PSE via circular overlap remains a monotonically decreasing function of both the fraction of overlap and the number of overlapping subrecords. 1) Example: In the first example, we show that the modification works where a Hanning window was applied. In particular, we show on the same simulation example as in Section III-B that the approximately the same RMSE reduction is achieved and this without paying the price in bias. The light gray curve in the first plot shows one realization of the PSE via circular overlap, and the dark gray curve shows one realization of the PSE of Welch. The second plot shows the corresponding RMSE of the PSE via circular overlap and the PSE of Welch, respectively, both estimated on 10 000 Monte Carlo simulations. The third and fourth plots zoom in on the resonance frequency. In Fig. 5, we see that we gain approximately 2 dB in RMSE in the passband of the estimator, which is in agreement with the factor of (18). Fortunately, we observe that the bias of the Modified PSE via circular overlap is of the same magnitude as the bias of the Welch PSE, as indicated by the previous discussion. In the next example, we shall look into the approximating expression for the variance (18). 2) Example: In this example, we use the same setup as in the example as in Section III-B2. A zero-mean white Gaussian noise points was generated sequence with unit variance of via Matlab. The sequence was partitioned in four records of points, and a Hanning window was applied. In this example, we want to illustrate that the approximate expression for the variance (18) holds. We compute the variances of the modified PSE via circular overlap and the PSE of Welch as a function of the fraction of overlap. In particular, we choose all fractions of overlap between zero and 9 such that, for the Welch PSE, the number of segments is an integer . For the modified PSE via circular overlap, we choose all the possible fractions satisfying (2). This is illustrated in the top plot of Fig. 9. Secondly, the top plot of Fig. 9 was redrawn, such that the -axis is a function of the number of overlapping segments. If the Welch PSE was computed for the fractions , we plotted the variance of the Welch PSE as a function of and similarly for the modified PSE via circular overlap. This is illustrated in the bottom plot of Fig. 9. In both figures, we normalized the computed variances by dividing these by the true power. We see from both plots in Fig. 9 that the simulated variance computed from 1000 Monte Carlo simulations (indicated with the cross-markers) follows the theoretical curves (indicated by the solid lines) within the uncertainty of the simulation ( with 95% confidence). This illustrates the claim that the variance of the modified PSE via circular overlap follows approximately (18). Therefore, we conclude that we approximately can achieve a reduction in variance up to a factor , and this without increasing the bias.
IE E Pr E oo f
Bias
the
fact
that, for instance, is the magnitude of the DFT of the whole window function, the good properties of the windowing function remain valid. in (17), it was not For the variance analysis of possible to find an analytical expression. However, extensive simulations showed that the following inequality holds asymptotically: (18)
This is what we expect due to the fact that we actually only changed the resolution of the window in the scheme in Fig. 7 but not the type of window. (15) has In conclusion, the improved estimator (6). approximately the same variance as the estimator is significantly However, the bias of the estimator reduced with respect to the bias of . This is mainly due to fact that the good properties of windowing for leakage , whereas this is not the case for reduction are ruined in . the estimator B. Numerical Example In this section, we illustrate the modified PSE via circular overlap by repeating example III.B. In particular, we illustrate that the bias due to the modification is of the same magnitude
7
IEEE TRANSACTIONS ON SIGNAL PROCESSING, VOL. 58, NO. 2, FEBRUARY 2010
IE E Pr E oo f
8
Fig. 8. PSE via circular overlap (r = 0:8) for a type–1 digital Chebychev filter of order two. The first plot shows the estimated power spectrum; the second plot shows the root mean squared error of the estimated PSE of the first plot. The third and fourth plots show a zoom-in at the resonance of the first and second plots, respectively. The dashed curve is the true power spectrum, the light gray curve is the PSE via circular overlap, and the dark gray curve is the Welch PSE.
V. CONCLUSION
The main goal of this paper was to investigate some aspects of the Welch PSE in more detail. In particular, we tried to find a theoretical explanation of the drawback (the nonmonotonicity of the variance of the Welch PSE) reported in the literature. Our analysis revealed the following. • Circular overlap revealed that the nonmonotonicity of the variance of the Welch PSE is not due to the following tradeoff: increasing the fraction of overlap results in more subrecords to average but increases the correlation between two subrecords. • The nonmonotonicity of the variance of the Welch PSE is due to the unequal weighting of the data, which implies that the covariance between two overlapping subrecords is weighted with a triangular window. • The variance of the improved PSE via circular overlap (15) is monotonically decreasing without introducing extra systematic errors. • The improved PSE via circular overlap is user-friendly since choosing an optimal percentage of overlap is no
Fig. 9. The black curve indicates the theoretical normalized variance of the Welch PSE, and the gray curve indicates the theoretical variance of the PSE via circular overlap as a function of the fraction r in the top plot and as a function of the number of overlapping subrecords in the bottom plot. The cross-markers are the simulated normalized variance at the resonance frequency on 1000 Monte Carlo simulations of the PSE of a type 1 digital Chebychev filter of order 2.
longer an issue for the improved PSE via circular overlap. As a rule of thumb, we propose a fraction of overlap of . • The PSE via circular overlap provides the user with a reduction of the variance with respect to the variance of the . However, this reducWelch PSE up to a factor tion in variance is significant for small values of only. The improved PSE via circular overlap is a small modification of the Welch PSE but has some better properties than the classical Welch PSE; however, theoretically, the bias vanishes slightly slower than the bias for the Welch PSE. The user can receive these extra properties for free as the main processing algorithm remains unchanged. APPENDIX Throughout the Appendix, we shall use the notation instead of for simplicity if there is no confusion possible.
A. Proof of Theorem 1 We shall only prove Theorem 1 for the subrecords (see Fig. 10), but the proof for the other
BARBÉ et al.: WELCH METHOD REVISITED: NONPARAMETRIC POWER SPECTRUM ESTIMATION VIA CIRCULAR OVERLAP
(19)
Fig. 10. The subrecord used in the proof is denoted by the dashed line.
subrecords is similar. Before proving the main result, we formulate two lemmas. Lemma 1: Under Assumption 1, the following holds for and and any arbitrary :
9
Further, using (1), we compute the different terms in the expected value (19). Separately, for (i)
IE E Pr E oo f
Proof: The proof follows immediately from the fact that , implying that . We give the proof for claim i), but the proof for claim ii) is completely as a time sample in similar. We denote the beginning of the record and at the end of the measured record. As indicated by Fig. 10, are separated by at least time samples. the points We compute
where denotes the real part of . Applying Lemma 1, the last term becomes . Furthermore, if we denote , then we find after renum, where bering the first sum with , and the second sum with
Using the fact that implies that
and
Since , the proof is complete. Lemma 2: Under Assumptions 1 and 2, the following holds : asymptotically
Proof: We compute where we used the Wiener–Khintchine theorem [2] to obtain the second equality. In a completely similar way, we obtain for the other terms in the expected value (19)
10
IEEE TRANSACTIONS ON SIGNAL PROCESSING, VOL. 58, NO. 2, FEBRUARY 2010
(22) where in (20) and (21), we used the fact that the Fourier coefficients are circular complex Gaussian distributed. See [22], which implies that the second term in (21) equals zero; and we used Lemma 2 for (22). B. Proof of Corollary 1 We start with a small technical lemma, which indicates that the sum of the squares of the windowing function is proportional to the number of data points. Lemma 3: Under Assumption 2, the following holds for large record lengths and a nonzero constant The third term becomes (iii)
IE E Pr E oo f
Proof: Under Assumption 2 the window function is is uniformly Riemann-integrable [20]. Due to the fact that bounded by the constant one, it is easy to see that the window is quadratic integrable. It follows that function
Let and choose the following holds:
The fourth term becomes (iv)
such that, for
,
which completes the proof. Now, we are able to prove claim (i) of Corollary 1. For the first . We compute claim, it is sufficient to study
Combining results i)–iv) completes the proof. Next, we compute
with . This follows immediately from results (i) and (iv) in the proof of Lemma 2. Using the triangular inequality together with Lemma 3 results in (20) (21)
BARBÉ et al.: WELCH METHOD REVISITED: NONPARAMETRIC POWER SPECTRUM ESTIMATION VIA CIRCULAR OVERLAP
11
where the last equality follows from the following rule [22, p. complex circular Gaussian random variables, 123]: for the following rule applies:
To complete the proof, we apply the previously shown claim (i) for the first term in (23) such that
For the second term in (23), we apply Lemma 4 with and , and where . This immediately proves the result since Theorem 1 together with Remark 1 implies that for large enough. C. Proof of (11)
IE E Pr E oo f
which completes the proof of the first claim. To show the second claim, it is sufficient to study . The proof of the second claim of Corollary 1 is based on a very important corollary of mean square convergence. The corollary is found in [23, p. 41]. However, we shall slightly generalize the result. Lemma 4: Let four sequences of (complex) are equivalent in mean random variables, such that if ) and are square ( equivalent in mean square. Then the following holds: if the second-order moments of the random variables are uniformly bounded, then
Remark 2: In [23], the result is formulated for and for every . However, this makes no difference for the proof. Proof: It is easy to verify that . Using the triangular inequality in combination with the Cauchy–Schwartz (or Hölder’s) inequality, we compute
This completes the proof of this lemma since are assumed uniformly bounded. To prove claim (ii) of Corollary 1, we compute
(23)
In this section, we shall prove that the variance expression (9) for a rectangular window equals
First, we study in more detai,l where we used the following fact [3] for Gaussian processes :
12
IEEE TRANSACTIONS ON SIGNAL PROCESSING, VOL. 58, NO. 2, FEBRUARY 2010
(24) Now, we use the fact that the windowing function such that we obtain
and which completes the proof.
REFERENCES
IE E Pr E oo f
[1] G. M. Jenkins and D. G. Watts, Spectral Analysis and Its Applications. San Francisco, CA: Holden-Day, 1968. [2] J. G. Proakis and D. G. Manolakis, Digital Signal Processing: Principles, Algorithms, and Applications, 3rd ed. Upper Saddle River, N.J.: Prentice-Hall, 1996. [3] R. Pintelon and J. Schoukens, System Identification: A Frequency Domain Approach. New York: IEEE, 2001. [4] P. Broersen, Automatic Autocorrelation and Spectral Analysis. Berlin, Germany: Springer, 2006. [5] G. Box and G. Jenkins, Time Series Analysis: Forecasting and Control. San Francisco, CA: Holden-Day, 1970. [6] J. P. Burg, “The relationship between maximum entropy spectra and maximum likelihood spectra,” Geophysics, vol. 37, pp. 375–376, Apr. 1972. [7] P. Stoica and R. Moses, Introduction to Spectral Analysis. Upper Saddle River, NJ: Prentice-Hall, 1997. [8] A. Schuster, “On the investigation of hidden periodicities,” Terrestr. Magn., vol. 3, pp. 13–41, 1898. [9] M. S. Bartlett, “Smoothing periodograms from time series with continuous spectra,” Nature, vol. 161, pp. 686–687, 1948. [10] P. Welch, “The use of fast fourier transform for the estimation of power spectra: A method based on time averaging over short, modified periodograms,” IEEE Trans. Audio Electroacoust., vol. AE-15, pp. 70–73, Jun. 1967. [11] D. Brillinger, Time Series: Data Analysis and Theory. London, U.K.: Holt, Rinehart and Winston, 1975. [12] B. Porat, Digital Processing of Random Signals: Theory and Methods. Upper Saddle River, NJ: Prentice-Hall, 1994. [13] F. J. Harris, “On the use of windows for harmonic analysis with the discrete fourier transform,” Proc. IEEE, vol. 66, no. 1, pp. 51–83, 1978. [14] D. J. Thompson, “Spectrum estimation and harmonic analysis,” Proc. IEEE, vol. 70, no. 9, pp. 1055–1096, 1982. [15] J. Schoukens, R. Pintelon, G. Vandersteen, and P. Guillaume, “Frequency-domain system identification using nonparametric noise models estimated from a small number of data sets,” Automatica, vol. 33, no. 6, pp. 1073–1086, 1997. [16] K. Barbé, J. Schoukens, and R. Pintelon, “Frequency domain errors-invariables estimation of linear dynamic systems using data from overlapping sub-records,” IEEE Trans. Instrum. Meas., vol. 57, no. 8, pp. 1529–1536, 2008. [17] P. Johnson and D. Long, “The probability density of spectral estimates based on modified periodogram averages,” IEEE Trans. Signal Process. , pp. 1255–1261, 1999. [18] T. P. Bronez, “On the performance advantage of multitaper spectral analysis,” IEEE Trans. Signal Process., vol. 40, no. 12, pp. 2941–2946, 1992. [19] H. Jokinen, J. Ollila, and O. Aumala, “On windowing effects in estimating averaged periodograms of noisy signals,” Measurement, vol. 28, no. 3, pp. 197–207, 2000. [20] G. E. Shilov and B. L. Gurevich, Integral, Measure and Derivative: A Unified Approach. Englewood Cliffs: Prentice-Hall, 1966. [21] A. Zygmund, Trigonometric Series. Cambridge, U.K.: Univ. Press, 1968–1979. [22] B. Pincinbono, Random Signals and Systems. Englewood Cliffs, NJ: Prentice-Hall, 1993. [23] E. Lukacs, Stochastic Convergence. London, U.K.: Academic, 1975. [24] R. Grimaldi, Discrete and Combinatorial Mathematics. Reading, MA: Addison-Wesley, 1999.
(25)
where the last equality (25) holds asymptotically since for , [11]. Hence, we can compute the variance explicitly
(26)
where we used (25) to obtain (26). Next, we use following computation rules [24]:
Finally, we obtain
BARBÉ et al.: WELCH METHOD REVISITED: NONPARAMETRIC POWER SPECTRUM ESTIMATION VIA CIRCULAR OVERLAP
Kurt Barbé received the degree in mathematics (option statistics) from the Vrije Universiteit Brussel (VUB), Brussels, Belgium, in 2005. He is currently a Ph.D. Researcher with the ELEC Department, VUB. His main interests are in the field of system identification, time series analysis, and statistics.
13
Johan Schoukens received the engineer degree and the doctoral degree in applied sciences from Vrije Universiteit Brussel (VUB), Brussels, Belgium, in 1980 and 1985, respectively. He is presently a Professor at VUB. The prime factors of his research are in the field of system identification for linear and nonlinear systems.
IE E Pr E oo f
Rik Pintelon received the engineer degree and the doctoral degree in applied science from Vrije Universiteit Brussel (VUB), Brussels, Belgium, in 1982 and 1988, respectively. He is presently a Professor in the ELEC Department, VUB. His main research interests are in the field of parameter estimation/system identification and signal processing.