Page 1 ..... all the printed contents, plus supplemental online material, are available .... and tireless institution builder, Dr. Izrael founded and for more than two ...
CLIMATE CHANGE 2014 Impacts, Adaptation, and Vulnerability
INTERGOV ERNMENTA L PA NEL ON
climate change
CLIMATE CHANGE 2014 Impacts, Adaptation, and Vulnerability
Summaries, Frequently Asked Questions, and Cross-Chapter Boxes
WG II
WORKING GROUP II CONTRIBUTION TO THE FIFTH ASSESSMENT REPORT OF THE INTERGOVERNMENTAL PANEL ON CLIMATE CHANGE
Climate Change 2014 Impacts, Adaptation, and Vulnerability Summaries, Frequently Asked Questions, and Cross-Chapter Boxes A Working Group II Contribution to the Fifth Assessment Report of the Intergovernmental Panel on Climate Change
Edited by Christopher B. Field Working Group II Co-Chair
Vicente R. Barros Working Group II Co-Chair
Department of Global Ecology Carnegie Institution for Science
Centro de Investigaciones del Mar y la Atmósfera Universidad de Buenos Aires
David Jon Dokken
Katharine J. Mach
Michael D. Mastrandrea
Executive Director
Co-Director of Science
Co-Director of Science
T. Eren Bilir Eric S. Kissel
Monalisa Chatterjee Andrew N. Levy
Kristie L. Ebi
Yuka Otsuki Estrada Robert C. Genova
Sandy MacCracken
Patricia R. Mastrandrea
Working Group II Technical Support Unit
Betelhem Girma Leslie L. White
© 2014 Intergovernmental Panel on Climate Change ISBN 978-92-9169-141-8 The designations employed and the presentation of material on maps do not imply the expression of any opinion whatsoever on the part of the Intergovernmental Panel on Climate Change concerning the legal status of any country, territory, city, or area or of its authorities, or concerning the delimitation of its frontiers or boundaries. Use the following reference to cite this publication: IPCC, 2014: Climate Change 2014: Impacts, Adaptation, and Vulnerability. Summaries, Frequently Asked Questions, and Cross-Chapter Boxes. A Contribution of Working Group II to the Fifth Assessment Report of the Intergovernmental Panel on Climate Change [Field, C.B., V.R. Barros, D.J. Dokken, K.J. Mach, M.D. Mastrandrea, T.E. Bilir, M. Chatterjee, K.L. Ebi, Y.O. Estrada, R.C. Genova, B. Girma, E.S. Kissel, A.N. Levy, S. MacCracken,P.R. Mastrandrea, and L.L. White (eds.)]. World Meteorological Organization, Geneva, Switzerland, 190 pp. (in Arabic, Chinese, English, French, Russian, and Spanish) Cover Photo: Planting of mangrove seedlings in Funafala, Funafuti Atoll, Tuvalu. © David J. Wilson
Contents Front Matter
Foreword Preface
TS
FAQs
CC Boxes
Annex
xiii
....................................................................................................
Summary for Policymakers
Technical Summary
..................................................................................
..........................................................................................
Working Group II Frequently Asked Questions
Cross-Chapter Boxes
Glossary
ix
.........................................................................................................
Dedication
SPM
vii
......................................................................................................
1
35
.........................................................
95
........................................................................................
99
......................................................................................................................
171
iii
Foreword, Preface, and Dedication
v
Foreword Climate Change 2014: Impacts, Adaptation, and Vulnerability is the second
The IPCC was established by the World Meteorological Organization
volume of the Fifth Assessment Report (AR5) of the Intergovernmental
(WMO) and the United Nations Environment Programme (UNEP) in
Panel on Climate Change (IPCC) — Climate Change 2013/2014 — and
1988, with the mandate to provide the world community with the most
was prepared by its Working Group II. The volume focuses on why
up-to-date and comprehensive scientific, technical, and socio-economic
climate change matters and is organized into two parts, devoted
information about climate change. The IPCC assessments have since
respectively to human and natural systems and regional aspects,
then played a major role in motivating governments to adopt and
incorporating results from the reports of Working Groups I and III. The
implement policies in responding to climate change, including the
volume addresses impacts that have already occurred and risks of future
United Nations Framework Convention on Climate Change and the
impacts, especially the way those risks change with the amount of
Kyoto Protocol. IPCC’s AR5 provides an important foundation of
climate change that occurs and with investments in adaptation to
information for the world’s policymakers, to help them respond to the
climate changes that cannot be avoided. For both past and future
challenge of climate change.
impacts, a core focus of the assessment is characterizing knowledge about vulnerability, the characteristics and interactions that make some
The Impacts, Adaptation, and Vulnerability report was made possible
events devastating, while others pass with little notice.
thanks to the commitment and voluntary labor of a large number of leading scientists. We would like to express our gratitude to all
Three elements are new in this assessment. Each contributes to a richer,
Coordinating Lead Authors, Lead Authors, Contributing Authors, Review
more nuanced understanding of climate change in its real-world context.
Editors, and Reviewers. We would also like to thank the staff of the
The first new element is a major expansion of the topics covered in the
Working Group II Technical Support Unit and the IPCC Secretariat for
assessment. In moving from 20 chapters in the AR4 to 30 in the AR5, the
their dedication in organizing the production of a very successful IPCC
Working Group II assessment makes it clear that expanding knowledge
report. Furthermore, we would like to express our thanks to Dr. Rajendra
about climate change and its impacts mandates attention to more sectors,
K. Pachauri, Chairman of the IPCC, for his patient and constant guidance
including sectors related to human security, livelihoods, and the oceans.
through the process, and to Drs. Vicente Barros and Chris Field, Co-Chairs
The second new element is a pervasive focus on risk, where risk captures
of Working Group II, for their skillful leadership. We also wish to
the combination of uncertain outcomes and something of value at stake.
acknowledge and thank those governments and institutions that
A framing based on risk provides a framework for utilizing information
contributed to the IPCC Trust Fund and supported the participation of
on the full range of possible outcomes, including not only most likely
their resident scientists in the IPCC process. We would like to mention in
outcomes but also low probability but high consequence events. The
particular the Government of the United States of America, which funded
third new element is solid grounding in the evidence that impacts of
the Technical Support Unit; the Government of Japan, which hosted the
climate change typically involve a number of interacting factors, with
plenary session for the approval of the report; and the Governments of
climate change adding new dimensions and complications. The
Japan, United States of America, Argentina, and Slovenia, which hosted
implication is that understanding the impacts of climate change requires
the drafting sessions to prepare the report.
a very broad perspective.
M. Jarraud Secretary-General World Meteorological Organization
A. Steiner Executive Director United Nations Environment Programme
vii
1
Preface The Working Group II contribution to the Fifth Assessment Report of the Intergovernmental Panel on Climate Change (IPCC WGII AR5) considers climate change impacts, adaptation, and vulnerability. It provides a comprehensive, up-to-date picture of the current state of knowledge and level of certainty, based on the available scientific, technical, and socio-economic literature. As with all IPCC products, the report is the result of an assessment process designed to highlight both big-picture messages and key details, to integrate knowledge from diverse disciplines, to evaluate the strength of evidence underlying findings, and to identify topics where understanding is incomplete. The focus of the assessment is providing information to support good decisions by stakeholders at all levels. The assessment is a unique source of background for decision support, while scrupulously avoiding advocacy for particular policy options.
Scope of the Report Climate change impacts, adaptation, and vulnerability span a vast range of topics. With the deepening of knowledge about climate change, we see connections in expanding and diverse areas, activities, and assets at risk. Early research focused on direct impacts of temperature and rainfall on humans, crops, and wild plants and animals. New evidence points to the importance of understanding not only these direct impacts but also potential indirect impacts, including impacts that can be transmitted around the world through trade, travel, and security. As a consequence, few aspects of the human endeavor or of natural ecosystem processes are isolated from possible impacts in a changing climate. The interconnectedness of the Earth system makes it impossible to draw a confined boundary around climate change impacts, adaptation, and vulnerability. This report does not attempt to bound the issue. Instead, it focuses on core elements and identifies connecting points where the issue of climate change overlaps with or merges into other issues. The integrative nature of the climate change issue underlies three major new elements of the WGII contribution to the AR5. The first is explicit coverage of a larger range of topics, with new chapters. Increasing knowledge, expressed in a rapidly growing corpus of published literature, enables deeper assessment in a number of areas. Some of these are geographic, especially the addition of two chapters on oceans. Other new chapters further develop topics covered in earlier assessments, reflecting the increased sophistication of the available research. Expanded coverage of human settlements, security, and livelihoods builds on new research concerning human dimensions of climate change. A large increase in the published literature on adaptation motivates assessment in a suite of chapters. A second new emphasis is the focus on climate change as a challenge in managing and reducing risk, as well as capitalizing on opportunities. There are several advantages to understanding the risk of impacts from climate change as resulting from the overlap of hazards from the physical climate and the vulnerability and exposure of people, ecosystems, and assets. Some of the advantages accrue from the opportunity to evaluate factors that regulate each component of risk. Others relate to the way
that a focus on risk can clarify bridges to solutions. A focus on risk can link historical experience with future projections. It helps integrate the role of extremes. And it highlights the importance of considering the full range of possible outcomes, while opening the door to a range of tools relevant to decision making under uncertainty. A third new emphasis ties together the interconnectedness of climate change with a focus on risk. Risks of climate change unfold in environments with many interacting processes and stressors. Often, climate change acts mainly through adding new dimensions and complications to sometimes longstanding challenges. Appreciating the multi-stressor context of the risks of climate change can open doors to new insights and approaches for solutions. Increased knowledge of the risks of climate change can be a starting point for understanding the opportunities for and implications of possible solutions. Some of the solution space is in the domain of mitigation, extensively covered by the Working Group III contribution to the AR5. The WGII AR5 delves deep into adaptation. But many opportunities exist in linking climate change adaptation, mitigation, and sustainable development. In contrast to past literature that tended to characterize adaptation, mitigation, and sustainable development as competing agendas, new literature identifies complementarities. It shines light on options for leveraging investments in managing and reducing the risks of climate change to enable vibrant communities, robust economies, and healthy ecosystems, in all parts of the world.
Structure of the Report The Working Group II contribution to the IPCC Fifth Assessment Report consists of a brief summary for policymakers, a longer technical summary, and 30 thematic chapters, plus supporting annexes. A series of crosschapter boxes and a collection of Frequently Asked Questions provide an integrated perspective on selected key issues. Electronic versions of all the printed contents, plus supplemental online material, are available at no charge at www.ipcc.ch. The report is published in two parts. Part A covers global-scale topics for a wide range of sectors, covering physical, biological, and human systems. Part B considers the same topics, but from a regional perspective, exploring the issues that arise from the juxtaposition of climate change, environment, and available resources. Conceptually, there is some overlap between the material in Parts A and B, but the contrast in framing makes each part uniquely relevant to a particular group of stakeholders. For setting context and meeting the needs of users focused on regionalscale issues, Part B extracts selected materials from the Working Group I and Working Group III contributions to the Fifth Assessment Report. To acknowledge the different purposes for the two parts and the balanced contributions of the co-chairs, the listing order of the editors differs between the two parts, with Chris Field listed first on Part A and Vicente Barros listed first on Part B. The 20 chapters in Part A are arranged in six thematic groups. ix
Preface
Context for the AR5 The two chapters in this group, (1) Point of departure and (2) Foundations for decision making, briefly summarize the conclusions of the Fourth Assessment Report and the Working Group I contribution to the AR5. They explain the motivation for the focus on climate change as a challenge in managing and reducing risks and assess the relevance of diverse approaches to decision making in the context of climate change.
Natural and Managed Resources and Systems, and Their Uses The five chapters in this group, (3) Freshwater resources, (4) Terrestrial and inland water systems, (5) Coastal systems and low-lying areas, (6) Ocean systems, and (7) Food security and food production systems, cover diverse sectors, with a new emphasis on resource security. The ocean systems chapter, focused on the processes at work in ocean ecosystems, is a major element of the increased coverage of oceans in the WGII AR5.
Human Settlements, Industry, and Infrastructure The three chapters in this group, (8) Urban areas, (9) Rural areas, and (10) Key economic sectors and services, provide expanded coverage of settlements and economic activity. With so many people living in and moving to cities, urban areas are increasingly important in understanding the climate change issue.
Human Health, Well-Being, and Security The three chapters in this group, (11) Human health: impacts, adaptation, and co-benefits, (12) Human security, and (13) Livelihoods and poverty, increase the focus on people. These chapters address a wide range of processes, from vector-borne disease through conflict and migration. They assess the relevance of local and traditional knowledge.
Adaptation An expanded treatment of adaptation is one of the signature changes in the WGII AR5. Chapters treat (14) Adaptation needs and options, (15) Adaption planning and implementation, (16) Adaptation opportunities, constraints, and limits, and (17) Economics of adaptation. This coverage reflects a large increase in literature and the emergence of climatechange adaptation plans in many countries and concrete action in some.
Multi-Sector Impacts, Risks, Vulnerabilities, and Opportunities The three chapters in this group, (18) Detection and attribution of observed impacts, (19) Emergent risks and key vulnerabilities, and (20)
x
Climate-resilient pathways: adaptation, mitigation, and sustainable development, collect material from the chapters in both Parts A and B to provide a sharp focus on aspects of climate change that emerge only by examining many examples across the regions of the Earth and the entirety of the human endeavor. These chapters provide an integrative view of three central questions related to understanding risks in a changing climate – what are the impacts to date (and how certain is the link to climate change), what are the most important risks looking forward, and what are the opportunities for linking responses to climate change with other societal goals. The 10 chapters in Part B start with a chapter, (21) Regional context, structured to help readers understand and capitalize on regional information. It is followed by chapters on 9 world regions: (22) Africa, (23) Europe, (24) Asia, (25) Australasia, (26) North America, (27) Central and South America, (28) Polar regions, (29) Small islands, and (30) The ocean (taking a regional cut through ocean issues, including human utilization of ocean resources). Each chapter in this part is an all-in-one resource for regional stakeholders, while also contributing to and building from the global assessment. Regional climate-change maps, which complement the Working Group I Atlas of Global and Regional Climate Projections, and quantified key regional risks are highlights of these chapters. Each chapter explores the issues and themes that are most relevant in the region.
Process The Working Group II contribution to the IPCC Fifth Assessment Report was prepared in accordance with the procedures of the IPCC. Chapter outlines were discussed and defined at a scoping meeting in Venice in July 2009, and outlines for the three Working Group contributions were approved at the 31st session of the Panel in November 2009, in Bali, Indonesia. Governments and IPCC observer organizations nominated experts for the author team. The team of 64 Coordinating Lead Authors, 179 Lead Authors, and 66 Review Editors was selected by the WGII Bureau and accepted by the IPCC Bureau in May 2010. More than 400 Contributing Authors, selected by the chapter author teams, contributed text. Drafts prepared by the author teams were submitted for two rounds of formal review by experts, of which one was also a review by governments. Author teams revised the draft chapters after each round of review, with Review Editors working to assure that every review comment was fully considered, and where appropriate, chapters were adjusted to reflect points raised in the reviews. In addition, governments participated in a final round of review of the draft Summary for Policymakers. All of the chapter drafts, review comments, and author responses are available online via www.ipcc.ch. Across all of the drafts, the WGII contribution to the AR5 received 50,492 comments from 1,729 individual expert reviewers from 84 countries. The Summary for Policymakers was approved line-by-line by the Panel, and the underlying chapters were accepted at the 10th Session of IPCC Working Group II and the 38th Session of the IPCC Panel, meeting in Yokohama, Japan, from March 25-30, 2014.
Preface
Acknowledgments For the AR5, Working Group II had an amazing author team. In many ways, the author team encompasses the entire scientific community, including scientists who conducted the research and wrote the research papers on which the assessment is based, and the reviewers who contributed their wisdom in more than 50,000 review comments. But the process really ran on the sophistication, wisdom, and dedication of the 309 individuals from 70 countries who comprise the WGII team of Coordinating Lead Authors, Lead Authors, and Review Editors. These individuals, with the support of a talented group of volunteer chapter scientists and the assistance of scores of contributing authors, demonstrated an inspirational commitment to scientific quality and public service. Tragically, three of our most experienced authors passed away while the report was being written. We greatly miss JoAnn Carmin, Abby Sallenger, and Steve Schneider. We benefitted greatly from the advice and guidance of the Working Group II Bureau: Amjad Abdulla (Maldives), Eduardo Calvo Buendía (Peru), José M. Moreno (Spain), Nirivololona Raholijao (Madagascar), Sergey Semenov (Russian Federation), and Neville Smith (Australia). Their understanding of regional resources and concerns has been invaluable. Throughout the AR5, we benefitted greatly from the wisdom and insight of our colleagues in the IPCC leadership, especially the IPCC chair, R.K. Pachauri. All of the members of the IPCC Executive Committee worked effectively and selflessly on issues related to the reports from all three working groups. We extend a heartfelt thanks to all of the members of the ExCom: R.K. Pachauri, Ottmar Edenhofer, Ismail El Gizouli, Taka Hiraishi, Thelma Krug, Hoesung Lee, Ramón Pichs Madruga, Qin Dahe, Youba Sokona, Thomas Stocker, and Jean-Pascal van Ypersele.
government of Japan for hosting the approval session. The government of the United States provided essential financial support for the Working Group II Technical Support Unit. Special thanks to the principals of the United States Global Change Research Program for orchestrating the funding across many research agencies. We want very much to thank the Secretary of the IPCC, Renate Christ, and the staff of the IPCC Secretariat: Gaetano Leone, Carlos MartinNovella, Jonathan Lynn, Brenda Abrar-Milani, Jesbin Baidya, Laura Biagioni, Mary Jean Burer, Annie Courtin, Judith Ewa, Joelle Fernandez, Nina Peeva, Sophie Schlingemann, Amy Smith, and Werani Zabula. Thanks to Francis Hayes who served as conference officer for the approval session. Thanks to the individuals who coordinated the organization for each of the lead authors meetings. This was Mizue Yuzurihara and Claire Summers for LAM1, Sandy MacCracken for LAM2, Ramiro Saurral for LAM3, and Mojca Deželak for LAM4. Students from Japan, the United States, Argentina, and Slovenia helped with the lead author meetings. The WGII Technical Support Unit was fabulous. They combined scientific sophistication, technical excellence, artistic vision, deep resilience, and profound dedication, not to mention a marked ability to compensate for oversights by and deficiencies of the co-chairs. Dave Dokken, Mike Mastrandrea, Katie Mach, Kris Ebi, Monalisa Chatterjee, Sandy MacCracken, Eric Kissel, Yuka Estrada, Leslie White, Eren Bilir, Rob Genova, Beti Girma, Andrew Levy, and Patricia Mastrandrea have all made wonderful contributions to the report. In addition, the work of David Ropeik (frequently asked questions), Marcos Senet (assistant to Vicente Barros), Terry Kornak (technical edits), Marilyn Anderson (index), Liu Yingjie (Chinese author support), and Janak Pathak (UNEP communications) made a big difference. Kyle Terran, Gete Bond, and Sandi Fikes facilitated travel. Volunteer contributions from John Kelley and Ambarish Malpani greatly enhanced reference management. Catherine Lemmi, Ian Sparkman, and Danielle Olivera were super interns.
We are very appreciative of the enthusiastic cooperation of the nations that hosted our excellent working meetings, including four lead author meetings and the 10th Session of Working Group II. We gratefully acknowledge the support of the governments of Japan, the United States, Argentina, and Slovenia for hosting the lead author meetings, and the
We extend a deep, personal thanks to our families and to the families of every author and reviewer. We know you tolerated many late nights and weekends with partners, parents, or children sitting at the computer or mumbling about one more assignment from us.
Vicente Barros IPCC WGII Co-Chair
Chris Field IPCC WGII Co-Chair
xi
Credit: Odd-Steinar Tøllefsen
Dedication
Yuri Antonievich Izrael (15 May 1930 to 23 January 2014)
The Working Group II contribution to the IPCC Fifth Assessment Report is dedicated to the memory of Professor Yuri Antonievich Izrael, first Chair of Working Group II from 1988 to 1992 and IPCC Vice Chair from 1992 to 2008. Professor Izrael was a pioneer, opening doors that have allowed thousands of scientists to contribute to the work of the IPCC. Through a long and distinguished career, Professor Izrael was a strong proponent of environmental sciences, meteorology, climatology, and international organizations, especially the IPCC and the World Meteorological Organization. A creative researcher and tireless institution builder, Dr. Izrael founded and for more than two decades led the Institute of Global Climate and Ecology. In the IPCC, Professor Izrael played a central role in creating the balance of IPCC efforts on careful observations, mechanisms, and systematic projections using scenarios. An outspoken advocate for the robust integration of scientific excellence and broad participation in IPCC reports, Dr. Izrael pioneered many of the features that assure the comprehensiveness and integrity of IPCC reports.
xiii
Introduction
Chapter 2
Summary for Policymakers
xv
SPM
Summary for Policymakers Drafting Authors: Christopher B. Field (USA), Vicente R. Barros (Argentina), Michael D. Mastrandrea (USA), Katharine J. Mach (USA), Mohamed A.-K. Abdrabo (Egypt), W. Neil Adger (UK), Yury A. Anokhin (Russian Federation), Oleg A. Anisimov (Russian Federation), Douglas J. Arent (USA), Jonathon Barnett (Australia), Virginia R. Burkett (USA), Rongshuo Cai (China), Monalisa Chatterjee (USA/India), Stewart J. Cohen (Canada), Wolfgang Cramer (Germany/France), Purnamita Dasgupta (India), Debra J. Davidson (Canada), Fatima Denton (Gambia), Petra Döll (Germany), Kirstin Dow (USA), Yasuaki Hijioka (Japan), Ove Hoegh-Guldberg (Australia), Richard G. Jones (UK), Roger N. Jones (Australia), Roger L. Kitching (Australia), R. Sari Kovats (UK), Joan Nymand Larsen (Iceland), Erda Lin (China), David B. Lobell (USA), Iñigo J. Losada (Spain), Graciela O. Magrin (Argentina), José A. Marengo (Brazil), Anil Markandya (Spain), Bruce A. McCarl (USA), Roger F. McLean (Australia), Linda O. Mearns (USA), Guy F. Midgley (South Africa), Nobuo Mimura (Japan), John F. Morton (UK), Isabelle Niang (Senegal), Ian R. Noble (Australia), Leonard A. Nurse (Barbados), Karen L. O’Brien (Norway), Taikan Oki (Japan), Lennart Olsson (Sweden), Michael Oppenheimer (USA), Jonathan T. Overpeck (USA), Joy J. Pereira (Malaysia), Elvira S. Poloczanska (Australia), John R. Porter (Denmark), Hans-O. Pörtner (Germany), Michael J. Prather (USA), Roger S. Pulwarty (USA), Andy Reisinger (New Zealand), Aromar Revi (India), Patricia Romero-Lankao (Mexico), Oliver C. Ruppel (Namibia), David E. Satterthwaite (UK), Daniela N. Schmidt (UK), Josef Settele (Germany), Kirk R. Smith (USA), Dáithí A. Stone (Canada/South Africa/USA), Avelino G. Suarez (Cuba), Petra Tschakert (USA), Riccardo Valentini (Italy), Alicia Villamizar (Venezuela), Rachel Warren (UK), Thomas J. Wilbanks (USA), Poh Poh Wong (Singapore), Alistair Woodward (New Zealand), Gary W. Yohe (USA)
This Summary for Policymakers should be cited as: IPCC, 2014: Summary for policymakers. In: Climate Change 2014: Impacts, Adaptation, and Vulnerability. Summaries, Frequently Asked Questions, and Cross-Chapter Boxes. A Contribution of Working Group II to the Fifth Assessment Report of the Intergovernmental Panel on Climate Change [Field, C.B., V.R. Barros, D.J. Dokken, K.J. Mach, M.D. Mastrandrea, T.E. Bilir, M. Chatterjee, K.L. Ebi, Y.O. Estrada, R.C. Genova, B. Girma, E.S. Kissel, A.N. Levy, S. MacCracken, P.R. Mastrandrea, and L.L. White (eds.)]. World Meteorological Organization, Geneva, Switzerland, pp. 1-32. (in Arabic, Chinese, English, French, Russian, and Spanish)
1
Summary for Policymakers
Contents
Assessing and Managing the Risks of Climate Change ........................................................................................................ 3 Background Box SPM.1. Context for the Assessment ........................................................................................................................................ 4 Background Box SPM.2. Terms Central for Understanding the Summary .......................................................................................................... 5 Background Box SPM.3. Communication of the Degree of Certainty in Assessment Findings ........................................................................... 6
A:
Observed Impacts, Vulnerability, and Adaptation in a Complex and Changing World ............................................... 4 A-1. Observed Impacts, Vulnerability, and Exposure .......................................................................................................................................... 4 A-2. Adaptation Experience ............................................................................................................................................................................... 8 A-3. The Decision-making Context .................................................................................................................................................................... 9
B:
Future Risks and Opportunities for Adaptation ........................................................................................................ 11 B-1. Key Risks across Sectors and Regions ...................................................................................................................................................... 11 Assessment Box SPM.1. Human Interference with the Climate System ........................................................................................................... 12 B-2. Sectoral Risks and Potential for Adaptation ............................................................................................................................................. 14 B-3. Regional Key Risks and Potential for Adaptation ..................................................................................................................................... 20 Assessment Box SPM.2. Regional Key Risks .................................................................................................................................................... 21
C:
Managing Future Risks and Building Resilience ....................................................................................................... 25 C-1. Principles for Effective Adaptation ........................................................................................................................................................... 25 C-2. Climate-resilient Pathways and Transformation ....................................................................................................................................... 28
Supplementary Material ..................................................................................................................................................... 30
2
Summary for Policymakers
ASSESSING AND MANAGING THE RISKS OF CLIMATE CHANGE Human interference with the climate system is occurring,1 and climate change poses risks for human and natural systems (Figure SPM.1). The assessment of impacts, adaptation, and vulnerability in the Working Group II contribution to the IPCC’s Fifth Assessment Report (WGII AR5) evaluates how patterns of risks and potential benefits are shifting due to climate change. It considers how impacts and risks related to climate SPM
change can be reduced and managed through adaptation and mitigation. The report assesses needs, options, opportunities, constraints, resilience, limits, and other aspects associated with adaptation. Climate change involves complex interactions and changing likelihoods of diverse impacts. A focus on risk, which is new in this report, supports decision making in the context of climate change and complements other elements of the report. People and societies may perceive or rank risks and potential benefits differently, given diverse values and goals. Compared to past WGII reports, the WGII AR5 assesses a substantially larger knowledge base of relevant scientific, technical, and socioeconomic literature. Increased literature has facilitated comprehensive assessment across a broader set of topics and sectors, with expanded coverage of human systems, adaptation, and the ocean. See Background Box SPM.1.2 Section A of this summary characterizes observed impacts, vulnerability and exposure, and adaptive responses to date. Section B examines future risks and potential benefits. Section C considers principles for effective adaptation and the broader interactions among adaptation, mitigation,
IMPACTS
Vulnerability
CLIMATE
SOCIOECONOMIC PROCESSES Socioeconomic Pathways
Natural Variability
Hazards
RISK R
Adaptation and Mitigation Actions
Anthropogenic Climate Change
Governance
Exposure
EMISSIONS and Land-use Change
Figure SPM.1 | Illustration of the core concepts of the WGII AR5. Risk of climate-related impacts results from the interaction of climate-related hazards (including hazardous events and trends) with the vulnerability and exposure of human and natural systems. Changes in both the climate system (left) and socioeconomic processes including adaptation and mitigation (right) are drivers of hazards, exposure, and vulnerability. [19.2, Figure 19-1] 1
2
A key finding of the WGI AR5 is, “It is extremely likely that human influence has been the dominant cause of the observed warming since the mid-20th century.” [WGI AR5 SPM Section D.3, 2.2, 6.3, 10.3-6, 10.9] 1.1, Figure 1-1
3
Summary for Policymakers
Background Box SPM.1 | Context for the Assessment For the past 2 decades, IPCC’s Working Group II has developed assessments of climate-change impacts, adaptation, and vulnerability. The WGII AR5 builds from the WGII contribution to the IPCC’s Fourth Assessment Report (WGII AR4), published in 2007, and the Special Report on Managing the Risks of Extreme Events and Disasters to Advance Climate Change Adaptation (SREX), published in 2012. It follows the Working Group I contribution to the AR5 (WGI AR5).3
SPM
The number of scientific publications available for assessing climate-change impacts, adaptation, and vulnerability more than doubled between 2005 and 2010, with especially rapid increases in publications related to adaptation. Authorship of climate-change publications from developing countries has increased, although it still represents a small fraction of the total.4 The WGII AR5 is presented in two parts (Part A: Global and Sectoral Aspects, and Part B: Regional Aspects), reflecting the expanded literature basis and multidisciplinary approach, increased focus on societal impacts and responses, and continued regionally comprehensive coverage.
and sustainable development. Background Box SPM.2 defines central concepts, and Background Box SPM.3 introduces terms used to convey the degree of certainty in key findings. Chapter references in brackets and in footnotes indicate support for findings, figures, and tables.
A: OBSERVED IMPACTS, VULNERABILITY, AND ADAPTATION IN A COMPLEX AND CHANGING WORLD A-1. Observed Impacts, Vulnerability, and Exposure In recent decades, changes in climate have caused impacts on natural and human systems on all continents and across the oceans. Evidence of climate-change impacts is strongest and most comprehensive for natural systems. Some impacts on human systems have also been attributed5 to climate change, with a major or minor contribution of climate change distinguishable from other influences. See Figure SPM.2. Attribution of observed impacts in the WGII AR5 generally links responses of natural and human systems to observed climate change, regardless of its cause.6 In many regions, changing precipitation or melting snow and ice are altering hydrological systems, affecting water resources in terms of quantity and quality (medium confidence). Glaciers continue to shrink almost worldwide due to climate change (high confidence), affecting runoff and water resources downstream (medium confidence). Climate change is causing permafrost warming and thawing in highlatitude regions and in high-elevation regions (high confidence).7 Many terrestrial, freshwater, and marine species have shifted their geographic ranges, seasonal activities, migration patterns, abundances, and species interactions in response to ongoing climate change (high confidence). See Figure SPM.2B. While only a few recent species extinctions have been attributed as yet to climate change (high confidence), natural global climate change at rates slower than current anthropogenic climate change caused significant ecosystem shifts and species extinctions during the past millions of years (high confidence).8 Based on many studies covering a wide range of regions and crops, negative impacts of climate change on crop yields have been more common than positive impacts (high confidence). The smaller number of studies showing positive impacts relate mainly to 3 4 5
6 7 8
4
1.2-3 1.1, Figure 1-1 The term attribution is used differently in WGI and WGII. Attribution in WGII considers the links between impacts on natural and human systems and observed climate change, regardless of its cause. By comparison, attribution in WGI quantifies the links between observed climate change and human activity, as well as other external climate drivers. 18.1, 18.3-6 3.2, 4.3, 18.3, 18.5, 24.4, 26.2, 28.2, Tables 3-1 and 25-1, Figures 18-2 and 26-1 4.2-4, 5.3-4, 6.1, 6.3-4, 18.3, 18.5, 22.3, 24.4, 25.6, 28.2, 30.4-5, Boxes 4-2, 4-3, 25-3, CC-CR, and CC-MB
Summary for Policymakers
Background Box SPM.2 | Terms Central for Understanding the Summary9 Climate change: Climate change refers to a change in the state of the climate that can be identified (e.g., by using statistical tests) by changes in the mean and/or the variability of its properties, and that persists for an extended period, typically decades or longer. Climate change may be due to natural internal processes or external forcings such as modulations of the solar cycles, volcanic eruptions, and persistent anthropogenic changes in the composition of the atmosphere or in land use. Note that the Framework Convention on Climate Change (UNFCCC), in its Article 1, defines climate change as: “a change of climate which is attributed directly or indirectly to human activity that alters the composition of the global atmosphere and which is in addition to natural climate variability observed over comparable time periods.” The UNFCCC thus makes a distinction between climate change attributable to human activities altering the atmospheric composition, and climate variability attributable to natural causes.
SPM
Hazard: The potential occurrence of a natural or human-induced physical event or trend or physical impact that may cause loss of life, injury, or other health impacts, as well as damage and loss to property, infrastructure, livelihoods, service provision, ecosystems, and environmental resources. In this report, the term hazard usually refers to climate-related physical events or trends or their physical impacts. Exposure: The presence of people, livelihoods, species or ecosystems, environmental functions, services, and resources, infrastructure, or economic, social, or cultural assets in places and settings that could be adversely affected. Vulnerability: The propensity or predisposition to be adversely affected. Vulnerability encompasses a variety of concepts and elements including sensitivity or susceptibility to harm and lack of capacity to cope and adapt. Impacts: Effects on natural and human systems. In this report, the term impacts is used primarily to refer to the effects on natural and human systems of extreme weather and climate events and of climate change. Impacts generally refer to effects on lives, livelihoods, health, ecosystems, economies, societies, cultures, services, and infrastructure due to the interaction of climate changes or hazardous climate events occurring within a specific time period and the vulnerability of an exposed society or system. Impacts are also referred to as consequences and outcomes. The impacts of climate change on geophysical systems, including floods, droughts, and sea level rise, are a subset of impacts called physical impacts. Risk: The potential for consequences where something of value is at stake and where the outcome is uncertain, recognizing the diversity of values. Risk is often represented as probability of occurrence of hazardous events or trends multiplied by the impacts if these events or trends occur. Risk results from the interaction of vulnerability, exposure, and hazard (see Figure SPM.1). In this report, the term risk is used primarily to refer to the risks of climate-change impacts. Adaptation: The process of adjustment to actual or expected climate and its effects. In human systems, adaptation seeks to moderate or avoid harm or exploit beneficial opportunities. In some natural systems, human intervention may facilitate adjustment to expected climate and its effects. Transformation: A change in the fundamental attributes of natural and human systems. Within this summary, transformation could reflect strengthened, altered, or aligned paradigms, goals, or values towards promoting adaptation for sustainable development, including poverty reduction. Resilience: The capacity of social, economic, and environmental systems to cope with a hazardous event or trend or disturbance, responding or reorganizing in ways that maintain their essential function, identity, and structure, while also maintaining the capacity for adaptation, learning, and transformation.
high-latitude regions, though it is not yet clear whether the balance of impacts has been negative or positive in these regions (high confidence). Climate change has negatively affected wheat and maize yields for many regions and in the global aggregate (medium confidence). Effects on rice and soybean yield have been smaller in major production regions and globally, with a median change of zero across all available data, which are fewer for soy compared to the other crops. Observed impacts relate mainly to production aspects of food security rather than access 9
The WGII AR5 glossary defines many terms used across chapters of the report. Reflecting progress in science, some definitions differ in breadth and focus from the definitions used in the AR4 and other IPCC reports.
5
Summary for Policymakers
Background Box SPM.3 | Communication of the Degree of Certainty in Assessment Findings10 The degree of certainty in each key finding of the assessment is based on the type, amount, quality, and consistency of evidence (e.g., data, mechanistic understanding, theory, models, expert judgment) and the degree of agreement. The summary terms to describe evidence are: limited, medium, or robust; and agreement: low, medium, or high.
SPM
Confidence in the validity of a finding synthesizes the evaluation of evidence and agreement. Levels of confidence include five qualifiers: very low, low, medium, high, and very high. The likelihood, or probability, of some well-defined outcome having occurred or occurring in the future can be described quantitatively through the following terms: virtually certain, 99–100% probability; extremely likely, 95–100%; very likely, 90–100%; likely, 66–100%; more likely than not, >50–100%; about as likely as not, 33–66%; unlikely, 0–33%; very unlikely, 0–10%; extremely unlikely, 0–5%; and exceptionally unlikely, 0–1%. Unless otherwise indicated, findings assigned a likelihood term are associated with high or very high confidence. Where appropriate, findings are also formulated as statements of fact without using uncertainty qualifiers. Within paragraphs of this summary, the confidence, evidence, and agreement terms given for a bold key finding apply to subsequent statements in the paragraph, unless additional terms are provided.
or other components of food security. See Figure SPM.2C. Since AR4, several periods of rapid food and cereal price increases following climate extremes in key producing regions indicate a sensitivity of current markets to climate extremes among other factors (medium confidence).11 At present the worldwide burden of human ill-health from climate change is relatively small compared with effects of other stressors and is not well quantified. However, there has been increased heat-related mortality and decreased cold-related mortality in some regions as a result of warming (medium confidence). Local changes in temperature and rainfall have altered the distribution of some waterborne illnesses and disease vectors (medium confidence).12 Differences in vulnerability and exposure arise from non-climatic factors and from multidimensional inequalities often produced by uneven development processes (very high confidence). These differences shape differential risks from climate change. See Figure SPM.1. People who are socially, economically, culturally, politically, institutionally, or otherwise marginalized are especially vulnerable to climate change and also to some adaptation and mitigation responses (medium evidence, high agreement). This heightened vulnerability is rarely due to a single cause. Rather, it is the product of intersecting social processes that result in inequalities in socioeconomic status and income, as well as in exposure. Such social processes include, for example, discrimination on the basis of gender, class, ethnicity, age, and (dis)ability.13 Impacts from recent climate-related extremes, such as heat waves, droughts, floods, cyclones, and wildfires, reveal significant vulnerability and exposure of some ecosystems and many human systems to current climate variability (very high confidence). Impacts of such climate-related extremes include alteration of ecosystems, disruption of food production and water supply, damage to infrastructure and settlements, morbidity and mortality, and consequences for mental health and human well-being. For countries at all levels of development, these impacts are consistent with a significant lack of preparedness for current climate variability in some sectors.14 Climate-related hazards exacerbate other stressors, often with negative outcomes for livelihoods, especially for people living in poverty (high confidence). Climate-related hazards affect poor people’s lives directly through impacts on livelihoods, reductions in crop 10 11 12 13 14
6
1.1, Box 1-1 7.2, 18.4, 22.3, 26.5, Figures 7-2, 7-3, and 7-7 11.4-6, 18.4, 25.8 8.1-2, 9.3-4, 10.9, 11.1, 11.3-5, 12.2-5, 13.1-3, 14.1-3, 18.4, 19.6, 23.5, 25.8, 26.6, 26.8, 28.4, Box CC-GC 3.2, 4.2-3, 8.1, 9.3, 10.7, 11.3, 11.7, 13.2, 14.1, 18.6, 22.3, 25.6-8, 26.6-7, 30.5, Tables 18-3 and 23-1, Figure 26-2, Boxes 4-3, 4-4, 25-5, 25-6, 25-8, and CC-CR
Summary for Policymakers
(A)
ARCTIC
EUROPE
SPM
NORTH AMERICA ASIA
SMALL ISLANDS
AFRICA CENTRAL & SOUTH AMERICA
AUSTRALASIA ANTARCTIC
Confidence in attribution to climate change
very low
low
med high
Observed impacts attributed to climate change for Physical systems Glaciers, snow, ice, and/or permafrost
very high
indicates confidence range
Biological systems
Food production
Rivers, lakes, floods, and/or drought
Wildfire
Livelihoods, health, and/or economics
Coastal erosion and/or sea level effects
Marine ecosystems
Regional-scale impacts
Outlined symbols = Minor contribution of climate change Filled symbols = Major contribution of climate change
(3) Standard error Mean
400
Standard error
(13) 100 (20) (90) 20
(29)
(9)
(111)
(359)
(46) (29) (9)
Yield impact (% change per decade)
(C) Cooler
(B) Distribution change (km per decade)
Human and managed systems
Terrestrial ecosystems
2 (19)
(27)
(18)
(13)
(12)
0
–2
−4 90th percentile 75th percentile
Warmer
0 –20
(10)
Median
−6
25th percentile
Be nt hic Be alg nt hic ae cn ida Be ria nt ns hic m Be oll us nt hic ks Be cru nt sta hic ce inv a er t. (o t he Ph r) yto pla nk to Zo n op l a La nk rv to al n bo ny fis No he ns bo ny fis he s Bo ny fis he s Al lt ax a
10th percentile
Tropical
Temperate Region
Wheat
Soy
Rice
Maize
Crop type
Figure SPM.2 | Widespread impacts in a changing world. (A) Global patterns of impacts in recent decades attributed to climate change, based on studies since the AR4. Impacts are shown at a range of geographic scales. Symbols indicate categories of attributed impacts, the relative contribution of climate change (major or minor) to the observed impact, and confidence in attribution. See supplementary Table SPM.A1 for descriptions of the impacts. (B) Average rates of change in distribution (km per decade) for marine taxonomic groups based on observations over 1900–2010. Positive distribution changes are consistent with warming (moving into previously cooler waters, generally poleward). The number of responses analyzed is given within parentheses for each category. (C) Summary of estimated impacts of observed climate changes on yields over 1960–2013 for four major crops in temperate and tropical regions, with the number of data points analyzed given within parentheses for each category. [Figures 7-2, 18-3, and MB-2]
7
Summary for Policymakers
yields, or destruction of homes and indirectly through, for example, increased food prices and food insecurity. Observed positive effects for poor and marginalized people, which are limited and often indirect, include examples such as diversification of social networks and of agricultural practices.15 SPM
Violent conflict increases vulnerability to climate change (medium evidence, high agreement). Large-scale violent conflict harms assets that facilitate adaptation, including infrastructure, institutions, natural resources, social capital, and livelihood opportunities.16
A-2. Adaptation Experience Throughout history, people and societies have adjusted to and coped with climate, climate variability, and extremes, with varying degrees of success. This section focuses on adaptive human responses to observed and projected climate-change impacts, which can also address broader risk-reduction and development objectives. Adaptation is becoming embedded in some planning processes, with more limited implementation of responses (high confidence). Engineered and technological options are commonly implemented adaptive responses, often integrated within existing programs such as disaster risk management and water management. There is increasing recognition of the value of social, institutional, and ecosystem-based measures and of the extent of constraints to adaptation. Adaptation options adopted to date continue to emphasize incremental adjustments and cobenefits and are starting to emphasize flexibility and learning (medium evidence, medium agreement). Most assessments of adaptation have been restricted to impacts, vulnerability, and adaptation planning, with very few assessing the processes of implementation or the effects of adaptation actions (medium evidence, high agreement).17 Adaptation experience is accumulating across regions in the public and private sector and within communities (high confidence). Governments at various levels are starting to develop adaptation plans and policies and to integrate climate-change considerations into broader development plans. Examples of adaptation across regions include the following: •
In Africa, most national governments are initiating governance systems for adaptation. Disaster risk management, adjustments in technologies and infrastructure, ecosystem-based approaches, basic public health measures, and livelihood diversification are reducing vulnerability, although efforts to date tend to be isolated.18
•
In Europe, adaptation policy has been developed across all levels of government, with some adaptation planning integrated into coastal and water management, into environmental protection and land planning, and into disaster risk management.19
•
In Asia, adaptation is being facilitated in some areas through mainstreaming climate adaptation action into subnational development planning, early warning systems, integrated water resources management, agroforestry, and coastal reforestation of mangroves.20
•
In Australasia, planning for sea level rise, and in southern Australia for reduced water availability, is becoming adopted widely. Planning for sea level rise has evolved considerably over the past 2 decades and shows a diversity of approaches, although its implementation remains piecemeal.21
•
In North America, governments are engaging in incremental adaptation assessment and planning, particularly at the municipal level. Some proactive adaptation is occurring to protect longer-term investments in energy and public infrastructure.22
•
In Central and South America, ecosystem-based adaptation including protected areas, conservation agreements, and community management of natural areas is occurring. Resilient crop varieties, climate forecasts, and integrated water resources management are being adopted within the agricultural sector in some areas.23
15 16 17 18 19 20 21 22 23
8
8.2-3, 9.3, 11.3, 13.1-3, 22.3, 24.4, 26.8 12.5, 19.2, 19.6 4.4, 5.5, 6.4, 8.3, 9.4, 11.7, 14.1, 14.3-4, 15.2-5, 17.2-3, 21.3, 21.5, 22.4, 23.7, 25.4, 26.8-9, 30.6, Boxes 25-1, 25-2, 25-9, and CC-EA 22.4 23.7, Boxes 5-1 and 23-3 24.4-6, 24.9 Box CC-TC 25.4, 25.10, Table 25-2, Boxes 25-1, 25-2, and 25-9 26.7-9 27.3
Summary for Policymakers
•
In the Arctic, some communities have begun to deploy adaptive co-management strategies and communications infrastructure, combining traditional and scientific knowledge.24
•
In small islands, which have diverse physical and human attributes, community-based adaptation has been shown to generate larger benefits when delivered in conjunction with other development activities.25
•
In the ocean, international cooperation and marine spatial planning are starting to facilitate adaptation to climate change, with constraints from challenges of spatial scale and governance issues.26
A-3. The Decision-making Context Climate variability and extremes have long been important in many decision-making contexts. Climate-related risks are now evolving over time due to both climate change and development. This section builds from existing experience with decision making and risk management. It creates a foundation for understanding the report’s assessment of future climate-related risks and potential responses. Responding to climate-related risks involves decision making in a changing world, with continuing uncertainty about the severity and timing of climate-change impacts and with limits to the effectiveness of adaptation (high confidence). Iterative risk management is a useful framework for decision making in complex situations characterized by large potential consequences, persistent uncertainties, long timeframes, potential for learning, and multiple climatic and non-climatic influences changing over time. See Figure SPM.3. Assessment of the widest possible range of potential impacts, including low-probability outcomes with large consequences, is central to understanding the benefits and trade-offs of alternative risk management actions. The complexity of adaptation actions across scales and contexts means that monitoring and learning are important components of effective adaptation.27 Adaptation and mitigation choices in the near term will affect the risks of climate change throughout the 21st century (high confidence). Figure SPM.4 illustrates projected warming under a low-emission mitigation scenario and a high-emission scenario [Representative Concentration Pathways (RCPs) 2.6 and 8.5], along with observed temperature changes. The benefits of adaptation and mitigation occur over different but overlapping timeframes. Projected global temperature increase over the next few decades is similar across emission scenarios (Figure SPM.4B).28 During this near-term period, risks will evolve as socioeconomic trends interact with the changing climate. Societal
Scoping Scop ping g Identify risks, vulnerabilities, & objectives
Establish decisionmaking criteria
Implementation
Analysis Identify options
Review & learn
Implement decision Evaluate tradeoffs
Monitor
24 25 26 27 28
Assess risks
Figure SPM.3 | Climate-change adaptation as an iterative risk management process with multiple feedbacks. People and knowledge shape the process and its outcomes. [Figure 2-1]
28.2, 28.4 29.3, 29.6, Table 29-3, Figure 29-1 30.6 2.1-4, 3.6, 14.1-3, 15.2-4, 16.2-4, 17.1-3, 17.5, 20.6, 22.4, 25.4, Figure 1-5 WGI AR5 11.3
9
SPM
Summary for Policymakers
(A)
Observed Temperature Change –0.5
0
2
4
6
11.7
Based on trend over 1901–2012 (˚C over period)
Solid Color
Significant trend
White
Insufficient data
Diagonal Lines
Trend not statistically significant
(B)
( ˚ C relative to 1986–2005)
Global mean temperature change
SPM
6
4
Observed RCP8.5
2
Overlap RCP2.6
0
–2 1900
1950
2000
2050
2100
(C)
Projected Temperature Change
Difference from 1986–2005 mean ( ˚ C)
–0.5
0
2
4
6
11.7
RCP2.6 2081–2100
Solid Color Gray
Very strong agreement Divergent changes
Strong agreement Little or Diagonal Lines no change White Dots
RCP8.5 2081–2100
Figure SPM.4 | Observed and projected changes in annual average surface temperature. This figure informs understanding of climate-related risks in the WGII AR5. It illustrates temperature change observed to date and projected warming under continued high emissions and under ambitious mitigation.
10
Summary for Policymakers
Figure SPM.4 Technical Details (A) Map of observed annual average temperature change from 1901–2012, derived from a linear trend where sufficient data permit a robust estimate; other areas are white. Solid colors indicate areas where trends are significant at the 10% level. Diagonal lines indicate areas where trends are not significant. Observed data (range of grid-point values: –0.53 to 2.50°C over period) are from WGI AR5 Figures SPM.1 and 2.21. (B) Observed and projected future global annual average temperature relative to 1986–2005. Observed warming from 1850–1900 to 1986–2005 is 0.61°C (5–95% confidence interval: 0.55 to 0.67°C). Black lines show temperature estimates from three datasets. Blue and red lines and shading denote the ensemble mean and ±1.64 standard deviation range, based on CMIP5 simulations from 32 models for RCP2.6 and 39 models for RCP8.5. (C) CMIP5 multi-model mean projections of annual average temperature changes for 2081–2100 under RCP2.6 and 8.5, relative to 1986–2005. Solid colors indicate areas with very strong agreement, where the multi-model mean change is greater than twice the baseline variability (natural internal variability in 20-yr means) and ≥90% of models agree on sign of change. Colors with white dots indicate areas with strong agreement, where ≥66% of models show change greater than the baseline variability and ≥66% of models agree on sign of change. Gray indicates areas with divergent changes, where ≥66% of models show change greater than the baseline variability, but 50–100% probability
About as likely as not
33–66% probability
Unlikely
0–33% probability
Very unlikely
0–10% probability
Extremely unlikely
0–5% probability
Exceptionally unlikely
0–1% probability
Where appropriate, findings are also formulated as statements of fact without using uncertainty qualifiers. Within paragraphs of this summary, the confidence, evidence, and agreement terms given for a key finding apply to subsequent statements in the paragraph, unless additional terms are provided. [1.1, Box 1-1] 41
Technical Summary
TS
illustrate impacts of extreme weather and climate events experienced across regional contexts: • In Africa, extreme weather and climate events including droughts and floods have significant impacts on economic sectors, natural resources, ecosystems, livelihoods, and human health. The floods of the Zambezi River in Mozambique in 2008, for example, displaced 90,000 people, and along the Zambezi River Valley, with approximately 1 million people living in the flood-affected areas, temporary displacement is taking on permanent characteristics. [22.3, 22.4, 22.6] • Recent floods in Australia and New Zealand caused severe damage to infrastructure and settlements and 35 deaths in Queensland alone (2011). The Victorian heat wave (2009) increased heat-related morbidity and was associated with more than 300 excess deaths, while intense bushfires destroyed more than 2000 buildings and led to 173 deaths. Widespread drought in southeast Australia (1997–2009) and many parts of New Zealand (2007–2009; 2012–2013) resulted in economic losses (e.g., regional GDP in the southern Murray-Darling Basin was below forecast by about 5.7% in 2007–2008, and New Zealand lost about NZ$3.6 billion in
(A)
•
•
•
direct and off-farm output in 2007–2009). [13.2, 25.6, 25.8, Table 25-1, Boxes 25-5, 25-6, and 25-8] In Europe, extreme weather events currently have significant impacts in multiple economic sectors as well as adverse social and health effects (high confidence). [Table 23-1] In North America, most economic sectors and human systems have been affected by and have responded to extreme weather, including hurricanes, flooding, and intense rainfall (high confidence). Extreme heat events currently result in increases in mortality and morbidity (very high confidence), with impacts that vary by age, location, and socioeconomic factors (high confidence). Extreme coastal storm events have caused excess mortality and morbidity, particularly along the east coast of the United States, and the gulf coast of both Mexico and the United States. Much North American infrastructure is currently vulnerable to extreme weather events (medium confidence), with deteriorating water-resource and transportation infrastructure particularly vulnerable (high confidence). [26.6, 26.7, Figure 26-2] In the Arctic, extreme weather events have had direct and indirect adverse health effects for residents (high confidence). [28.2]
ARCTIC
EUROPE NORTH AMERICA ASIA
SMALL ISLANDS
AFRICA CENTRAL & SOUTH AMERICA
AUSTRALASIA ANTARCTIC
Confidence in attribution to climate change
very low
low
med high
very high
indicates confidence range
Figure TS.2
42
Observed impacts attributed to climate change for Physical systems Glaciers, snow, ice, and/or permafrost
Biological systems
Human and managed systems
Terrestrial ecosystems
Food production
Rivers, lakes, floods, and/or drought
Wildfire
Livelihoods, health, and/or economics
Coastal erosion and/or sea level effects
Marine ecosystems
Regional-scale impacts
Outlined symbols = Minor contribution of climate change Filled symbols = Major contribution of climate change
Continued next page
Technical Summary
Figure TS.2 (continued) (C)
Glacier mass-budget rate (water-equivalent meters per decade)
(B)
4
0
–4
–8
TS
–12
Himalaya-wide measurement
Areas with forest cover Other areas with tree cover Areas without tree cover
Himalaya local measurements Average of local measurements
–16
Locations of substantial drought- and heat-induced tree mortality since 1970
Global average (excluding Greenland, Antarctica) –20
1960
1970
1980
1990
2000
2010
(3) Standard error Mean
400
Standard error
(13) 100 (20) (90) 20
(29)
(9)
(111)
(359)
(46) (29) (9)
Yield impact (% change per decade)
(E) Cooler
Distribution change (km per decade)
(D)
2 (19)
(27)
(18)
Be nt hic Be alg nt hic ae cn ida Be ria nt ns hic m Be oll us nt hic ks Be cru nt sta hic ce inv a er t. (o t h Ph er yto ) pla nk to Zo n op l a La nk rv to al n bo ny fis No he ns bo ny fis he s Bo ny fis he s Al lt ax a
(13)
(12)
0
–2
−4 90th percentile 75th percentile
Warmer
0 –20
(10)
Median
−6
25th percentile 10th percentile
Tropical
Temperate Region
Wheat
Soy
Rice
Maize
Crop type
Figure TS.2 | Widespread impacts in a changing world. (A) Global patterns of impacts in recent decades attributed to climate change, based on studies since the AR4. Impacts are shown at a range of geographic scales. Symbols indicate categories of attributed impacts, the relative contribution of climate change (major or minor) to the observed impact, and confidence in attribution. See Table TS.1 for descriptions of the impacts. (B) Changes in glacier mass from all published measurements for Himalayan glaciers. Negative values indicate loss of glacier mass. Local measurements are mostly for small, accessible Himalayan glaciers. The blue box for each local Himalaya measurement is centered vertically on its average, and has a height of ±1 standard deviation for annual measurements and a height of ±1 standard error for multiannual measurements. Himalaya-wide measurement (red) was made by satellite laser altimetry. For reference, global average glacier mass change estimates from WGI AR5 4.3 are also shown, with shading indicating ±1 standard deviation. (C) Locations of substantial drought- and heat-induced tree mortality around the globe over 1970–2011. (D) Average rates of change in distribution (km per decade) for marine taxonomic groups based on observations over 1900–2010. Positive distribution changes are consistent with warming (moving into previously cooler waters, generally poleward). The number of responses analyzed is given within parentheses for each category. (E) Summary of estimated impacts of observed climate changes on yields over 1960–2013 for four major crops in temperate and tropical regions, with the number of data points analyzed given within parentheses for each category. [Figures 3-3, 4-7, 7-2, 18-3, and MB-2]
43
Technical Summary
TS
Freshwater Resources
Terrestrial and Freshwater Ecosystems
In many regions, changing precipitation or melting snow and ice are altering hydrological systems, affecting water resources in terms of quantity and quality (medium confidence). Glaciers continue to shrink almost worldwide due to climate change (high confidence) (e.g., Figure TS.2B), affecting runoff and water resources downstream (medium confidence). Climate change is causing permafrost warming and thawing in high-latitude regions and in high-elevation regions (high confidence). There is no evidence that surface water and groundwater drought frequency has changed over the last few decades, although impacts of drought have increased mostly due to increased water demand. [3.2, 4.3, 18.3, 18.5, 24.4, 25.5, 26.2, 28.2, Tables 3-1 and 25-1, Figures 18-2 and 26-1]
Many terrestrial and freshwater plant and animal species have shifted their geographic ranges and seasonal activities and altered their abundance in response to observed climate change over recent decades, and they are doing so now in many regions (high confidence). Increased tree mortality, observed in many places worldwide, has been attributed to climate change in some regions (Figure TS.2C). Increases in the frequency or intensity of ecosystem disturbances such as droughts, wind storms, fires, and pest outbreaks have been detected in many parts of the world and in some cases are attributed to climate change (medium confidence). While recent climate change contributed to the extinction of some species of Central American amphibians (medium confidence), most recent observed terrestrial
Table TS.1 | Observed impacts attributed to climate change reported in the scientific literature since the AR4. These impacts have been attributed to climate change with very low, low, medium, or high confidence, with the relative contribution of climate change to the observed change indicated (major or minor), for natural and human systems across eight major world regions over the past several decades. [Tables 18-5 to 18-9] Absence from the table of additional impacts attributed to climate change does not imply that such impacts have not occurred. Africa Snow & Ice, Rivers & Lakes, Floods & Drought
• Retreat of tropical highland glaciers in East Africa ( high confidence, major contribution from climate change) • Reduced discharge in West African rivers ( low confidence, major contribution from climate change) • Lake surface warming and water column stratification increases in the Great Lakes and Lake Kariba ( high confidence, major contribution from climate change) • Increased soil moisture drought in the Sahel since 1970, partially wetter conditions since 1990 ( medium confidence, major contribution from climate change) [22.2, 22.3, Tables 18-5, 18-6, and 22-3]
Terrestrial Ecosystems
• Tree density decreases in western Sahel and semi-arid Morocco, beyond changes due to land use ( medium confidence, major contribution from climate change) • Range shifts of several southern plants and animals, beyond changes due to land use ( medium confidence, major contribution from climate change) • Increases in wildfires on Mt. Kilimanjaro ( low confidence, major contribution from climate change) [22.3, Tables 18-7 and 22-3]
Coastal Erosion & Marine Ecosystems
• Decline in coral reefs in tropical African waters, beyond decline due to human impacts ( high confidence, major contribution from climate change) [Table 18-8]
Food Production & Livelihoods
• Adaptive responses to changing rainfall by South African farmers, beyond changes due to economic conditions ( very low confidence, major contribution from climate change) • Decline in fruit-bearing trees in Sahel ( low confidence, major contribution from climate change) • Malaria increases in Kenyan highlands, beyond changes due to vaccination, drug resistance, demography, and livelihoods ( low confidence, minor contribution from climate change) • Reduced fisheries productivity of Great Lakes and Lake Kariba, beyond changes due to fisheries management and land use ( low confidence, minor contribution from climate change) [7.2, 11.5, 13.2, 22.3, Table 18-9]
Europe • Retreat of Alpine, Scandinavian, and Icelandic glaciers ( high confidence, major contribution from climate change) Snow & Ice, • Increase in rock slope failures in western Alps ( medium confidence, major contribution from climate change) Rivers & Lakes, Floods & Drought • Changed occurrence of extreme river discharges and floods ( very low confidence, minor contribution from climate change) [18.3, 23.2, 23.3, Tables 18-5 and 18-6; WGI AR5 4.3]
Terrestrial Ecosystems
• Earlier greening, leaf emergence, and fruiting in temperate and boreal trees ( high confidence, major contribution from climate change) • Increased colonization of alien plant species in Europe, beyond a baseline of some invasion ( medium confidence, major contribution from climate change) • Earlier arrival of migratory birds in Europe since 1970 ( medium confidence, major contribution from climate change) • Upward shift in tree-line in Europe, beyond changes due to land use ( low confidence, major contribution from climate change) • Increasing burnt forest areas during recent decades in Portugal and Greece, beyond some increase due to land use ( high confidence, major contribution from climate change) [4.3, 18.3, Tables 18-7 and 23-6]
Coastal Erosion & Marine Ecosystems
• Northward distributional shifts of zooplankton, fishes, seabirds, and benthic invertebrates in northeast Atlantic ( high confidence, major contribution from climate change) • Northward and depth shift in distribution of many fish species across European seas ( medium confidence, major contribution from climate change) • Plankton phenology changes in northeast Atlantic ( medium confidence, major contribution from climate change) • Spread of warm water species into the Mediterranean, beyond changes due to invasive species and human impacts ( medium confidence, major contribution from climate change) [6.3, 23.6, 30.5, Tables 6-2 and 18-8, Boxes 6-1 and CC-MB]
Food Production & Livelihoods
• Shift from cold-related mortality to heat-related mortality in England and Wales, beyond changes due to exposure and health care ( low confidence, major contribution from climate change) • Impacts on livelihoods of Sámi people in northern Europe, beyond effects of economic and sociopolitical changes ( medium confidence, major contribution from climate change) • Stagnation of wheat yields in some countries in recent decades, despite improved technology ( medium confidence, minor contribution from climate change) • Positive yield impacts for some crops mainly in northern Europe, beyond increase due to improved technology ( medium confidence, minor contribution from climate change) • Spread of bluetongue virus in sheep and of ticks across parts of Europe ( medium confidence, minor contribution from climate change) [18.4, 23.4, 23.5, Table 18-9, Figure 7-2]
Continued next page
44
Technical Summary
Table TS.1 (continued) Asia • Permafrost degradation in Siberia, Central Asia, and Tibetan Plateau ( high confidence, major contribution from climate change) Snow & Ice, • Shrinking mountain glaciers across most of Asia ( medium confidence, major contribution from climate change) Rivers & Lakes, Floods & Drought • Changed water availability in many Chinese rivers, beyond changes due to land use ( low confidence, minor contribution from climate change) • Increased flow in several rivers due to shrinking glaciers ( high confidence, major contribution from climate change) • Earlier timing of maximum spring flood in Russian rivers ( medium confidence, major contribution from climate change) • Reduced soil moisture in north-central and northeast China (1950 – 2006) ( medium confidence, major contribution from climate change) • Surface water degradation in parts of Asia, beyond changes due to land use ( medium confidence, minor contribution from climate change) [24.3, 24.4, 28.2, Tables 18-5, 18-6, and SM24-4, Box 3-1; WGI AR5 4.3, 10.5]
Terrestrial Ecosystems
• Changes in plant phenology and growth in many parts of Asia (earlier greening), particularly in the north and east ( medium confidence, major contribution from climate change) • Distribution shifts of many plant and animal species upwards in elevation or polewards, particularly in the north of Asia ( medium confidence, major contribution from climate change) • Invasion of Siberian larch forests by pine and spruce during recent decades ( low confidence, major contribution from climate change) • Advance of shrubs into the Siberian tundra ( high confidence, major contribution from climate change) [4.3, 24.4, 28.2, Table 18-7, Figure 4-4]
Coastal Erosion & Marine Ecosystems
• Decline in coral reefs in tropical Asian waters, beyond decline due to human impacts ( high confidence, major contribution from climate change) • Northward range extension of corals in the East China Sea and western Pacific, and of a predatory fish in the Sea of Japan ( medium confidence, major contribution from climate change) • Shift from sardines to anchovies in the western North Pacific, beyond fluctuations due to fisheries ( low confidence, major contribution from climate change) • Increased coastal erosion in Arctic Asia ( low confidence, major contribution from climate change) [6.3, 24.4, 30.5, Tables 6-2 and 18-8]
Food Production & Livelihoods
• Impacts on livelihoods of indigenous groups in Arctic Russia, beyond economic and sociopolitical changes ( low confidence, major contribution from climate change) • Negative impacts on aggregate wheat yields in South Asia, beyond increase due to improved technology ( medium confidence, minor contribution from climate change) • Negative impacts on aggregate wheat and maize yields in China, beyond increase due to improved technology ( low confidence, minor contribution from climate change) • Increases in a water-borne disease in Israel ( low confidence, minor contribution from climate change) [7.2, 13.2, 18.4, 28.2, Tables 18-4 and 18-9, Figure 7-2]
TS
Australasia • Significant decline in late-season snow depth at 3 of 4 alpine sites in Australia (1957– 2002) ( medium confidence, major contribution from climate change) Snow & Ice, • Substantial reduction in ice and glacier ice volume in New Zealand ( medium confidence, major contribution from climate change) Rivers & Lakes, Floods & Drought • Intensification of hydrological drought due to regional warming in southeast Australia ( low confidence, minor contribution from climate change) • Reduced inflow in river systems in southwestern Australia (since the mid-1970s) ( high confidence, major contribution from climate change) [25.5, Tables 18-5, 18-6, and 25-1; WGI AR5 4.3]
Terrestrial Ecosystems
• Changes in genetics, growth, distribution, and phenology of many species, in particular birds, butterflies, and plants in Australia, beyond fluctuations due to variable local climates, land use, pollution, and invasive species ( high confidence, major contribution from climate change) • Expansion of some wetlands and contraction of adjacent woodlands in southeast Australia ( low confidence, major contribution from climate change) • Expansion of monsoon rainforest at expense of savannah and grasslands in northern Australia ( medium confidence, major contribution from climate change) • Migration of glass eels advanced by several weeks in Waikato River, New Zealand ( low confidence, major contribution from climate change) [Tables 18-7 and 25-3]
Coastal Erosion & Marine Ecosystems
• Southward shifts in the distribution of marine species near Australia, beyond changes due to short-term environmental fluctuations, fishing, and pollution ( medium confidence, major contribution from climate change) • Change in timing of migration of seabirds in Australia ( low confidence, major contribution from climate change) • Increased coral bleaching in Great Barrier Reef and western Australian reefs, beyond effects from pollution and physical disturbance ( high confidence, major contribution from climate change) • Changed coral disease patterns at Great Barrier Reef, beyond effects from pollution ( medium confidence, major contribution from climate change) [6.3, 25.6, Tables 18-8 and 25-3]
Food Production & Livelihoods
• Advanced timing of wine-grape maturation in recent decades, beyond advance due to improved management ( medium confidence, major contribution from climate change) • Shift in winter vs. summer human mortality in Australia, beyond changes due to exposure and health care ( low confidence, major contribution from climate change) • Relocation or diversification of agricultural activities in Australia, beyond changes due to policy, markets, and short-term climate variability ( low confidence, minor contribution from climate change) [11.4, 18.4, 25.7, 25.8, Tables 18-9 and 25-3, Box 25-5]
Snow & Ice, Rivers & Lakes, Floods & Drought
• Shrinkage of glaciers across western and northern North America ( high confidence, major contribution from climate change) • Decreasing amount of water in spring snowpack in western North America (1960 – 2002) ( high confidence, major contribution from climate change) • Shift to earlier peak flow in snow dominated rivers in western North America ( high confidence, major contribution from climate change) • Increased runoff in the midwestern and northeastern US ( medium confidence, minor contribution from climate change) [Tables 18-5 and 18-6; WGI AR5 2.6, 4.3]
Terrestrial Ecosystems
• Phenology changes and species distribution shifts upward in elevation and northward across multiple taxa (medium confidence, major contribution from climate change) • Increased wildfire frequency in subarctic conifer forests and tundra ( medium confidence, major contribution from climate change) • Regional increases in tree mortality and insect infestations in forests ( low confidence, minor contribution from climate change) • Increase in wildfire activity, fire frequency and duration, and burnt area in forests of the western US and boreal forests in Canada, beyond changes due to land use and fire management ( medium confidence, minor contribution from climate change) [26.4, 28.2, Table 18-7, Box 26-2]
Coastal Erosion & Marine Ecosystems
• Northward distributional shifts of northwest Atlantic fish species ( high confidence, major contribution from climate change) • Changes in musselbeds along the west coast of US ( high confidence, major contribution from climate change) • Changed migration and survival of salmon in northeast Pacific ( high confidence, major contribution from climate change) • Increased coastal erosion in Alaska and Canada ( medium confidence, major contribution from climate change) [18.3, 30.5, Tables 6-2 and 18-8]
Food Production & Livelihoods
• Impacts on livelihoods of indigenous groups in the Canadian Arctic, beyond effects of economic and sociopolitical changes ( medium confidence, major contribution from climate change) [18.4, 28.2, Tables 18-4 and 18-9]
North America
Continued next page
45
Technical Summary
Table TS.1 (continued) Central and South America • Shrinkage of Andean glaciers ( high confidence, major contribution from climate change) Snow & Ice, • Changes in extreme flows in Amazon River ( medium confidence, major contribution from climate change) Rivers & Lakes, Floods & Drought • Changing discharge patterns in rivers in the western Andes ( medium confidence, major contribution from climate change) • Increased streamflow in sub-basins of the La Plata River, beyond increase due to land-use change ( high confidence, major contribution from climate change) [27.3, Tables 18-5, 18-6, and 27-3; WGI AR5 4.3]
Terrestrial Ecosystems
• Increased tree mortality and forest fire in the Amazon ( low confidence, minor contribution from climate change) • Rainforest degradation and recession in the Amazon, beyond reference trends in deforestation and land degradation ( low confidence, minor contribution from climate change) [4.3, 18.3, 27.2, 27.3, Table 18-7]
Coastal Erosion & Marine Ecosystems
• Increased coral bleaching in western Caribbean, beyond effects from pollution and physical disturbance ( high confidence, major contribution from climate change) • Mangrove degradation on north coast of South America, beyond degradation due to pollution and land use ( low confidence, minor contribution from climate change) [27.3, Table 18-8]
Food Production & Livelihoods
• More vulnerable livelihood trajectories for indigenous Aymara farmers in Bolivia due to water shortage, beyond effects of increasing social and economic stress ( medium confidence, major contribution from climate change) • Increase in agricultural yields and expansion of agricultural areas in southeastern South America, beyond increase due to improved technology ( medium confidence, major contribution from climate change) [13.1, 27.3, Table 18-9]
TS
Polar Regions • Decreasing Arctic sea ice cover in summer ( high confidence, major contribution from climate change) Snow & Ice, • Reduction in ice volume in Arctic glaciers ( high confidence, major contribution from climate change) Rivers & Lakes, Floods & Drought • Decreasing snow cover extent across the Arctic ( medium confidence, major contribution from climate change) • Widespread permafrost degradation, especially in the southern Arctic ( high confidence, major contribution from climate change) • Ice mass loss along coastal Antarctica ( medium confidence, major contribution from climate change) • Increased river discharge for large circumpolar rivers (1997–2007) ( low confidence, major contribution from climate change) • Increased winter minimum river flow in most of the Arctic ( medium confidence, major contribution from climate change) • Increased lake water temperatures 1985–2009 and prolonged ice-free seasons ( medium confidence, major contribution from climate change) • Disappearance of thermokarst lakes due to permafrost degradation in the low Arctic. New lakes created in areas of formerly frozen peat ( high confidence, major contribution from climate change) [28.2, Tables 18-5 and 18-6; WGI AR5 4.2 to 4.4, 4.6, 10.5]
Terrestrial Ecosystems
• Increased shrub cover in tundra in North America and Eurasia ( high confidence, major contribution from climate change) • Advance of Arctic tree-line in latitude and altitude ( medium confidence, major contribution from climate change) • Changed breeding area and population size of subarctic birds, due to snowbed reduction and/or tundra shrub encroachment ( medium confidence, major contribution from climate change) • Loss of snow-bed ecosystems and tussock tundra ( high confidence, major contribution from climate change) • Impacts on tundra animals from increased ice layers in snow pack, following rain-on-snow events ( medium confidence, major contribution from climate change) • Increased plant species ranges in the West Antarctic Peninsula and nearby islands over the past 50 years ( high confidence, major contribution from climate change) • Increased phytoplankton productivity in Signy Island lake waters ( high confidence, major contribution from climate change) [28.2, Table 18-7]
Coastal Erosion & Marine Ecosystems
• Increased coastal erosion across Arctic ( medium confidence, major contribution from climate change) • Negative effects on non-migratory Arctic species ( high confidence, major contribution from climate change) • Decreased reproductive success in Arctic seabirds ( medium confidence, major contribution from climate change) • Decline in Southern Ocean seals and seabirds ( medium confidence, major contribution from climate change) • Reduced thickness of foraminiferal shells in southern oceans, due to ocean acidification ( medium confidence, major contribution from climate change) • Reduced krill density in Scotia Sea ( medium confidence, major contribution from climate change) [6.3, 18.3, 28.2, 28.3, Table 18-8]
Food Production & Livelihoods
• Impact on livelihoods of Arctic indigenous peoples, beyond effects of economic and sociopolitical changes ( medium confidence, major contribution from climate change) • Increased shipping traffic across the Bering Strait ( medium confidence, major contribution from climate change) [18.4, 28.2, Tables 18-4 and 18-9, Figure 28-4]
Small Islands • Increased water scarcity in Jamaica, beyond increase due to water use ( very low confidence, minor contribution from climate change) Snow & Ice, [Table 18-6] Rivers & Lakes, Floods & Drought
Terrestrial Ecosystems
• Tropical bird population changes in Mauritius ( medium confidence, major contribution from climate change) • Decline of an endemic plant in Hawai’i ( medium confidence, major contribution from climate change) • Upward trend in tree-lines and associated fauna on high-elevation islands ( low confidence, minor contribution from climate change) [29.3, Table 18-7]
Coastal Erosion & Marine Ecosystems
• Increased coral bleaching near many tropical small islands, beyond effects of degradation due to fishing and pollution ( high confidence, major contribution from climate change) • Degradation of mangroves, wetlands, and seagrass around small islands, beyond degradation due to other disturbances ( very low confidence, minor contribution from climate change) • Increased flooding and erosion, beyond erosion due to human activities, natural erosion, and accretion ( low confidence, minor contribution from climate change) • Degradation of groundwater and freshwater ecosystems due to saline intrusion, beyond degradation due to pollution and groundwater pumping ( low confidence, minor contribution from climate change) [29.3, Table 18-8]
Food Production & Livelihoods
• Increased degradation of coastal fisheries due to direct effects and effects of increased coral reef bleaching, beyond degradation due to overfishing and pollution ( low confidence, minor contribution from climate change) [18.3, 18.4, 29.3, 30.6, Table 18-9, Box CC-CR]
46
Technical Summary
species extinctions have not been attributed to climate change (high confidence). [4.2, 4.4, 18.3, 18.5, 22.3, 25.6, 26.4, 28.2, Figure 4-10, Boxes 4-2, 4-3, 4-4, and 25-3]
Coastal Systems and Low-lying Areas Coastal systems are particularly sensitive to changes in sea level and ocean temperature and to ocean acidification (very high confidence). Coral bleaching and species range shifts have been attributed to changes in ocean temperature. For many other coastal changes, the impacts of climate change are difficult to identify given other human-related drivers (e.g. land use change, coastal development, pollution) (robust evidence, high agreement). [5.3 to 5.5, 18.3, 25.6, 26.4, Box 25-3]
Marine Systems Warming has caused and will continue to cause shifts in the abundance, geographic distribution, migration patterns, and timing of seasonal activities of marine species (very high confidence), paralleled by reduction in maximum body sizes (medium confidence). This has resulted and will further result in changing interactions between species, including competition and predator-prey dynamics (high confidence). Numerous observations over the last decades in all ocean basins show global-scale changes including large-scale distribution shifts of species (very high confidence) and altered ecosystem composition (high confidence) on multi-decadal time scales, tracking climate trends. Many fishes, invertebrates, and phytoplankton have shifted their distribution and/or abundance poleward and/or to deeper, cooler waters (Figure TS.2D). Some warmwater corals and their reefs have responded to warming with species replacement, bleaching, and decreased coral cover causing habitat loss. Few field observations to date demonstrate biological responses attributable to anthropogenic ocean acidification, as in many places these responses are not yet outside their natural variability and may be influenced by confounding local or regional factors. See also Box TS.7. Natural global climate change at rates slower than current anthropogenic climate change caused significant ecosystem shifts, including species emergences and extinctions, during the past millions of years. [5.4, 6.1, 6.3 to 6.5, 18.3, 18.5, 22.3, 25.6, 26.4, 30.4, 30.5, Boxes 25-3, CC-OA, CC-CR, and CC-MB] Vulnerability of most marine organisms to warming is set by their physiology, which defines their limited temperature ranges and hence their thermal sensitivity (high confidence). See Figure TS.3. Temperature defines the geographic distribution of many species and their responses to climate change. Shifting temperature means and extremes alter habitat (e.g., sea ice and coastal habitat), and cause changes in species abundances through local extinctions and latitudinal distribution expansions or shifts of up to hundreds of kilometers per decade (very high confidence). Although genetic adaptation occurs (medium confidence), the capacity of fauna and flora to compensate for or keep up with the rate of ongoing thermal change is limited (low confidence). [6.3, 6.5, 30.5]
Oxygen minimum zones are progressively expanding in the tropical Pacific, Atlantic, and Indian Oceans, due to reduced ventilation and O2 solubilities in more stratified oceans at higher temperatures (high confidence). In combination with human activities that increase the productivity of coastal systems, hypoxic areas (“dead zones”) are increasing in number and size. Regional exacerbation of hypoxia causes shifts to hypoxia-tolerant biota and reduces habitat for commercially relevant species, with implications for fisheries. [6.1, 6.3, 30.3, 30.5, 30.6; WGI AR5 3.8]
Food Security and Food Production Systems Based on many studies covering a wide range of regions and crops, negative impacts of climate change on crop yields have been more common than positive impacts (high confidence). The smaller number of studies showing positive impacts relate mainly to high-latitude regions, though it is not yet clear whether the balance of impacts has been negative or positive in these regions. Climate change has negatively affected wheat and maize yields for many regions and in the global aggregate (medium confidence). Effects on rice and soybean yield have been smaller in major production regions and globally, with a median change of zero across all available data, which are fewer for soy compared to the other crops. Observed impacts relate mainly to production aspects of food security rather than access or other components of food security. See Figure TS.2E. Since AR4, several periods of rapid food and cereal price increases following climate extremes in key producing regions indicate a sensitivity of current markets to climate extremes among other factors (medium confidence). Crop yields have a large negative sensitivity to extreme daytime temperatures around 30°C, throughout the growing season (high confidence). CO2 has stimulatory effects on crop yields in most cases, and elevated tropospheric ozone has damaging effects. Interactions among CO2 and ozone, mean temperature, extremes, water, and nitrogen are non-linear and difficult to predict (medium confidence). [7.2, 7.3, 18.4, 22.3, 26.5, Figures 7-2, 7-3, and 7-7, Box 25-3]
Urban Areas Urban areas hold more than half the world’s population and most of its built assets and economic activities. A high proportion of the population and economic activities at risk from climate change are in urban areas, and a high proportion of global greenhouse gas emissions are generated by urban-based activities and residents. Cities are composed of complex inter-dependent systems that can be leveraged to support climate change adaptation via effective city governments supported by cooperative multilevel governance (medium confidence). This can enable synergies with infrastructure investment and maintenance, land use management, livelihood creation, and ecosystem services protection. [8.1, 8.3, 8.4] Rapid urbanization and growth of large cities in developing countries have been accompanied by expansion of highly vulnerable urban communities living in informal settlements, many of which are on land exposed to extreme weather (medium confidence). [8.2, 8.3] 47
TS
Technical Summary
(A) Thermal windows for animals: limits and acclimatization
(B) Spatial dynamics during progressive warming Seasonal temperature dynamics in high latitude North
Tc anaerobiosis
Td
Temperature-dependent time window
denaturation
Impact of photoperiod
Tc
Phenology shift South
Low
TS
loss of performance and abundance
Expansion
Low
Scope for aerobic performance
Tp
Latitudes (in °N)
High
Topt Tp
Contraction Dec
Jan Cold
Temperature range
Cold
Warm
Seasonal temperature dynamics in low latitude
Performance curve under normal conditions
Temperature range Warm threshold line acclimatization and adaptation
Performance curve options under elevated CO2 or in hypoxic water or both Topt Optimum temperature (performance maximum) Tp Pejus temperatures (limit to long-term tolerance) Tc Critical temperatures (transition to anaerobic metabolism) Td Denaturation temperatures (the onset of cell damage)
(C)
1958–1981
High
Dec
Jan
Species abundance Low
High
Spatial dynamics during progressive warming Expansion
Contraction
2003–2005
60°N
0.00
0.04
0.08
Mean number of warm-temperate pseudo-oceanic copepod species per assemblage 50°N
Figure TS.3 | Temperature specialization of species (A), which is influenced by other factors such as oxygen, causes warming-induced distribution shifts (B), for example, the northward expansion of warm-temperate species in the northeast Atlantic (C). These distribution changes depend on species-specific physiology and ecology. Detailed introduction of each panel follows: (A) The temperature tolerance range and performance levels of an organism are described by its performance curve. Each performance (e.g., exercise, growth, reproduction) is highest at optimum temperature (Topt) and lower at cooler or warmer temperatures. Surpassing temperature thresholds (Tp) means going into time-limited tolerance, and more extreme temperature changes lead to exceedance of thresholds that cause metabolic disturbances (Tc) and ultimately onset of cell damage (Td). These thresholds for an individual can shift (horizontal arrows), within limits, between summer and winter (seasonal acclimatization) or when the species adapts to a cooler or warmer climate over generations (evolutionary adaptation). Under elevated CO2 levels (ocean acidification) or low oxygen, thermal windows narrow (dashed gray curves). (B) During climate warming, a species follows its normal temperatures as it moves or is displaced, typically resulting in a poleward shift of the biogeographic range (exemplified for the Northern Hemisphere). The polygon delineates the distribution range in space and seasonal time; the level of gray denotes abundance. (C) Long-term changes in the mean number of warm-temperate pseudo-oceanic copepod species in the northeast Atlantic from 1958 to 2005. [Figures 6-5, 6-7, and 6-8]
Rural Areas Climate change in rural areas will take place in the context of many important economic, social, and land use trends (very high confidence). In different regions, absolute rural populations have peaked or will peak in the next few decades. The proportion of the rural
48
population depending on agriculture is varied across regions, but declining everywhere. Poverty rates in rural areas are higher than overall poverty rates, but also falling more sharply, and the proportions of population in extreme poverty accounted for by rural people are also falling: in both cases with the exception of sub-Saharan Africa, where these rates are rising. Accelerating globalization, through migration,
Technical Summary
labor linkages, regional and international trade, and new information and communication technologies, is bringing about economic transformation in rural areas of developing and developed countries. [9.3, Figure 9-2]
Human Health At present the worldwide burden of human ill-health from climate change is relatively small compared with effects of other stressors and is not well quantified. However, there has been increased heatrelated mortality and decreased cold-related mortality in some regions as a result of warming (medium confidence). Local changes in temperature and rainfall have altered the distribution of some waterborne illnesses and disease vectors (medium confidence). [11.4 to 11.6, 18.4, 25.8]
For rural households and communities, access to land and natural resources, flexible local institutions, knowledge and information, and livelihood strategies can contribute to resilience to climate change (high confidence). Especially in developing countries, rural people are subject to multiple non-climatic stressors, including underinvestment in agriculture, problems with land and natural resource policy, and processes of environmental degradation (very high confidence). In developed countries, there are important shifts toward multiple uses of rural areas, especially leisure uses, and new rural policies based on the collaboration of multiple stakeholders, the targeting of multiple sectors, and a change from subsidy-based to investment-based policy. [9.3, 22.4, Table 9-3]
The health of human populations is sensitive to shifts in weather patterns and other aspects of climate change (very high confidence). These effects occur directly, due to changes in temperature and precipitation and in the occurrence of heat waves, floods, droughts, and fires. Health may be damaged indirectly by climate change-related ecological disruptions, such as crop failures or shifting patterns of disease vectors, or by social responses to climate change, such as displacement of populations following prolonged drought. Variability in temperatures is a risk factor in its own right, over and above the influence of average temperatures on heat-related deaths. [11.4, 28.2]
Key Economic Sectors and Services Economic losses due to extreme weather events have increased globally, mostly due to increase in wealth and exposure, with a possible influence of climate change (low confidence in attribution to climate change). Flooding can have major economic costs, both in term of impacts (e.g., capital destruction, disruption) and adaptation (e.g., construction, defensive investment) (robust evidence, high agreement). Since the mid-20th century, socioeconomic losses from flooding have increased mainly due to greater exposure and vulnerability (high confidence). [3.2, 3.4, 10.3, 18.4, 23.2, 23.3, 26.7, Figure 26-2, Box 25-7]
Human Security Challenges for vulnerability reduction and adaptation actions are particularly high in regions that have shown severe difficulties in governance (high confidence). Violent conflict increases vulnerability to climate change (medium evidence, high agreement). Large-scale violent conflict harms assets that facilitate adaptation, including infrastructure, institutions, natural resources, social capital, and livelihood opportunities. [12.5, 19.2, 19.6]
Resilient
At risk
High
Socioeconomic development pathways
Climate change and climate change responses
Multidimensional vulnerability
Capacities and opportunities
Gender Class
Low
Identity markers and dimensions of inequality Intersecting dimensions of inequality
Privileged
Population
Marginalized
Ethnicity Age Race
Multidimensional vulnerability
(Dis)ability Box TS.4 Figure 1 | Multidimensional vulnerability driven by intersecting dimensions of inequality. Vulnerability increases when people’s capacities and opportunities to adapt to climate change and adjust to climate change responses are diminished. [Figure 13-5]
49
TS
Technical Summary
Box TS.4 | Multidimensional Inequality and Vulnerability to Climate Change People who are socially, economically, culturally, politically, institutionally, or otherwise marginalized in society are especially vulnerable to climate change and also to some adaptation and mitigation responses (medium evidence, high agreement). This heightened vulnerability is rarely due to a single cause. Rather, it is the product of intersecting social processes that result in inequalities in socioeconomic status and income, as well as in exposure. Such social processes include, for example, discrimination on the basis of gender, class, race/ethnicity, age, and (dis)ability. See Box TS.4 Figure 1 on previous page. Understanding differential capacities and opportunities of individuals, households, and communities requires knowledge of these intersecting social drivers, which may be context-specific and clustered in diverse ways (e.g., class and ethnicity in one case, gender and age in another). Few studies depict the full spectrum of these intersecting social processes and the ways in which they shape multidimensional vulnerability to climate change.
TS Examples of inequality-driven impacts and risks of climate change and climate change responses (medium evidence, high agreement): •
Privileged members of society can benefit from climate change impacts and response strategies, given their flexibility in mobilizing and accessing resources and positions of power, often to the detriment of others. [13.2, 13.3, 22.4, 26.8]
•
Differential impacts on men and women arise from distinct roles in society, the way these roles are enhanced or constrained by other dimensions of inequality, risk perceptions, and the nature of response to hazards. [8.2, 9.3, 11.3, 12.2, 13.2, 18.4, 19.6, 22.4, Box CC-GC]
•
Both male and female deaths are recorded after flooding, affected by socioeconomic disadvantage, occupation, and culturally imposed expectations to save lives. Although women are generally more sensitive to heat stress, more male workers are reported to have died largely as a result of responsibilities related to outdoor and indoor work. [11.3, 13.2, Box CC-GC]
•
Women often experience additional duties as laborers and caregivers as a result of extreme weather events and climate change, as well as responses (e.g., male outmigration), while facing more psychological and emotional distress, reduced food intake, adverse mental health outcomes due to displacement, and in some cases increasing incidences of domestic violence. [9.3, 9.4, 12.4, 13.2, Box CC-GC]
•
Children and the elderly are often at higher risk due to narrow mobility, susceptibility to infectious diseases, reduced caloric intake, and social isolation. While adults and older children are more severely affected by some climate-sensitive vector-borne diseases such as dengue, young children are more likely to die from or be severely compromised by diarrheal diseases and floods. The elderly face disproportional physical harm and death from heat stress, droughts, and wildfires. [8.2, 10.9, 11.1, 11.4, 11.5, 13.2, 22.4, 23.5, 26.6]
•
In most urban areas, low-income groups, including migrants, face large climate change risks because of poor-quality, insecure, and clustered housing, inadequate infrastructure, and lack of provision for health care, emergency services, flood exposure, and measures for disaster risk reduction. [8.1, 8.2, 8.4, 8.5, 12.4, 22.3, 26.8]
•
People disadvantaged by race or ethnicity, especially in developed countries, experience more harm from heat stress, often due
•
Livelihoods and lifestyles of indigenous peoples, pastoralists, and fisherfolk, often dependent on natural resources, are highly
to low economic status and poor health conditions, and displacement after extreme events. [11.3, 12.4, 13.2] sensitive to climate change and climate change policies, especially those that marginalize their knowledge, values, and activities. [9.3, 11.3, 12.3, 14.2, 22.4, 25.8, 26.8, 28.2] •
Disadvantaged groups without access to land and labor, including female-headed households, tend to benefit less from climate change response mechanisms (e.g., Clean Development Mechanism (CDM), Reduction of Emissions from Deforestation and Forest Degradation (REDD+), large-scale land acquisition for biofuels, and planned agricultural adaptation projects). [9.3, 12.2, 12.5, 13.3, 22.4, 22.6]
50
Technical Summary
Livelihoods and Poverty Climate-related hazards exacerbate other stressors, often with negative outcomes for livelihoods, especially for people living in poverty (high confidence). Climate-related hazards affect poor people’s lives directly through impacts on livelihoods, reductions in crop yields, or destruction of homes and indirectly through, for example, increased food prices and food insecurity. Urban and rural transient poor who face multiple deprivations can slide into chronic poverty as a result of extreme events, or a series of events, when unable to rebuild their eroded assets (limited evidence, high agreement). Observed positive effects for poor and marginalized people, which are limited and often indirect, include examples such as diversification of social networks and of agricultural practices. [8.2, 8.3, 9.3, 11.3, 13.1 to 13.3, 22.3, 24.4, 26.8] Livelihoods of indigenous peoples in the Arctic have been altered by climate change, through impacts on food security and traditional and cultural values (medium confidence). There is emerging evidence of climate change impacts on livelihoods of indigenous people in other regions. [18.4, Table 18-9, Box 18-5]
A-2. Adaptation Experience Throughout history, people and societies have adjusted to and coped with climate, climate variability, and extremes, with varying degrees of success. This section focuses on adaptive human responses to observed and projected climate-change impacts, which can also address broader risk-reduction and development objectives. Adaptation is becoming embedded in some planning processes, with more limited implementation of responses (high confidence). Engineered and technological options are commonly implemented adaptive responses, often integrated within existing programs such as disaster risk management and water management. There is increasing recognition of the value of social, institutional, and ecosystem-based measures and of the extent of constraints to adaptation. Adaptation options adopted to date continue to emphasize incremental adjustments and co-benefits and are starting to emphasize flexibility and learning (medium evidence, medium agreement). [4.4, 5.5, 6.4, 8.3, 9.4, 11.7, 14.1, 14.3, 15.2 to 15.5, 17.2, 17.3, 22.4, 23.7, 25.4, 25.10, 26.8, 26.9, 27.3, 30.6, Boxes 25-1, 25-2, 25-9, and CC-EA] Most assessments of adaptation have been restricted to impacts, vulnerability, and adaptation planning, with very few assessing the processes of implementation or the effects of adaptation actions (medium evidence, high agreement). Vulnerability indicators define, quantify, and weight aspects of vulnerability across regional units, but methods of constructing indices are subjective, often lack transparency, and can be difficult to interpret. There are conflicting views on the choice of adaptation metrics, given differing values placed on needs and outcomes, many of which cannot be captured in a comparable way by metrics. Indicators proving most useful for policy learning are those that track not just process and implementation, but also the extent to which targeted outcomes are occurring. Multi-metric evaluations including risk and uncertainty are increasingly used, an evolution from
a previous focus on cost-benefit analysis and identification of “best economic adaptations” (high confidence). Adaptation assessments best suited to delivering effective adaptation measures often include both top-down assessments of biophysical climate changes and bottom-up assessments of vulnerability targeted toward local solutions to globally derived risks and toward particular decisions. [4.4, 14.4, 14.5, 15.2, 15.3, 17.2, 17.3, 21.3, 21.5, 22.4, 25.4, 25.10, 26.8, 26.9, Box CC-EA] Adaptation experience is accumulating across regions in the public and private sector and within communities (high confidence). Governments at various levels are starting to develop adaptation plans and policies and to integrate climate-change considerations into broader development plans. Examples of adaptation across regions and contexts include the following: • Urban adaptation has emphasized city-based disaster risk management such as early warning systems and infrastructure investments; ecosystem-based adaptation and green roofs; enhanced storm and wastewater management; urban and peri-urban agriculture improving food security; enhanced social protection; and goodquality, affordable, and well-located housing (high confidence). [8.3, 8.4, 15.4, 26.8, Boxes 25-9, CC-UR, and CC-EA] • There is a growing body of literature on adaptation practices in both developed and developing country rural areas, including documentation of practical experience in agriculture, water, forestry, and biodiversity and, to a lesser extent, fisheries (very high confidence). Public policies supporting decision making for adaptation in rural areas exist in developed and, increasingly, developing countries, and there are also examples of private adaptations led by individuals, companies, and nongovernmental organizations (NGOs) (high confidence). Adaptation constraints, particularly pronounced in developing countries, result from lack of access to credit, land, water, technology, markets, information, and perceptions of the need to change. [9.4, 17.3, Tables 9-7 and 9-8] • In Africa, most national governments are initiating governance systems for adaptation (high confidence). Progress on national and subnational policies and strategies has initiated the mainstreaming of adaptation into sectoral planning, but evolving institutional frameworks cannot yet effectively coordinate the range of adaptation initiatives being implemented. Disaster risk management, adjustments in technologies and infrastructure, ecosystem-based approaches, basic public health measures, and livelihood diversification are reducing vulnerability, although efforts to date tend to be isolated. [22.4] • In Europe, adaptation policy has been developed at international (EU), national, and local government levels, with limited systematic information on current implementation or effectiveness (high confidence). Some adaptation planning has been integrated into coastal and water management, into environmental protection and land planning, and into disaster risk management. [23.7, Boxes 5-1 and 23-3] • In Asia, adaptation is being facilitated in some areas through mainstreaming climate adaptation action into subnational development planning, early warning systems, integrated water resources management, agroforestry, and coastal reforestation of mangroves (high confidence). [24.4 to 24.6, 24.9, Box CC-TC] • In Australasia, planning for sea level rise, and in southern Australia for reduced water availability, is becoming adopted widely. Planning 51
TS
Technical Summary
Table TS.2 | Illustrative examples of adaptation experience, as well as approaches to reducing vulnerability and enhancing resilience. Adaptation actions can be influenced by climate variability, extremes, and change, and by exposure and vulnerability at the scale of risk management. Many examples and case studies demonstrate complexity at the level of communities or specific regions within a country. It is at this spatial scale that complex interactions between vulnerability, exposure, and climate change come to the fore. [Table 21-4] Early warning systems for heat Exposure and vulnerability
Factors affecting exposure and vulnerability include age, preexisting health status, level of outdoor activity, socioeconomic factors including poverty and social isolation, access to and use of cooling, physiological and behavioral adaptation of the population, urban heat island effects, and urban infrastructure. [8.2.3, 8.2.4, 11.3.3, 11.3.4, 11.4.1, 11.7, 13.2.1, 19.3.2, 23.5.1, 25.3, 25.8.1, SREX Table SPM.1]
Climate information at the global scale
Observed: • Very likely decrease in the number of cold days and nights and increase in the number of warm days and nights, on the global scale between 1951 and 2010. [WGI AR5 2.6.1] • Medium confidence that the length and frequency of warm spells, including heat waves, has increased globally since 1950. [WGI AR5 2.6.1] Projected: Virtually certain that, in most places, there will be more hot and fewer cold temperature extremes as global mean temperatures increase, for events defined as extremes on both daily and seasonal time scales. [WGI AR5 12.4.3]
Climate information at the regional scale
TS
Observed: • Likely that heat wave frequency has increased since 1950 in large parts of Europe, Asia, and Australia. [WGI AR5 2.6.1] • Medium confidence in overall increase in heat waves and warm spells in North America since 1960. Insufficient evidence for assessment or spatially varying trends in heat waves or warm spells for South America and most of Africa. [SREX Table 3-2; WGI AR5 2.6.1] Projected: • Likely that, by the end of the 21st century under Representative Concentration Pathway 8.5 (RCP8.5) in most land regions, a current 20-year hightemperature event will at least double its frequency and in many regions occur every 2 years or annually, while a current 20-year low-temperature event will become exceedingly rare. [WGI AR5 12.4.3] • Very likely more frequent and/or longer heat waves or warm spells over most land areas. [WGI AR5 12.4.3]
Description
Heat-health early warning systems are instruments to prevent negative health impacts during heat waves. Weather forecasts are used to predict situations associated with increased mortality or morbidity. Components of effective heat wave and health warning systems include identifying weather situations that adversely affect human health, monitoring weather forecasts, communicating heat wave and prevention responses, targeting notifications to vulnerable populations, and evaluating and revising the system to increase effectiveness in a changing climate. Warning systems for heat waves have been planned and implemented broadly, for example in Europe, the United States, Asia, and Australia. [11.7.3, 24.4.6, 25.8.1, 26.6, Box 25-6]
Broader context
• Heat-health warning systems can be combined with other elements of a health protection plan, for example building capacity to support communities most at risk, supporting and funding health services, and distributing public health information. • In Africa, Asia, and elsewhere, early warning systems have been used to provide warning of and reduce a variety of risks related to famine and food insecurity; flooding and other weather-related hazards; exposure to air pollution from fire; and vector-borne and food-borne disease outbreaks. [7.5.1, 11.7, 15.4.2, 22.4.5, 24.4.6, 25.8.1, 26.6.3, Box 25-6]
Mangrove restoration to reduce flood risks and protect shorelines from storm surge Exposure and vulnerability
Loss of mangroves increases exposure of coastlines to storm surge, coastal erosion, saline intrusion, and tropical cyclones. Exposed infrastructure, livelihoods, and people are vulnerable to associated damage. Areas with development in the coastal zone, such as on small islands, can be particularly vulnerable. [5.4.3, 5.5.6, 29.7.2, Box CC-EA]
Climate information at the global scale
Observed: • Likely increase in the magnitude of extreme high sea level events since 1970, mostly explained by rising mean sea level. [WGI AR5 3.7.5] • Low confidence in long-term (centennial) changes in tropical cyclone activity, after accounting for past changes in observing capabilities. [WGI AR5 2.6.3] Projected: • Very likely significant increase in the occurrence of future sea level extremes by 2050 and 2100. [WGI AR5 13.7.2] • In the 21st century, likely that the global frequency of tropical cyclones will either decrease or remain essentially unchanged. Likely increase in both global mean tropical cyclone maximum wind speed and rainfall rates. [WGI AR5 14.6]
Climate information at the regional scale
Observed: Change in sea level relative to the land (relative sea level) can be significantly different from the global mean sea level change because of changes in the distribution of water in the ocean and vertical movement of the land. [WGI AR5 3.7.3] Projected: • Low confidence in region-specific projections of storminess and associated storm surges. [WGI AR5 13.7.2] • Projections of regional changes in sea level reach values of up to 30% above the global mean value in the Southern Ocean and around North America, and between 10% to 20% above the global mean value in equatorial regions. [WGI AR5 13.6.5] • More likely than not substantial increase in the frequency of the most intense tropical cyclones in the western North Pacific and North Atlantic. [WGI AR5 14.6]
Description
Mangrove restoration and rehabilitation has occurred in a number of locations (e.g., Vietnam, Djibouti, and Brazil) to reduce coastal flooding risks and protect shorelines from storm surge. Restored mangroves have been shown to attenuate wave height and thus reduce wave damage and erosion. They protect aquaculture industry from storm damage and reduce saltwater intrusion. [2.4.3, 5.5.4, 8.3.3, 22.4.5, 27.3.3]
Broader context
• Considered a low-regrets option benefiting sustainable development, livelihood improvement, and human well-being through improvements for food security and reduced risks from flooding, saline intrusion, wave damage, and erosion. Restoration and rehabilitation of mangroves, as well as of wetlands or deltas, is ecosystem-based adaptation that enhances ecosystem services. • Synergies with mitigation given that mangrove forests represent large stores of carbon. • Well-integrated ecosystem-based adaptation can be more cost effective and sustainable than non-integrated physical engineering approaches. [5.5, 8.4.2, 14.3.1, 24.6, 29.3.1, 29.7.2, 30.6.1, 30.6.2, Table 5-4, Box CC-EA]
Continued next page
52
Technical Summary
Table TS.2 (continued) Community-based adaptation and traditional practices in small island contexts Exposure and vulnerability
With small land area, often low elevation coasts, and concentration of human communities and infrastructure in coastal zones, small islands are particularly vulnerable to rising sea levels and impacts such as inundation, saltwater intrusion, and shoreline change. [29.3.1, 29.3.3, 29.6.1, 29.6.2, 29.7.2]
Climate information at the global scale
Observed: • Likely increase in the magnitude of extreme high sea level events since 1970, mostly explained by rising mean sea level. [WGI AR5 3.7.5] • Low confidence in long-term (centennial) changes in tropical cyclone activity, after accounting for past changes in observing capabilities. [WGI AR5 2.6.3] • Since 1950 the number of heavy precipitation events over land has likely increased in more regions than it has decreased. [WGI AR5 2.6.2] Projected: • Very likely significant increase in the occurrence of future sea level extremes by 2050 and 2100. [WGI AR5 13.7.2] • In the 21st century, likely that the global frequency of tropical cyclones will either decrease or remain essentially unchanged. Likely increase in both global mean tropical cyclone maximum wind speed and rainfall rates. [WGI AR5 14.6] • Globally, for short-duration precipitation events, likely shift to more intense individual storms and fewer weak storms. [WGI AR5 12.4.5]
Climate information at the regional scale
Observed: Change in sea level relative to the land (relative sea level) can be significantly different from the global mean sea level change because of changes in the distribution of water in the ocean and vertical movement of the land. [WGI AR5 3.7.3] Projected: • Low confidence in region-specific projections of storminess and associated storm surges. [WGI AR5 13.7.2] • Projections of regional changes in sea level reach values of up to 30% above the global mean value in the Southern Ocean and around North America, and between 10% and 20% above the global mean value in equatorial regions. [WGI AR5 13.6.5] • More likely than not substantial increase in the frequency of the most intense tropical cyclones in the western North Pacific and North Atlantic. [WGI AR5 14.6]
Description
Traditional technologies and skills can be relevant for climate adaptation in small island contexts. In the Solomon Islands, relevant traditional practices include elevating concrete floors to keep them dry during heavy precipitation events and building low aerodynamic houses with palm leaves as roofing to avoid hazards from flying debris during cyclones, supported by perceptions that traditional construction methods are more resilient to extreme weather. In Fiji after Cyclone Ami in 2003, mutual support and risk sharing formed a central pillar for community-based adaptation, with unaffected households fishing to support those with damaged homes. Participatory consultations across stakeholders and sectors within communities and capacity building taking into account traditional practices can be vital to the success of adaptation initiatives in island communities, such as in Fiji or Samoa. [29.6.2]
Broader context
• Perceptions of self-efficacy and adaptive capacity in addressing climate stress can be important in determining resilience and identifying useful solutions. • The relevance of community-based adaptation principles to island communities, as a facilitating factor in adaptation planning and implementation, has been highlighted, for example, with focus on empowerment and learning-by-doing, while addressing local priorities and building on local knowledge and capacity. Community-based adaptation can include measures that cut across sectors and technological, social, and institutional processes, recognizing that technology by itself is only one component of successful adaptation. [5.5.4, 29.6.2]
Adaptive approaches to flood defense in Europe Exposure and vulnerability
Increased exposure of persons and property in flood risk areas has contributed to increased damages from flood events over recent decades. [5.4.3, 5.4.4, 5.5.5, 23.3.1, Box 5-1]
Climate information at the global scale
Observed: • Likely increase in the magnitude of extreme high sea level events since 1970, mostly explained by rising mean sea level. [WGI AR5 3.7.5] • Since 1950 the number of heavy precipitation events over land has likely increased in more regions than it has decreased. [WGI AR5 2.6.2] Projected: • Very likely that the time-mean rate of global mean sea level rise during the 21st century will exceed the rate observed during 1971–2010 for all RCP scenarios. [WGI AR5 13.5.1] • Globally, for short-duration precipitation events, likely shift to more intense individual storms and fewer weak storms. [WGI AR5 12.4.5]
Climate information at the regional scale
Observed: • Likely increase in the frequency or intensity of heavy precipitation in Europe, with some seasonal and/or regional variations. [WGI AR5 2.6.2] • Increase in heavy precipitation in winter since the 1950s in some areas of northern Europe (medium confidence). Increase in heavy precipitation since the 1950s in some parts of west-central Europe and European Russia, especially in winter (medium confidence). [SREX Table 3-2] • Increasing mean sea level with regional variations, except in the Baltic Sea where the relative sea level is decreasing due to vertical crustal motion. [5.3.2, 23.2.2] Projected: • Over most of the mid-latitude land masses, extreme precipitation events will very likely be more intense and more frequent in a warmer world. [WGI AR5 12.4.5] • Overall precipitation increase in northern Europe and decrease in southern Europe (medium confidence). [23.2.2] • Increased extreme precipitation in northern Europe during all seasons, particularly winter, and in central Europe except in summer (high confidence). [23.2.2; SREX Table 3-3]
Description
Several governments have made ambitious efforts to address flood risk and sea level rise over the coming century. In the Netherlands, government recommendations include “soft” measures preserving land from development to accommodate increased river inundation; maintaining coastal protection through beach nourishment; and ensuring necessary political-administrative, legal, and financial resources. Through a multi-stage process, the British government has also developed extensive adaptation plans to adjust and improve flood defenses to protect London from future storm surges and river flooding. Pathways have been analyzed for different adaptation options and decisions, depending on eventual sea level rise, with ongoing monitoring of the drivers of risk informing decisions. [5.5.4, 23.7.1, Box 5-1]
Broader context
• The Dutch plan is considered a paradigm shift, addressing coastal protection by “working with nature” and providing “room for river.” • The British plan incorporates iterative, adaptive decisions depending on the eventual sea level rise with numerous and diverse measures possible over the next 50 to 100 years to reduce risk to acceptable levels. • In cities in Europe and elsewhere, the importance of strong political leadership or government champions in driving successful adaptation action has been noted. [5.5.3, 5.5.4, 8.4.3, 23.7.1, 23.7.2, 23.7.4, Boxes 5-1 and 26-3]
Continued next page
53
TS
Technical Summary
Table TS.2 (continued) Index-based insurance for agriculture in Africa Exposure and vulnerability
Susceptibility to food insecurity and depletion of farmers’ productive assets following crop failure. Low prevalence of insurance due to absent or poorly developed insurance markets or to amount of premium payments. The most marginalized and resource-poor especially may have limited ability to afford insurance premiums. [10.7.6, 13.3.2, Box 22-1]
Climate information at the global scale
Observed: • Very likely decrease in the number of cold days and nights and increase in the number of warm days and nights, on the global scale between 1951 and 2010. [WGI AR5 2.6.1] • Medium confidence that the length and frequency of warm spells, including heat waves, has increased globally since 1950. [WGI AR5 2.6.1] • Since 1950 the number of heavy precipitation events over land has likely increased in more regions than it has decreased. [WGI AR5 2.6.2] • Low confidence in a global-scale observed trend in drought or dryness (lack of rainfall). [WGI AR5 2.6.2] Projected: • Virtually certain that, in most places, there will be more hot and fewer cold temperature extremes as global mean temperatures increase, for events defined as extremes on both daily and seasonal time scales. [WGI AR5 12.4.3] • Regional to global-scale projected decreases in soil moisture and increased risk of agricultural drought are likely in presently dry regions, and are projected with medium confidence by the end of this century under the RCP8.5 scenario. [WGI AR5 12.4.5] • Globally, for short-duration precipitation events, likely shift to more intense individual storms and fewer weak storms. [WGI AR5 12.4.5]
TS
Climate information at the regional scale
Observed: • Medium confidence in increase in frequency of warm days and decrease in frequency of cold days and nights in southern Africa. [SREX Table 3-2] • Medium confidence in increase in frequency of warm nights in northern and southern Africa. [SREX Table 3-2] Projected: • Likely surface drying in southern Africa by the end of the 21st century under RCP8.5 (high confidence). [WGI AR5 12.4.5] • Likely increase in warm days and nights and decrease in cold days and nights in all regions of Africa (high confidence). Increase in warm days largest in summer and fall (medium confidence). [SREX Table 3-3] • Likely more frequent and/or longer heat waves and warm spells in Africa (high confidence). [SREX Table 3-3]
Description
A recently introduced mechanism that has been piloted in a number of rural locations, including in Malawi, Sudan, and Ethiopia, as well as in India. When physical conditions reach a particular predetermined threshold where significant losses are expected to occur—weather conditions such as excessively high or low cumulative rainfall or temperature peaks—the insurance pays out. [9.4.2, 13.3.2, 15.4.4, Box 22-1]
Broader context
• Index-based weather insurance is considered well suited to the agricultural sector in developing countries. • The mechanism allows risk to be shared across communities, with costs spread over time, while overcoming obstacles to traditional agricultural and disaster insurance markets. It can be integrated with other strategies such as microfinance and social protection programs. • Risk-based premiums can help encourage adaptive responses and foster risk awareness and risk reduction by providing financial incentives to policyholders to reduce their risk profile. • Challenges can be associated with limited availability of accurate weather data and difficulties in establishing which weather conditions cause losses. Basis risk (i.e., farmers suffer losses but no payout is triggered based on weather data) can promote distrust. There can also be difficulty in scaling up pilot schemes. • Insurance for work programs can enable cash-poor farmers to work for insurance premiums by engaging in community-identified disaster risk reduction projects. [10.7.4 to 10.7.6, 13.3.2, 15.4.4, Table 10-7, Boxes 22-1 and 25-7]
Continued next page
•
•
•
54
for sea level rise has evolved considerably over the past 2 decades and shows a diversity of approaches, although its implementation remains piecemeal (high confidence). Adaptive capacity is generally high in many human systems, but implementation faces major constraints especially for transformational responses at local and community levels. [25.4, 25.10, Table 25-2, Boxes 25-1, 25-2, and 25-9] In North America, governments are engaging in incremental adaptation assessment and planning, particularly at the municipal level (high confidence). Some proactive adaptation is occurring to protect longer-term investments in energy and public infrastructure. [26.7 to 26.9] In Central and South America, ecosystem-based adaptation including protected areas, conservation agreements, and community management of natural areas is occurring (high confidence). Resilient crop varieties, climate forecasts, and integrated water resources management are being adopted within the agricultural sector in some areas. [27.3] In the Arctic, some communities have begun to deploy adaptive comanagement strategies and communications infrastructure, combining traditional and scientific knowledge (high confidence). [28.2, 28.4]
•
•
In small islands, which have diverse physical and human attributes, community-based adaptation has been shown to generate larger benefits when delivered in conjunction with other development activities (high confidence). [29.3, 29.6, Table 29-3, Figure 29-1] In both the open ocean and coastal areas, international cooperation and marine spatial planning are starting to facilitate adaptation to climate change, with constraints from challenges of spatial scale and governance issues (high confidence). Observed coastal adaptation includes major projects (e.g., Thames Estuary, Venice Lagoon, Delta Works) and specific practices in some countries (e.g., Netherlands, Australia, Bangladesh). [5.5, 7.3, 15.4, 30.6, Box CC-EA]
Table TS.2 presents examples of how climate extremes and change, as well as exposure and vulnerability at the scale of risk management, shape adaptation actions and approaches to reducing vulnerability and enhancing resilience.
A-3. The Decision-making Context Climate variability and extremes have long been important in many decision-making contexts. Climate-related risks are now evolving over
Technical Summary
Table TS.2 (continued) Relocation of agricultural industries in Australia Exposure and vulnerability
Crops sensitive to changing patterns of temperature, rainfall, and water availability. [7.3, 7.5.2]
Climate information at the global scale
Observed: • Very likely decrease in the number of cold days and nights and increase in the number of warm days and nights, on the global scale between 1951 and 2010. [WGI AR5 2.6.1] • Medium confidence that the length and frequency of warm spells, including heat waves, has increased globally since 1950. [WGI AR5 2.6.1] • Medium confidence in precipitation change over global land areas since 1950. [WGI AR5 2.5.1] • Since 1950 the number of heavy precipitation events over land has likely increased in more regions than it has decreased. [WGI AR5 2.6.2] • Low confidence in a global-scale observed trend in drought or dryness (lack of rainfall). [WGI AR5 2.6.2] Projected: • Virtually certain that, in most places, there will be more hot and fewer cold temperature extremes as global mean temperatures increase, for events defined as extremes on both daily and seasonal time scales. [WGI AR5 12.4.3] • Virtually certain increase in global precipitation as global mean surface temperature increases. [WGI AR5 12.4.1] • Regional to global-scale projected decreases in soil moisture and increased risk of agricultural drought are likely in presently dry regions, and are projected with medium confidence by the end of this century under the RCP8.5 scenario. [WGI AR5 12.4.5] • Globally, for short-duration precipitation events, likely shift to more intense individual storms and fewer weak storms. [WGI AR5 12.4.5]
Climate information at the regional scale
Observed: • Cool extremes rarer and hot extremes more frequent and intense over Australia and New Zealand, since 1950 (high confidence). [Table 25-1] • Likely increase in heat wave frequency since 1950 in large parts of Australia. [WGI AR5 2.6.1] • Late autumn/winter decreases in precipitation in southwestern Australia since the 1970s and southeastern Australia since the mid-1990s, and annual increases in precipitation in northwestern Australia since the 1950s (very high confidence). [Table 25-1] • Mixed or insignificant trends in annual daily precipitation extremes, but a tendency to significant increase in annual intensity of heavy precipitation in recent decades for sub-daily events in Australia (high confidence). [Table 25-1]
TS
Projected: • Hot days and nights more frequent and cold days and nights less frequent during the 21st century in Australia and New Zealand (high confidence). [Table 25-1] • Annual decline in precipitation over southwestern Australia (high confidence) and elsewhere in southern Australia (medium confidence). Reductions strongest in the winter half-year (high confidence). [Table 25-1] • Increase in most regions in the intensity of rare daily rainfall extremes and in sub-daily extremes (medium confidence) in Australia and New Zealand. [Table 25-1] • Drought occurrence to increase in southern Australia (medium confidence). [Table 25-1] • Snow depth and snow area to decline in Australia (very high confidence). [Table 25-1] • Freshwater resources projected to decline in far southeastern and far southwestern Australia (high confidence). [25.5.2]
Description
Industries and individual farmers are relocating parts of their operations, for example for rice, wine, or peanuts in Australia, or are changing land use in situ in response to recent climate change or expectations of future change. For example, there has been some switching from grazing to cropping in southern Australia. Adaptive movement of crops has also occurred elsewhere. [7.5.1, 25.7.2, Table 9-7, Box 25-5]
Broader context
• Considered transformational adaptation in response to impacts of climate change. • Positive or negative implications for the wider communities in origin and destination regions. [25.7.2, Box 25-5]
time due to both climate change and development. This section builds from existing experience with decision making and risk management. It creates a foundation for understanding the report’s assessment of future climate-related risks and potential responses. Responding to climate-related risks involves decision making in a changing world, with continuing uncertainty about the severity and timing of climate-change impacts and with limits to the effectiveness of adaptation (high confidence). Iterative risk management is a useful framework for decision making in complex situations characterized by large potential consequences, persistent uncertainties, long timeframes, potential for learning, and multiple climatic and non-climatic influences changing over time. See Figure TS.4. Assessment of the widest possible range of potential impacts, including low-probability outcomes with large consequences, is central to understanding the benefits and trade-offs of alternative risk management actions. The complexity of adaptation actions across scales and contexts means that monitoring and learning are important components of effective adaptation. [2.1 to 2.4, 3.6, 14.1 to 14.3, 15.2 to 15.4, 16.2 to 16.4, 17.1 to 17.3, 17.5, 20.6, 22.4, 25.4, Figure 1-5] Adaptation and mitigation choices in the near term will affect the risks of climate change throughout the 21st century (high
confidence). Figure TS.5 illustrates projected climate futures under a low-emission mitigation scenario and a high-emission scenario [Representative Concentration Pathways (RCPs) 2.6 and 8.5], along with observed temperature and precipitation changes. The benefits of adaptation and mitigation occur over different but overlapping timeframes. Projected global temperature increase over the next few decades is similar across emission scenarios (Figure TS.5A, middle panel) (WGI AR5 Section 11.3). During this near-term era of committed climate change, risks will evolve as socioeconomic trends interact with the changing climate. Societal responses, particularly adaptations, will influence near-term outcomes. In the second half of the 21st century and beyond, global temperature increase diverges across emission scenarios (Figure TS.5A, middle and bottom panels) (WGI AR5 Section 12.4 and Table SPM.2). For this longer-term era of climate options, nearterm and longer-term adaptation and mitigation, as well as development pathways, will determine the risks of climate change. [2.5, 21.2, 21.3, 21.5, Box CC-RC] Assessment of risks in the WGII AR5 relies on diverse forms of evidence. Expert judgment is used to integrate evidence into evaluations of risks. Forms of evidence include, for example, empirical observations, experimental results, process-based understanding, statistical approaches, and simulation and descriptive models. Future 55
Technical Summary
Context
People
Knowledge
Deliberative Process Scoping Scop ping g Identify risks, vulnerabilities, & objectives
Establish decisionmaking criteria
TS Implementation
Analysis Identify options
Review & learn
Implement decision Evaluate tradeoffs
Monitor
Assess risks
Figure TS.4 | Climate-change adaptation as an iterative risk management process with multiple feedbacks. People and knowledge shape the process and its outcomes. [Figure 2-1]
risks related to climate change vary substantially across plausible alternative development pathways, and the relative importance of development and climate change varies by sector, region, and time period (high confidence). Scenarios are useful tools for characterizing possible future socioeconomic pathways, climate change and its risks, and policy implications. Climate-model projections informing evaluations of risks in this report are generally based on the RCPs (Figure TS.5), as well as the older IPCC Special Report on Emissions Scenarios (SRES) scenarios. [1.1, 1.3, 2.2, 2.3, 19.6, 20.2, 21.3, 21.5, 26.2, Box CC-RC; WGI AR5 Box SPM.1] Scenarios can be divided into those that explore how futures may unfold under various drivers (problem exploration) and those that test how various interventions may play out (solution exploration) (robust evidence, high agreement). Adaptation approaches address uncertainties associated with future climate and socioeconomic conditions and with the diversity of specific contexts (medium evidence, high agreement). Although many national studies identify a variety of strategies and approaches for adaptation, they can be classified into two broad categories: “top-down” and “bottom-up” approaches. The top-down approach is a scenario-impact approach, consisting of downscaled climate projections, impact assessments, and formulation of strategies and options. The bottom-up approach is a vulnerability-threshold approach, starting with the identification of
56
vulnerabilities, sensitivities, and thresholds for specific sectors or communities. Iterative assessments of impacts and adaptation in the topdown approach and building adaptive capacity of local communities are typical strategies for responding to uncertainties. [2.2, 2.3, 15.3] Uncertainties about future vulnerability, exposure, and responses of interlinked human and natural systems are large (high confidence). This motivates exploration of a wide range of socioeconomic futures in assessments of risks. Understanding future vulnerability, exposure, and response capacity of interlinked human and natural systems is challenging due to the number of interacting social, economic, and cultural factors, which have been incompletely considered to date. These factors include wealth and its distribution across society, demographics, migration, access to technology and information, employment patterns, the quality of adaptive responses, societal values, governance structures, and institutions to resolve conflicts. International dimensions such as trade and relations among states are also important for understanding the risks of climate change at regional scales. [11.3, 12.6, 21.3 to 21.5, 25.3, 25.4, 25.11, 26.2]
Technical Summary
(A)
Observed Temperature Change –0.5
0
2
4
6
Based on trend over 1901–2012 (˚C over period)
11.7
Solid Color
Significant trend
White
Insufficient data
Diagonal Lines
Trend not statistically significant
( ˚ C relative to 1986–2005)
Global mean temperature change
TS
6
4
Observed 2
RCP8.5
0
RCP2.6
Overlap
–2 1900
1950
Projected Temperature Change –0.5
0
2
4
6
11.7
Difference Differencefrom from 1986–2005 1986–2005mean mean( ˚ C) ( ˚C)
RCP2.6 2081–2100
Figure TS.5
2000
2050
Solid Color Gray
2100
Very strong agreement Divergent changes
Strong agreement Little or Diagonal Lines no change White Dots
RCP8.5 2081–2100
Continued next page
57
Technical Summary
Figure TS.5 (continued)
(B)
Observed Precipitation Change Trend over 1951–2010 (mm/year per decade) –100 –50 –25 –10 –5 –2.5 0 2.5 5
10 25 50
Solid Color
Significant trend
White
Insufficient data
Diagonal Lines
Trend not statistically significant
TS
Projected Precipitation Change –20 0 20 40
Difference from 1986–2005 mean (%)
RCP2.6 2081–2100
Solid Color Gray
Very strong agreement Divergent changes
Strong agreement Little or Diagonal Lines no change White Dots
RCP8.5 2081–2100
Figure TS.5 | Observed and projected changes in annual average surface temperature (A) and precipitation (B). This figure informs understanding of climate-related risks in the WGII AR5. It illustrates changes observed to date and projected changes under continued high emissions and under ambitious mitigation. Technical details: (A, top panel) Map of observed annual mean temperature change from 1901–2012, derived from a linear trend. Observed data (range of grid-point values: –0.53 to 2.50°C over period) are from WGI AR5 Figures SPM.1 and 2.21. (B, top panel) Map of observed annual precipitation change from 1951–2010, derived from a linear trend. Observed data (range of grid-point values: –185 to 111 mm/year per decade) are from WGI AR5 Figures SPM.2 and 2.29. For observed temperature and precipitation, trends have been calculated where sufficient data permit a robust estimate (i.e., only for grid boxes with greater than 70% complete records and more than 20% data availability in the first and last 10% of the time period). Other areas are white. Solid colors indicate areas where trends are significant at the 10% level. Diagonal lines indicate areas where trends are not significant. (A, middle panel) Observed and projected future global annual mean temperature relative to 1986–2005. Observed warming from 1850–1900 to 1986–2005 is 0.61°C (5–95% confidence interval: 0.55 to 0.67°C). Black lines show temperature estimates from three datasets. Blue and red lines and shading denote the ensemble mean and ±1.64 standard deviation range, based on Coupled Model Intercomparison Project Phase 5 (CMIP5) simulations from 32 models for RCP2.6 and 39 models for RCP8.5. (A and B, bottom panel) CMIP5 multi-model mean projections of annual mean temperature changes (A) and mean percent changes in annual mean precipitation (B) for 2081–2100 under RCP2.6 and 8.5, relative to 1986–2005. Solid colors indicate areas with very strong agreement, where the multi-model mean change is greater than twice the baseline variability (natural internal variability in 20-yr means) and ≥90% of models agree on sign of change. Colors with white dots indicate areas with strong agreement, where ≥66% of models show change greater than the baseline variability and ≥66% of models agree on sign of change. Gray indicates areas with divergent changes, where ≥66% of models show change greater than the baseline variability, but


![AR5 Synthesis Report - IPCC [PDF]](https://m.moam.info/img/260x300/ar5-synthesis-report-ipcc-pdf_647e2cf2098a9e62638b4599.jpg)

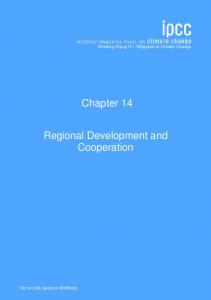

![AR5 Synthesis Report - IPCC [PDF]](https://m.moam.info/img/260x300/ar5-synthesis-report-ipcc-pdf_647d94dd098a9e6e3f8b459f.jpg)


