Astronomy & Astrophysics manuscript no. fran (DOI: will be inserted by hand later)
July 29, 2015
What Powers Lyα Blobs?? Y. Ao1,2?? , Y. Matsuda1 , A. Beelen3 , C. Henkel4,5 , R. Cen6 , C. De Breuck7 , P. J. Francis8 , A. Kov´acs9 , G. Lagache10 , M. Lehnert11 , M. Y. Mao12,13,14 , K. M. Menten4 , R. P. Norris13 , A. Omont11 , K. Tatemastu1 , A. Weiß 4 and Z. Zheng15 1 2 3
arXiv:1507.07627v1 [astro-ph.GA] 28 Jul 2015
4 5 6 7 8 9 10 11 12 13 14 15
National Astronomical Observatory of Japan, 2-21-1 Osawa, Mitaka, Tokyo 181-8588, Japan Purple Mountain Observatory, Chinese Academy of Sciences, Nanjing 210008, China Institut d0 Astrophysique Spatiale, Bˆat. 121, Universit´e Paris-Sud, 91405 Orsay Cedex, France MPIfR, Auf dem H¨ugel 69, 53121 Bonn, Germany Astron. Dept., King Abdulaziz Univ., P.O. Box 80203, Jeddah 21589, Saudi Arabia Princeton University Observatory, Princeton, NJ 08544, USA European Southern Observatory, Karl Schwarzschild Straße 2, 85748, Garching, Germany Research School of Astronomy and Astrophysics, The Australian National University, Canberra ACT 0200, Australia California Institute of Technology 301-17, 1200 E. California Blvd, Pasadena, CA 91125, USA Aix Marseille Universit´e, CNRS, LAM (Laboratoire d0 Astrophysique de Marseille) UMR 7326, 13388, Marseille, France Institut d0 Astrophysique de Paris, CNRS and Universit´e Pierre et Marie Curie, 98bis Bd Arago, 75014 Paris, France School of Mathematics and Physics, University of Tasmania, Private Bag 37 Hobart, 7001 Australia Joint Institute for VLBI, Postbus 2, 7990 AA Dwingeloo, The Netherlands Australia Telescope National Facility, CSIRO Astronomy and Space Science, PO Box 76, Epping, NSW 1710, Australia Department of Physics and Astronomy, University of Utah, Salt Lake City, UT 84112, USA
Abstract. Lyα blobs (LABs) are spatially extended Lyα nebulae seen at high redshift. The origin of Lyα emission in the LABs is still unclear and under debate. To study their heating mechanism(s), we present Australia Telescope Compact Array (ATCA) observations of the 20 cm radio emission and Herschel PACS and SPIRE measurements of the far-infrared (FIR) emission towards the four LABs in the protocluster J2143-4423 at z=2.38. Among the four LABs, B6 and B7 are detected in the radio with fluxes of 67±17 µJy and 77±16 µJy, respectively, and B5 is marginally detected at 3 σ (51±16 µJy). For all detected sources, their radio positions are consistent with the central positions of the LABs. B6 and B7 are obviously also detected in +0.30 +0.45 the FIR. By fitting the data with different templates, we obtained redshifts of 2.20−0.35 for B6 and 2.20−0.30 for B7 which are consistent with the redshift of the Lyα emission within uncertainties, indicating that both FIR sources are likely associated with the LABs. The associated FIR emission in B6 and B7 and high star formation rates strongly favor star formation in galaxies as an important powering source for the Lyα emission in both LABs. However, the other two, B1 and B5, are predominantly driven by the active galactic nuclei or other sources of energy still to be specified, but not mainly by star formation. In general, the LABs are powered by quite diverse sources of energy. Key words. galaxies: formation – galaxies:high-redshift – galaxies:ISM – galaxies:active – infrared:galaxies
1. Introduction High-redshift star-forming galaxies are becoming an important probe of galaxy formation, reionization and cosmology (Robertson et al. 2010; Shapley 2011). A popular method for finding high redshift star forming galaxies is to target their often bright Lyα emission (Partridge & Peebles 1967). This emission can be easily detected in narrow-band imaging surveys, and can be further confirmed by spectroscopic observations (Hu et al. 1998; Ouchi et al. 2008; Yamada et al. 2012a,b). In ? Herschel (Pilbratt et al. 2010) is an ESA space observatory with science instruments provided by European-led Principal Investigator consortia and with important participation from NASA. ?? email:
[email protected]
addition to discovering numerous Lyα emitters (LAEs), a particular class of objects, also known as ”Lyα blobs” (LABs), has been most commonly found in the dense environment of starforming galaxies at high redshift, and they are very extended (30 to 200 kpc) and Lyα-luminous (1043 to 1044 erg s−1 ) (see, e.g., Francis et al. 1996; Steidel et al. 2000; Palunas et al. 2004; Matsuda et al. 2004, 2009, 2011; Dey et al. 2005; Saito et al. 2006; Yang et al. 2009, 2010; Erb et al. 2011; Prescott et al. 2012a, 2013; Bridge et al. 2013). In contrast to the large Lyα nebulae surrounding some high-redshift radio galaxies (e.g., Reuland et al. 2003; Venemans et al. 2007), these objects do not always have obvious sources for energy responsible for their strong emission.
2
Y. Ao et al.: What Powers the Lyα Blobs?
While the LABs’ preferential location in overdense environments indicates an association with massive galaxy formation, the origin of Lyα emission in the LABs is still unclear and under debate (Faucher-Giguere et al. 2010; Cen & Zheng 2013; Yajima et al. 2013). Proposed sources have generally fallen into two categories: cooling radiation from cold streams of gas accreting onto galaxies (e.g., Haiman et al. 2000; Dijkstra & Loeb 2009; Goerdt et al. 2010) and photoionization/recombination from starbursts or active galactic nuclei (AGNs) (e.g., Taniguchi & Shioya 2000; Furlanetto et al. 2005; Mori & Umemura 2006; Zheng et al. 2011). Supporting evidence for the cooling flow scenario comes from those LABs lacking any visible power source (e.g., Nilsson et al. 2006; Smith & Jarvis 2007). Ionizing photons from young stars in star-forming galaxies and/or AGNs can ionize neutral hydrogen atoms and the subsequent recombination gives off Lyα emission. The resonant scattering of Lyα photons in the circumgalactic medium makes the emission extended (Geach et al. 2005, 2009; Colbert et al. 2006, 2011; Beelen et al. 2008; Webb et al. 2009; Zheng et al. 2011; Cen & Zheng 2013; Overzier et al. 2013). Except for cooling flows and photoionization from starforming galaxies and/or AGNs, other possible mechanisms, such as galactic super-winds and obscured AGNs, are also proposed to explain the nature of the LABs (e.g., Ohyama et al. 2003; Wilman et al. 2005; Colbert et al. 2006; Matsuda et al. 2007). All these sources of energy may be activated in an environment where violent interactions are frequent between gas rich galaxies as expected in over-dense regions at high redshift (Matsuda et al. 2009, 2011; Prescott et al. 2012b; Kubo et al. 2013). The 110 Mpc filament with 37 LAEs related to the protocluster J2143-4423 at z=2.38 (Francis et al. 1996, 2004; Palunas et al. 2004) is one of the largest known structures at high redshift, and this field also includes four large extended LABs with extensions of ∼ 50 kpc and above, named B1, B5, B6 and B7. In this paper, we present our deep radio observations and Herschel released far-infrared (FIR) data in J2143-4423 to study the powering source of these LABs. Throughout this paper, we use a Λ cosmology with H0 = 67.3 km s−1 Mpc−1 , ΩΛ = 0.685 and Ωm = 0.315 (Planck Collaboration XVI 2013), and 100 corresponds to 8.37 kpc at z=2.38.
2. Observations
wide-band mode, with a total bandwidth of 2 GHz and a channel width of 1 MHz. The nearby source PKS 2134-470 served as a gain calibrator. Absolute fluxes were calibrated with the ATCA standard PKS 1934-638. The total observing time was about 70 hours. The data were reduced with the MIRIAD software package. Although the observations were carried out with a total bandwidth of 2 GHz, the effective bandwidth was about 489 MHz with a central frequency of 1.51 GHz. We carefully flagged the channels affected by radio frequency interference (RFI) by checking the visibility data sorted by time, channels and baselines. The image was deconvolved with MIRIAD task MFCLEAN, and task SELFCAL was used to reduce the noise from strong radio continuum sources. We first created cleaned images in a normal procedure and made model images for the strong sources. The models were used as inputs for task SELFCAL to perform self-calibration of visibility data. We ran this cycle for three times, and then obtained the model images to create the visibility data with self-calibration, which were used to make the final images. The noise of the images after applying self-calibration was about one order of magnitude lower than that without self-calibration. The field of view was about 31 arcmins and the synthesized beam size was 7.800 ×4.800 . The noise was about 15 µJy/beam before applying primary beam correction.
2.2. Archival Herschel observations Herschel observations towards J2143-4423 were carried out with PACS (Poglitsch et al. 2010) at 100 and 160 µm and SPIRE (Griffin et al. 2010) at 250, 350 and 500 µm in 2010 to 2011. J2143-4423 was imaged in a field size of 150 ×150 for each band, and the observing time was ∼2.9 hours for PACS (Herschel OD: 686) and ∼0.6 hours for SPIRE (Herschel OD: 558). The level 2.5 product for PACS and the level 2 product for SPIRE from the pipeline procedures are used for our data analysis. Source photometry is carried out using DAOphot algorithm in the Herschel Interactive Processing Environment (HIPE). We apply beam correction, colour correction, aperture correction for a spectral index of −2 and adopt a flux calibration error of 5% at PACS bands and 7% at SPIRE bands as recommended in the PACS and SPIRE Observers Manual. The full width at half power (FWHP) beam sizes are 6.800 at 100 µm, 11.400 at 160 µm, 17.600 at 250 µm, 23.900 at 350 µm and 35.200 at 500 µm, respectively.
2.1. ATCA observations We observed J2143-4423 with the Australia Telescope Compact Array (ATCA)1 in its extended configuration 6A. During the observations from 2009 June 14 to 17, only five out of six antennas were available. The observations were performed at a central frequency of 1.75 GHz. We used the Compact Array Broadband Backend (Wilson et al. 2011) in a 1 The Australia Telescope Compact Array is part of the Australia Telescope, which is funded by the Commonwealth of Australia for operation as a National Facility managed by CSIRO.
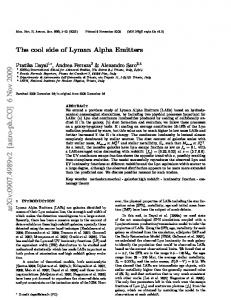
3. Results 3.1. Radio emission from ATCA observations In Fig. 1(a) we present the radio continuum emission images at 20 cm from the ATCA. Among the four LABs, B6 and B7 are detected with fluxes of 67±17 µJy and 77±16 µJy, respectively, and B5 is marginally detected at 3 σ (51±16 µJy). For all detected sources, their positions are consistent with the central positions of the LABs. Only B1 is not detected by the observations.
Y. Ao et al.: What Powers the Lyα Blobs?
3
Fig. 1. ATCA 20 cm, Spitzer MIPS 24µm and Herschel PACS and SPIRE data for the four Lyα blobs (LABs) in J2143-4423. a) Contours and gray scale maps of ATCA radio emission. The contours are -2, 2, 3, 4, 5 and 6 × 15 µJy (1 σ), with a synthesized beam of 7.800 ×4.800 , which is shown in the lower left corner of each panel. b) Gray maps of Spitzer MIPS 24 µm emission (Colbert et al. 2006). c-g) Contours and gray scale maps of Herschel FIR emission. The contours are -2σ, 2σ, 3σ, 4σ, 5σ and 6σ (see § 2.2 for the noise level of each band). A circle with a diameter of 4000 is shown in each panel. The circles in B7 are on an off-center position (500 , 000 ) to cover most FIR emission. All sources are centered on the positions of the four LABs (see Colbert et al. 2006) as shown with plus signs in each panel. All offsets are relative to the positions of the LABs.
3.2. FIR emission from Herschel observations All four LABs are observed with Herschel PACS at 100 and 160 µm and SPIRE at 250, 350 and 500 µm, and the images are shown in Fig. 1(c-g). The observed flux densities are calculated for the areas within the blue circles as shown in Fig. 1 and are listed in Table 1. B1 is not detected but contaminated by a nearby strong source about 2000 in the north-west, which is the background QSO LBQS2138-4427 at z = 3.2 (Francis & Hewett 1993), and its emission features at different FIR bands appear to reach out to B1 from this location. There is no FIR counterpart for B5 in any Herschel band.
3.3. Redshifts of the FIR sources To estimate the redshift of the FIR sources associated with B6 and B7, we try to fit the data with the SEDs of different templates (Polletta et al. 2007) at different redshifts and find that the starburst templates can well reproduce the data. With the observational data and the SEDs of the templates, the minimum reduced χ2 value for each redshift can be calculated and the corresponding probability can be estimated. In this analy-
sis, we include five Herschel band, APEX 870 µm data (Beelen et al. 2008), and Spitzer MIPS 24 µm data (Colbert et al. 2006). Among four typical templates, Arp 220, M 82, Mrk 231 and NGC 6240, we find that the spectral energy distribution of starburst galaxies NGC 6240 and Arp 220 fit the data best, and Mrk 231 doesn’t fit well because it has warm IR emission from its AGN which is not really consistent with the data. Fig. 2 shows the probability distribution against redshift for both LABs. The +0.45 estimated redshifts are 2.20+0.30 −0.35 for B6 and 2.20−0.30 for B7 respectively. Considering the uncertainty of this method to determine the redshifts, both values are consistent with the Lyα redshift of 2.38 of the LABs. Adopting the number count study of Herschel sources in Clements et al. (2010), the probability of finding a 350 µm source with a flux greater than 40 mJy within 20 arcsec is 2%. According for such a low number density of strong FIR sources and the positional coincidence of the LABs with strong FIR sources, the FIR sources are very likely associated with the LABs. Nevertheless, future spectroscopic observations from molecular lines at millimeter or from forbidden lines at near-infrared will be quite important to confirm it. In the following sections, the Lyα redshift of 2.38 will be adopted for the LABs.
4
Y. Ao et al.: What Powers the Lyα Blobs?
Table 1. Observational and derived parameters towards the four LABsa 20 cmb 100 µm 160 µm 250 µm 350 µm 500 µm LFIR c Mdust [µJy] [mJy] [mJy] [mJy] [mJy] [mJy] [1012 L ] [108 M ] B1