Jan Miksatko and Bruce M. McLaren. Deutsches Forschungszentrum für Künstliche Intelligenz (DFKI). Stuhlsatzenhausweg 3. D-66123 Saarbrücken Germany.
Mikšátko, J. & McLaren, B.M. (2008). What’s in a Cluster? Automatically Detecting Interesting Interactions in Student E-Discussions. In B. Woolf, E. Aimeur, R. Nkambou, S. Lajoie (Eds), Proceedings of the 9th International Conference on Intelligent Tutoring Systems (ITS08), Lecture Notes in Computer Science, 5091 (pp. 333-342). Berlin: Springer.
What’s in a Cluster? Automatically Detecting Interesting Interactions in Student E-Discussions Jan Miksatko and Bruce M. McLaren Deutsches Forschungszentrum für Künstliche Intelligenz (DFKI) Stuhlsatzenhausweg 3 D-66123 Saarbrücken Germany {honza.miksatko, bmclaren}@dfki.de
Abstract. Students in classrooms are starting to use visual argumentation tools for e-discussions – a form of debate in which contributions are written into graphical shapes and linked to one another according to whether they, for instance, support or oppose one another. In order to moderate several simultaneous e-discussions effectively, teachers must be alerted regarding events of interest. We focused on the identification of clusters of contributions representing interaction patterns that are of pedagogical interest (e.g., a student clarifies his or her opinion and then gets feedback from other students). We designed an algorithm that takes an example cluster as input and uses inexact graph matching, text analysis, and machine learning classifiers to search for similar patterns in a given corpus. The method was evaluated on an annotated dataset of real ediscussions and was able to detect almost 80% of the annotated clusters while providing acceptable precision performance. Keywords: Educational Data mining, Machine Learning in ITS, Collaborative Learning, Natural Language and Discourse.
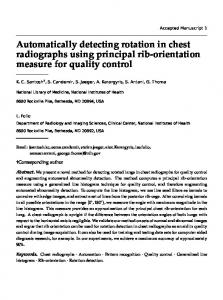
Introduction One of the important trends in Computer-Supported Collaborative Learning (CSCL) is the development and use of networked visual argumentation tools that allow students to work on separate computers and express their ideas, questions, and arguments in visual fashion. Students make contributions to the online discussion by dragging and dropping shapes with different meanings (e.g. “claim” or “question”), filling them with text containing their contributions to the discussion, and linking the shapes to other relevant shapes with labeled links, such as “opposes” or “supports.” An example of such an e-discussion in the Digalo collaboration software is shown in Fig. 1 (text in the shapes shows only the title of the contribution). Although computer-based tools for collaboration, argumentation, and discussion are becoming relatively commonplace in schools [1,2], there is a critical need for software that can help teachers observe, guide, and moderate such e-discussions. For instance, suppose a classroom of students, organized in small discussion groups of 4
2
Jan Miksatko and Bruce M. McLaren
to 6 students, is tasked with discussing and debating a social sciences topic such as “Is it ethical to perform experiments on animals?” using a visual collaboration tool. The teacher in such a classroom obviously cannot monitor and moderate all of these discussions simultaneously without some automated system support. Furthermore, past research suggests that discussion and collaboration tools used by students on their own with no support does not typically lead to fruitful collaboration [3]. In our work on the ARGUNAUT project [4], the Moderator’s Interface (MI) – a software tool that displays multiple simultaneous e-discussions taking place in the classroom – provides the teacher with such support by pointing her to events requiring human intervention.
Fig. 1. A well-structured discussion in Digalo software with three simple clusters 1
In the present work, we are trying to address the problem of identifying complex interaction patterns in the e-discussions. Such patterns, called clusters in the remainder of the paper, are multiple contributions, typically (but not exclusively) made by different students, that capture interesting interactions in the e-discussion. Fig. 1 shows an example of a few such clusters. For instance, “Clarification of opinion following feedback” involves a student clarifying his or her opinion and then getting feedback from other students. Types of clusters representing interesting interactions are specified and annotated by the pedagogical researchers on the ARGUNAUT project, with an eye toward moderating e-discussions. Our primary aim is to provide teachers, the users of the MI, with a tool that can point them to interesting conversational moves and clusters in the discussions [5]. A secondary goal is to support the pedagogical researchers in searching off-line for interesting patterns, as they evaluate and data mine past discussions. 1
The names of students in this discussion have been anonymized to protect their identities.
What’s in a Cluster? Automatically Detecting Interesting Interactions in Student E-Discussions 3
Our task is a daunting one because (1) we are dealing with highly complex data (i.e., a combination of graph structure and text), (2) discussion “maps” (as they will be called henceforth) typically have quite a bit of noisy data, (3) cluster types are difficult to precisely specify, and (4) we have a limited source of annotated data, since annotating clusters in real discussions is extremely time-consuming and difficult. We explored several approaches but ultimately designed and developed one approach that seemed to best fit the problem characteristics above: DOCE (Detection of Clusters by Example). DOCE is based on the idea of using cluster examples to find similar clusters in other discussions and has demonstrated very promising preliminary results on an initial set of annotated maps. The main advantages of the DOCE algorithm can be summarized as follows: • The algorithm does not require precisely defined clusters; instead, it employs an intuitive approach in which cluster examples are provided. • Only a few annotations are required, as examples for queries, contrary to the large number of examples required by supervised methods. Furthermore, it provides a tool for collecting the annotations. • It can detect clusters based on their structural and content features, important to the goals of the ARGUNAUT project. • It is noise tolerant, as it looks for similar, not exactly the same, clusters. In this paper we describe the DOCE algorithm and present our initial, encouraging results.
Related Work Analyzing student contributions and assigning labels is common practice in designing and experimenting with intelligent educational technology. For instance, the researchers in [6] investigated machine-learning approaches by training classifiers on the language of a large corpus of labeled data and classifying single contributions into categories. These results led to the development of TagHelper – a tool for text classification that is also utilized in our work. In addition to the text classification capability of TagHelper, our work with DOCE also incorporates the structure of the discussion by using machine-learned classifications of single contributions (e.g. Topic Focus, Reasoned Claim) and paired contributions (e.g. Contribution-Supporting Argument) [5,7]. Contributions are characterized by a combination of text features extracted by TagHelper and structural attributes relevant to the e-discussions, such as shape type and number of in- and out- links. Several highly reliable classifiers (with Kappa >0.6) have been trained and integrated in the Moderator’s Interface as “Awareness Indicators”, as discussed in [5,7]. However, such supervised learning approaches do not scale well to clusters of arbitrary size. Clusters not only need to be classified, as in standard machine learning approaches, but also recognized in the discussion. In addition, obtaining a sufficient
4
Jan Miksatko and Bruce M. McLaren
number of annotations for training at the cluster level is a very time consuming and difficult task – much more difficult than annotating single and paired contributions. A related unsupervised method, detection of frequently reoccurring patterns, was applied in [8] for identifying common interaction patterns during student software development projects on data from source repository logs or Wiki pages. However, the clusters defined by our expert annotaters do not necessarily occur as frequently in our domain as in theirs. A similar approach was evaluated on the ARGUNAUT project in [9]. A tool was designed for mining sequences of actions in the discussions, such as “create shape”/“add link”/“modify text.” The tool was able to detect some commonly occurring patterns. However, their exact-matching algorithm was unable to detect all of the patterns of given cluster types, especially when clusters differed in subtle and imprecise ways from one another. Our goal was to address these issues with DOCE.
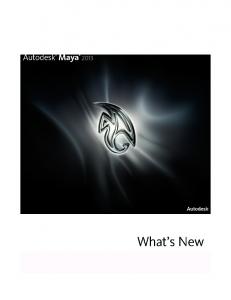
Detection of Clusters by Example (DOCE) The DOCE algorithm is based on the Query By Example (QBE) technique that has been applied to databases as a query method. The idea is to search for similar files or documents based on an input example: a text string, a document, or visual table example [10]. The AI subfield of case-based reasoning [11] is another research area in which examples (i.e., cases) are used to search for similar instances in a repository of data (i.e., a “case base”). A teacher or researcher selects a cluster (e.g. connected individual contributions) in an existing discussion that exemplifies an interesting pattern. The example cluster (also called a “model graph” in the following text) is then used as a search query for similar clusters across other discussion maps (called “input graphs”). The output of the algorithm is a list of matching clusters in the discussion map(s), sorted according to a similarity rating. DOCE can be used as a “live” classifier of clusters – characteristic example(s) representing a cluster of a particular type are stored in the database and used later as queries for automated cluster detection. Or, it can be used as a research tool for obtaining clusters and annotating them in the first place. The DOCE algorithm is sketched in Fig. 2. First, the example cluster and the discussion map are parsed from an XML file format that is used by the Moderator’s Interface for representing a snapshot of the discussion. Both graphs are preprocessed as follows: (1) an adjacency matrix representing the structure of the graph is constructed; (2) each contribution and link in the discussion graph is characterized by a feature vector that is extracted from the attributes associated with the discussion vertex and edge such as shape/link type, text length, link direction and whether the same user created two linked shapes. TagHelper [6] further enriches the feature vectors with additional information from the text analysis of contributions. It performs text processing (e.g. stemming) and extracts textual attributes such as unigrams and bigrams (single words and pairs of words occurring in the text), punctuation (indicator of question or mood of the author) and contains non-stop words (a value predicting if the text is meaningful or not). Additionally, we extend the feature vectors of shapes (links) with the high-accuracy output of shape (pair-shape) classifiers that assign contributions (pairs of contributions, respectively) into categories [5,7]. In the next step, DOCE
What’s in a Cluster? Automatically Detecting Interesting Interactions in Student E-Discussions 5
compares the feature vectors of vertices/edges in the model and input graphs by calculating their distance in a manner similar to unsupervised learning algorithms. The proximity is pre-computed for each pair of model/input objects and stored in the similarity matrices. Model Graph
Input Graph
XML format
XML format
Preprocessing & Feature extraction For both graphs: 1) Represent graph structure as adjacency matrix 2) Generate feature vectors for each vertex and edge _ Preprocess associated attributes _ Perform text analysis by TagHelper _ Annotate shapes and pairs of shapes with ML classifiers Vertex/edge feature vectors
Adjacency matrices
Calculate Content Similarity Compare feature vector for each model vertex (edge) with each input vertex (edge), respectively .
Vertex/Edge similarity matrices
A*-based Matching Find first N complete vertex-to-vertex mappings between model and input graph with maximal content similarity and minimal edit distance cost. Clusters with their matching cost
Results Clusters sorted according to their matching cost (ranking)
Fig. 2. The DOCE algorithm
Finally, an inexact graph matching method based on a customized version of the edit distance algorithm [12,13] is employed to find clusters with the highest structural and content similarity to the model graph. Similar algorithms have been used for various purposes, such as computer vision [16], pattern recognition [14], and retrieving relevant principles from ethics cases [15]. For instance, in [15] engineering ethics cases and principles were represented in a stylized, graphical language. An undecided case was then matched against past cases and a human was provided with suggestions in deciding the current case. The matching works as follows. An A* search algorithm explores all possible vertex-to-vertex mappings between the model and input graph. In each step, a partial mapping of vertices is extended by adding a new vertex-to-vertex assignment that has the maximum content similarity (pre-computed in the similarity matrices) and the minimum structural difference, as measured by edit distance. The edit distance between partially matched graphs is calculated as a minimal sequence of primitive graph operations (such as “add an edge”, “delete an edge”, “delete a vertex”) that are required in order to make the graphs isomorphic. The final matching cost is the sum of all vertex/edge similarities and penalties for the edit operations. The first n complete mappings (i.e. mappings that cover all model vertices) are returned as resulting clusters and sorted in ascending matching-cost order. Thus, the algorithm matches similar clusters on generic graph structures in an inexact manner (e.g., some of our cluster examples are unconnected as well as shapes in
6
Jan Miksatko and Bruce M. McLaren
the discussion may be unlinked). The matching is driven by both the graph structure and content of contributions, for example, the text of the contribution, the users involved in the cluster, and shape type. Note that the detection of all subgraphs is an NP-Complete problem but only in theoretical, not practical, terms. The search space is significantly reduced by applying heuristics similar to [13,16] and the method performs well on graphs of moderate size (dozens of vertices). The graphs in our particular domain are certainly within this range. The DOCE algorithm is described in further detail in [17].
Evaluation We designed an evaluation methodology in which the pedagogical specialists analyzed 27 discussion maps and annotated cluster examples (referred to as “annotations” henceforth) for the three most important types of clusters (as suggested by pedagogical specialists): Clarification of opinion following feedback, Chain of opposition, Argument + evaluation. There were a total of 74 annotations. We used the annotations in each map as input to the DOCE algorithm to evaluate how well the algorithm could find the cluster examples in the other 26 annotated maps. The clusters detected by DOCE were then compared to the annotations in the maps. We compared the performance of DOCE using different feature sets of the algorithm and also compared it to a random algorithm, as there is no other comparable “gold standard” algorithm, at least not for the particular type of problem we are tackling in this work. Our methodology is similar to Information Retrieval (IR) evaluations – the “Top10” results are considered in the evaluation and the relevancy of results is defined based on user feedback [18]. As already explained, DOCE does not always match clusters in an exact manner. Thus a matching cluster was considered “relevant” if the overlap of vertices between the matching cluster and an annotation is at least 70 % (rounded) of the annotation size (e.g. if an annotated cluster is {1,2,3,4}, then a “matched” cluster {2,3,4,5} is relevant). The pedagogical experts verified the acceptability of this definition of relevance, which is based on the idea that even a non-exact match can be valuable since the ultimate objective of DOCE is to draw a teacher’s attention to interesting behavior in a discussion map, not perfectly match that behavior. We used several metrics in our evaluation: • Recall represents the number of relevant matches in the Top10 divided by the count of annotations in the searched map. • Precision is the number of relevant matches in the Top10 divided by 10. • Ranking Quality, known as Average Precision in IR, measures the quality of the ordering of the results. A higher value means better ordering of the matching clusters, with the best value being 1.0 (all matches are on at the top of the list). • Stability is used to evaluate the consistency of the DOCE algorithm with different input models of the same cluster type against the same map. It is calculated as the average intersection size (ranging from 0 to 10) of all pair wise result sets. We consider Recall to be the most important metric, as it is highly critical to find all of the interesting clusters in a given discussion. We believe the number of relevant
What’s in a Cluster? Automatically Detecting Interesting Interactions in Student E-Discussions 7
matches (i.e. Precision) has somewhat lower importance since humans are typically clever enough to filter out irrelevant matches.
Results Our overall results, averaged across all models and maps, are presented in Table 1 along with a comparison of different configurations of the algorithm and the Random Matcher. The DOCE Baseline feature set includes only attributes directly available from the structure of the discussion map (e.g. shape type, link direction, users involved in the cluster), with no text considered. The Text configuration includes annotations from the shape/pair-shape level analysis [5,7] and attributes obtained from the TagHelper linguistic analysis [6]. The weights are set to prefer the text attributes. The Text configuration was experimentally chosen as the best combination of features and attribute weights. The parameter π (ranging from 0 to 100) influences the ordering and balance of the content similarity and edit operations – high (low) values prefer matches with few (many) edit operations at the top positions in the result list, respectively. We present the results with a “neutral” π value (π=50) in order to avoid bias from parameter choice, and the manually tuned value (π=100). Table 1. Overall results and comparison of DOCE algorithm to the Random Matcher Configuration
Recall
Precision
Ranking Quality
Stability
Random Matcher
21,3%
6,6%
0,32
0,5
DOCE (Base, π=50)
62,7%
28,6%
0,51
4,3
DOCE (Text, π=50)
73,0%
35,8%
0,57
5,3
DOCE (Text, π=100)
79,0%
37,3%
0,57
6,2
The DOCE algorithm performs significantly better than the Random Matcher across all measures and configurations as confirmed by t-tests (p