MATHEMATICAL THINKING AND LEARNING, 3(4), 261–287 Copyright © 2001, Lawrence Erlbaum Associates, Inc.
Where There’s a Model, There’s a Metaphor: Metaphorical Thinking in Students’ Understanding of a Mathematical Model Susana Carreira Departamento de Matemática Universidade Nova de Lisboa Monte da Caparica, Portugal
The central question addressed in this article concerns the ways in which applied problem situations provide distinctive conditions to support the production of meaning and the understanding of mathematical topics. In theoretical terms, a first approach is rooted in C. S. Peirce’s perspective on semiotic mediation, and it represents a standpoint from which the notion of interpretation is taken as essential to learning. A second route explores metaphorical thinking and undertakes the position according to which human understanding is metaphorical in its own nature. The connection between the two perspectives becomes a fundamental issue, and it entails the conception of some hybrid constructs. Finally, the analysis of empirical data suggests that the activity on applied situations, as it fosters metaphorical thinking, offer students’ reasoning a double anchoring (or a duplication of references) for mathematical concepts.
There is a substantial agreement on the belief that introducing mathematics applications and modeling in school curricula promotes mathematical topics. The listed advantages of such activities include the often-called psychological argument, according to which mathematical modeling and applications have a positive influence on mathematics learning to the extent that they provide meaning to mathematics (Blum, 1991; Blum & Niss, 1991). There is, however, some apparent triviality Requests for reprints should be sent to Susana Carreira, Departamento de Matemática, Faculdade de Ciências e Tecnologia, Universidade Nova de Lisboa, 2825–Monte da Caparica, Portugal. E-mail: sc@ mail.fct.unl.pt or
[email protected]
262
CARREIRA
in such argument, which may explain why it is eventually attached to the purpose of increasing students’ motivation for learning mathematics. What seems to be missing is a more solid explanation for the conjecture that linking mathematics to reality has qualitative implications in the process of mathematics learning. This study aims to clarify what is involved in undergraduate students’ mathematical thinking when working on applied situations. The research problem focuses on the effectiveness of applied and modeling tasks to make mathematical concepts meaningful and comprehensible (Carreira, 1998). The theoretical approach to the processes of meaning making has evolved around three key concepts: semiosis, mathematical model, and metaphor. From a semiotic point of view, it is expected that both scientific concepts and nonacademic concepts mediate mathematical meanings. The notion that mathematics is a powerful way of describing reality must not overlook the fact that each mathematical description of the world carries in it a certain view of reality and a set of assumptions about what is being modeled. Mathematical models are the result of interpretations and thus require interpreters. From a modeling point of view, exploring mathematics demands paying attention to the potential meanings encapsulated in the use of mathematical tools. It implies recognizing the ways mathematics interact with notions and knowledge about the real world. Finding links between mathematics and phenomena is a semiotic enterprise and a process in which models play a vital part. One way of considering such semiosis is to focus on the notable affinity between models and metaphors. Is metaphorical thinking an appropriate structure to account for the way mathematics can be linked to people’s ideas and perceptions about the world? Our research problem is centered on a dual relation (see Figure 1). On one hand, there is a divergent relation among applied mathematics problems and both the act of interpretation and the unfolding of metaphorical thinking. On the other hand, interpretation and metaphor are in a convergent relation with the production of meanings.
FIGURE 1
From applied problems to the production of meanings.
STUDENTS’ METAPHORICAL THINKING
263
In summary, the research focuses on the kinds of interpretations and the kinds of metaphors students develop in their work on realistic situations and how these aspects of their thinking push forward the meaning of mathematical concepts.
THEORETICAL FRAMEWORK The theoretical framework is motivated by a set of spiraled interrogations. First, concerning the notion of meaning and the process of meaning making, we need to assent on theories and analytical tools to grasp the field of mathematical meaning. What is the role of signs in the constitution of meaning? Is it legitimate to look at signs when in search of meanings? What is the relation among signs, meanings, and interpretations? Second, mathematical models are potential sources for unpacking interpretations. What are the meanings embedded in a mathematical model? In what way may such meanings be seen as metaphorical meanings? Drawing on a semiotic perspective on meaning making and on a conceptual view of metaphor, the theoretical framework provides an outline of some possible links between meaning and metaphor and a discussion of the relation between metaphors and mathematical models. Semiotics and the Concept of Meaning One potentially rich approach to understand meaning making for the context of mathematics learning can be found in the field of semiotics as proposed by Peirce (1931). The Peircian model of semiosis is unavoidably connected to the act of interpretation—that meaning is always the product of an interpretation. Peirce (1931, 1978) developed this thought by proposing a triadic perspective on the constitution and function of signs. To draw on Peirce’s view means to sustain the presence of a thirdness and presupposes to take both the role of the human interpreter and the role of the sign in any account of meaning. Moreover, every semiotic process has a continuous and evolving nature and is conceived of as a sequence of signs. Every sign works on the production of meaning by means of a triangular structure. According to the triangular model (Figure 2), the representamen consists of the perceptible part of the sign, the object is what the sign represents or what it is taken for, and the interpretant is the element that makes the sign mean something to a particular individual in a particular context. The triangular structure of semiosis is suitable as a schematic frame because it moves away from any assumption on a given or ready meaning and, rather, highlights that a sign or representamen is something that stands to somebody for some object in some respect or capacity. To become a sign, any stimulus must be involved in an act of signification, the act in which it receives an interpretation and determines another sign—the interpretant
264
CARREIRA
FIGURE 2
The semiotic triangle.
of the first sign—to the same object. This clearly points to the necessity of a cognizing subject in addition to a signifier and a signified, but it also asserts the role of signs as a condition for the expansion of knowledge and understanding. Learning as Infinite Semiosis Signs are the mechanisms by means of which we are able to learn something else (Peirce, 1978). Learning is conceived as an endless chain of interpretants, with each interpretation always supplying a cognitive development of a given sign. Consequently, the production of meaning ensures an increase of knowledge. Meaning is the outmost expression of going beyond the sign through the enchaining of successive semiotic relations. A sign can only become clear in its meaning when it sends to an interpretant, which, in turn, sends to another interpretant and so forth ad infinitum, in a unlimited semiosis process in which the receptor decodes the original sign (Eco, 1981). In Vile’s (1996) words: A sign becomes significant only through its relationship with other signs and thus the meaning of a sign is virtual, only retaining that meaning by virtue of the possibility of being inserted into further acts of semiosis as a sign. (pp. 43–44)
The unlimited semiosis, that is, the unfolding of interpretants, is the process by which a sign may refer back to another sign or string of signs and, at the same time, can become a reference for a future sign. Metaphor and Metaphorical Thinking A decisive claim in the contemporary theory of metaphor (Lakoff, 1987, 1993, 1995; Lakoff & Johnson, 1980) is that our conceptual systems, and consequently all human thinking, are metaphorical by nature. A conceptual metaphor is defined as a correspondence between two conceptual domains. It consists of a mechanism that allows us to understand one domain in terms of another, usually more familiar or closer to our daily experiences. In the
STUDENTS’ METAPHORICAL THINKING
265
words of Lakoff (1993), this correspondence is a real mapping or projection from an origin domain onto a target domain. Focusing on the mechanisms involved in metaphorical thinking, a first assumption must be made: the possibility of identifying two distinguishable topics, the primary topic (target) and the subsidiary topic (origin). Each topic works as a conceptual system rather then just a number of disconnected elements. A second postulate expresses the feasibility of developing connections and relations between the two systems. The presence of the primary topic in a metaphorical statement induces the selection of particular attributes of the secondary topic, which shape and generate a complex of implications that are projected onto the primary topic. As an outcome, a parallel complex of implications appears within the primary topic. The fundamental result of the metaphor is the selecting, emphasizing, suppressing, and organizing of characteristics of the target topic by suggesting and stressing ideas about it that would normally be applicable to the origin topic. As a kind of filter, the metaphorical projection is such that the secondary complex of implications can be seen as a model of the properties and characteristics of the primary topic (Black, 1962, 1993). Thus, metaphor is granted a powerful cognitive function. Metaphors not only allow for the creation of connections but also make them present and active in our processes of understanding reality. The Iconic Momentum of Metaphor The contribution of analogy and resemblance to the explanation of metaphor is not unanimous among different theorists. Whereas some defend analogy as the basic cause of any metaphorical thinking, others such as Black (1962) firmly reject that resemblance is the source of metaphor. The work of Ricoeur (1983) gives a possible way out of the conflicting views. The concept underlying his theory is the iconic momentum of metaphor. In accepting that metaphor has an iconic nature, Ricoeur admitted that the icon is not rendered by the metaphor. A metaphor is rather a formula for the creation of icons. This way, metaphor is not synonymous with image because metaphor does not immediately display the resemblance. The metaphor works iconically by indirectly unveiling a resemblance, and because it is not an image, it has the power to point out new similarities. In metaphor, the literal value of some terms becomes interdicted; a semantic conflict is generated. However, metaphor is not the conflict itself—metaphor is the resolution of the conflict. Overcoming such conflict requires setting up a parallel between situations, a parallel that will guide the iconic transference from one situation to the other. The semantic collision is just one side of a process that has iconicity as the other side (Ricoeur, 1983). The metaphorical statement triggers the analogy, but rather than being its cause or reason, analogy is the result of the metaphor. The use of a metaphorical predi-
266
CARREIRA
cate is comparable to a screen, a lens, or a filter that selects, eliminates, and organizes the signification of a certain domain.
The Semiotic Trapezoid: Linking Metaphor and Meaning Ricoeur’s (1983) thesis on the iconicity of metaphor is based on the idea of a duplication of referents within metaphor. A metaphorical sense is motivated by the failure of a literal interpretation (e.g., in the utterance, “time is money”). This means the suspension of a primary reference and the emergence of a secondary reference to be called a metaphorical reference. The fall of the literal interpretation is the condition for the progressing of a new referential liaison. The iconic momentum of metaphor is a reflex of this duplication process. There is a certain previous use of words that creates a kind of stereoscopic view. A new state of things is realized when the semantic paradox is broken. Proximity is installed between signifiers that were formerly separated. This proximity stimulates the creation of an icon. Suddenly, things that were different become similar in some way or in some aspects. To account for two simultaneous thoughts on different objects (e.g., money and time), an extension of the semiotic triangle is required. Such extension, in the form of a semiotic trapezoid, is proposed as a semiotic model of metaphor (Carreira, 1998). In assuming the role of two referents and two interpretants in metaphorical meaning, I postulate an interactive relation between these elements (Figure 3). To think metaphorically is to think by means of duplicated referents. The analogy comes from the approximation of two conceptual grounds, which in turn generate the nearness of two things.
Metaphors and Models: A Question of Precedence Mathematical modeling is usually described as the process by which people conceive a situation or real problem in terms of mathematics. A mathematical model is
FIGURE 3
Duplicated referents and interpretants in a semiotic trapezoid.
STUDENTS’ METAPHORICAL THINKING
267
consequently understood as a representation of a certain part of the real world by means of mathematical structures and concepts (Blum & Niss, 1991; Edwards & Hamson, 1990; Galbraith, 1995; Niss, 1989). Given the apparent closeness between the notion of mathematical model and the notion of conceptual metaphor (Black, 1962; Krumholtz, 1989; Lopez-Real, 1989, 1990; Pimm, 1995; Santos, 1994), it seems relevant to ask if a mathematical model is a metaphor and if mathematical modeling is an equivalent process to the production of metaphors. A first approach involves consideration of the fact that mathematical modeling requires a certain form of looking at reality, namely, it requires a mathematical point of view. However, to adopt a particular point of view is to make use of metaphors: Metaphors make a kind of perceptive and cognitive organisation system that is previous to the consciously performed selection of the theoretical and scientific models of explanation. … They pre-orient the look towards particular objects, they predispose the attitude with which (and the expectations in face of which) the conscious tasks are conducted. (Santos, 1994, p. 40)
Just like metaphors, models also make the coupling of distant topics through a characteristic operation of transfer between cognitive domains. About the relation between models and metaphors, Black (1962) claimed that, in a metaphor, the complex of implications extracted from the subsidiary topic is a model of the attributes that are to be found in the primary topic. The metaphor supports the model, or alternatively, there is a submersed metaphor in every model. This is a first step toward discerning the similarities and distinctions between metaphor and model. To build up a mathematical model of a certain phenomenon requires some articulation between two conceptual domains, but to develop such interconnections there must be a metaphor. The interactive links between the two domains can only be produced under the existence of a metaphor. Embedded in the metaphor are the needed ways of projecting inferences from one domain to the other. Therefore, the metaphor acts as the primordial element in the construction of models, and once in action it provides the semiotic mediating structure between two domains. The metaphor is necessary to the existence of the model. On a similar train of thought, Santos (1994) offered a major criterion to distinguish model from metaphor by claiming that metaphor is a priori in informing and structuring our thinking. Santos also saw the model as carrying the memory of what he called a metaphorical matrix. In a certain sense, the model consists of an emptied metaphor from which only the formal and abstract aspects were preserved. The model is what comes to the surface after the metaphor is produced. It shows the formal, abstract, and most schematic features of the metaphor, after the sublimation of its sensorial content and experiential foundations. The modeling
268
CARREIRA
process has a metaphorical genesis, and the meanings of the metaphorical matrix are what make the model meaningful. To conceive of mathematical modeling as a consequence of a more general metaphor production denotes that mathematics is not to be seen as something timeless, immutable, and objective, waiting to be retrieved and used to describe certain parts of the physical world. On the contrary, as stated by Lakoff and Núñez (1997), mathematical ideas, even the most abstract ones, are the result of a coordination of meanings and of a search for patterns based on imagination and metaphorical thinking. The information to be extracted from a mathematical model can only be derived from the metaphorical thinking that makes the model as a model of something. A whole net of metaphorical ideas must be activated, and this is what opens a field of meanings in the intertwining of basic and abstract ideas, new and previous knowledge, formal and informal concepts. Each concept on the net may be tied to several metaphors, and each metaphor may be linked to several concepts. Such metaphors are responsible for a duplication of referents and a duplication of interpretants in the meaning-making process.
THE EMPIRICAL STUDY Research Method Students’ metaphorical reasoning was investigated in the context of applied problem solving during a calculus course for first-year university students of business (Carreira, 1998; Moreira, 1996; Moreira & Carreira, 1998). The curriculum involved the study of the fundamental ideas of calculus with functions of one and several variables. The course assumed an innovative perspective that diverged from the traditional curriculum and teaching practices. The tenets of the curriculum included (a) work on relation between one-variable functions and several-variable functions, (b) emphasis on connections between mathematics and reality, (c) students’ cooperative work on applied problem situations, (d) students’ oral presentations of the work developed, and (e) whole-class discussions on critical mathematical models and applications of mathematics. From a methodological point of view, the research design assumed the double character of teaching experiment and curriculum development program, in which the teacher and the researcher shared responsibilities and negotiated their roles and purposes. Prior to the beginning of the academic semester, the teacher and the researcher worked on a regular basis on the pedagogical principles and strategies, the content structure, the planning of classes, the materials to be used, and the evaluation methods to be developed. One premise that became central to the structure of the
STUDENTS’ METAPHORICAL THINKING
269
calculus curriculum was privileging the activity of mathematization to the mastering of mathematical techniques and to the proficiency on specific topics. Traditionally, the students enrolled in this type of course, which is compulsory as part of the undergraduate studies program in business, face difficulties in passing examinations and develop a negative attitude toward mathematics. Particular attention was devoted to avoiding a compartmentalization of mathematics and to stressing the importance of making connections between mathematical topics. It was intended to involve students in a variety of activities regarding problem solving, critical thinking, and communication, which did not confine them to a passive status of acquiring the necessary training to answer standard examination questions. The course involved two classes of students comprising a total of 65 participants. Each class had 6 hr of teaching per week, divided into two sessions of 1.5 hr and one session of 3 hr. The two classes were combined weekly during the longer session. In each class, students were organized in groups of four or five. The possibility of joining the two classes once a week allowed the articulation of the work developed in both classes. Therefore, the basic structure of the activities consisted of a sequence of thematic units, integrating specific tasks for each class and common tasks to both classes. Every unit started with the two classes separated and finished with the two classes joined. A sequence began with one or more applied problems and concluded in a 3-hr period, in which one group from each class made an oral presentation of the work produced. In a subsequent moment, the teacher raised questions and promoted a general discussion that motivated the theoretical systematization and organization of the mathematics arisen from the problems.
Data Collection and Analysis The researcher observed and participated in all the classes for a period of 13 weeks. Participant observation was one of the main methods of data collection. Furthermore, as the research problem demanded a focus on students’ activity and verbal interactions, two groups of students (one from each class) were audio- and videotaped throughout the class time. The groups selected were heterogeneous in terms of gender and academic achievement. The data collected were organized in a corpus consisting of transcripts of students’ dialogues, records of their actions and interactions from the videos, and written reports produced by the students. In a first phase, the researcher started by reviewing the video records, then made a preliminary review of the audio transcripts, and finally summarized the key issues of students’ written reports. This phase corresponded to a first analysis of the data. Some general ideas and patterns were produced in terms of the identification of episodes that revealed some unity regarding students’ production of meaning.
270
CARREIRA
In a second stage, a deeper and more extensive analysis focused on the transcripts and written essays. Each of the episodes previously delimited was further reviewed to formulate possible semiotic itineraries that would make sense of the activity developed within the group. A more refined examination of the dialogues and discourses was then necessary. The metaphorical instances of thinking were tracked and compared with the interpretations students had developed on aspects of the problem and of the mathematics involved. The third phase was centered on the cartography of each episode. The analytical frames were elaborated based on the presence and interplay of the following elements: prominent signs and interpretants, metaphorical statements and links between different conceptual systems, instances of duplicated referents in students’ interpretations, and semiotic chains occurring in the exposure of understanding. The final elaboration resulted in a set of analytical protocols or narratives combined with interpretative comments that aim at presenting empirical evidence from a theoretical point of view (Erickson, 1986).
The Utility Context of a Problem Situation This article provides a piece of the empirical material, concentrating on one of the analytical protocols, which involves a group of four students working on a problem situation that addressed the utility of wine and beer. For a brief account of the problem context, some economical notions are outlined. Economists have developed mathematical models that can be used to make predictions about the consumers’ behavior. Problems such as stock management, advertising campaigns, and production rates are closely related to the possibility of controlling the utility of a certain good to the consumers. One method to evaluate and objectify the subjective notion of utility is asking the consumer’s preferences regarding different baskets of some goods, such as the case of wine and beer. In changing the amounts of wine and beer that hypothetically would be consumed by a person, one asks the consumer to decide on the relative preference for each basket. Those baskets that are indifferent to the consumer are assigned a relative value and thus define what is called an indifference curve. The set of indifference curves makes a map of indifference and provides a portrait of the consumer’s utility in the consumption of wine and beer.
ANALYSIS OF STUDENTS’ PROCESSES OF MEANING MAKING Students were given some information on a particular model describing the utility of wine and beer:
STUDENTS’ METAPHORICAL THINKING
271
We say that two commodities are considered competitive when the consumer tries not to exclude the consumption of either of them. Assuming that the consumer’s satisfaction can be measured in some way, economists have created the notion of utility to describe the degree of the consumer’s satisfaction. In particular, this concept may be used to describe the utility of both wine and beer to a certain consumer. Consider the utility function U(x, y) = (x + 1)(y + 2) as representing the utility that a certain consumer gets from the consumption of x units of wine and y units of beer. Their subsequent activity evolved around open questions that guided their exploration and investigation of the model. Those questions are stated at the beginning of each episode. Episode 1: How Can the Consumer Obtain a Particular Utility? Students started to work on the question of finding different possibilities of consuming wine and beer that produced a particular arbitrary utility. They chose a certain value for the utility (U = 100) and decided to keep one of the two independent variables unchanged. 01 Eduardo: What about making U equal to 100? 02 Cristina: OK, we’ll have 100 = (x + 1)(y + 2) … [she continued making calculations in her notebook]. 03 Eduardo: What are you doing, now? 04 Cristina: I’m solving the equation for one of the variables. 05 Eduardo: What variable, the y or the x? 06 Cristina: We can do it for the x. Cristina made the necessary algebraic transformations, and she got the equation 98 – y = x that expresses x in terms of y. y+2 07 Cristina: Here’s the formula … one possibility could be … 08 Eduardo: So, if y equals 2 … 09 Isabel: Using the formula we can know exactly … we get 96 over 4. 10 Cristina: It’s 24. It gives us 24 units of wine. 11 Miguel: All right, then. We have 24 units of wine and 2 units of beer for a satisfaction of 100. 12 Cristina: Let’s try another hypothesis. If we make y equal to 10, then … [she uses her calculator] we get x equal to 7.33. It’s done.
272
CARREIRA
13
Isabel: So, the more they have beer the less they have wine. If they drink more of one they will drink less of the other. It’s quite understandable … 14 Eduardo: Yes, it is. When we increase the amount of beer, the amount of wine decreases. So, for the same degree of satisfaction, the more beer you take, the less wine you’ll need to take. 15 Cristina: Exactly. We can say that if we increase one of the variables, the other decreases. There are many possibilities. If we just increase the amount of beer, the amount of wine will immediately decrease, but the satisfaction won’t change. It’s a matter of the consumer’s option … to get a counterbalance. 16 Eduardo: That’s it. We’ve got the explanation.
Signs and interpretants. There are several obvious references to common phenomena in students’ thinking as they tried to make sense of the concept of utility and of the particular model they were given. Their first conceptualization of the problem came from realizing many possible ways of ensuring a certain utility. Then, some particular signs became central in their production of interpretants: “the more … the less,” “increase … decrease.” One may follow students’ enchaining of interpretants where drinking more or drinking less were tightly bounded with the manipulation of the two-variable equation. An increase in the amount of beer causes a decrease in the amount of wine. Isabel expressed this idea when she stated that “the more they have beer the less they will have wine” (line 13). This student considered the fact reasonable and understandable and the other members of the group seemed to follow her idea. Exploring the grounds on which this reasonability stands, we are led to the notions of substitution and compensation. An increase of beer is compensated with a decrease of wine. Therefore, beer takes the place of wine. Having more beer means having it instead of some amount of wine. Eduardo brought in that particular idea by saying that “the more beer you take, the less wine you’ll need to take” (line 14).
Metaphorical thinking: The counterbalance metaphor. An instance of metaphorical thinking shows up in students’ perception of the monotony of the function that gives the amount of wine depending on the amount of beer. It is called the counterbalance metaphor. This metaphor projects the meaning of compensation, “if we just increase the amount of beer, the amount of wine will immediately decrease” (line 15), onto the mathematical behavior of the utility function, “if we increase one of the variables, the other decreases” (line 15). We see how the model reveals the underlying metaphor and how the idea of counterbalance gives meaning to mathematical aspects of the utility model. It became clear to students the multi-
STUDENTS’ METAPHORICAL THINKING
273
ple choices the consumers have, provided that they can balance the consumption of wine and beer. At the same time it means the existence of infinite solutions to the equation U(x, y) = 100. Going deeper into the structure of the counterbalance metaphor, the interaction between two conceptual domains may be described as follows: • • • • • • • •
The value of U depends on the values of both x and y. The consumers’ satisfaction depends on both the amounts of wine and beer. The equation U(x, y) = k has infinite solutions. The same degree of satisfaction may be obtained with different combinations of wine and beer. If the variable y increases, the variable x decreases. An increase of beer consumption yields a decrease of wine consumption. Each variable decreases when the other increases. Wine and beer compensate each other to produce the same utility.
There is a duplicated reference and a duplicated sense for the meaning of counterbalance in this metaphorical pattern. On one side, to compensate is to substitute part of one drink for some of the other. It suggests a kind of negotiation toward preserving satisfaction—gain something but lose something. On the other side, counterbalance summarizes what the utility model tells about covariation. It represents the pattern according to which two explicit functions behave in terms of their monotony. If y increases, then x decreases, and if x increases, then y decreases. It also means an understanding of the two different one-variable functions, extracted from the mathematical model. Students’ interpretations and mathematics learning from the utility preserving question may be described in terms of semiotic mediators. Such mediating mechanisms have a metaphorical nature and fit the semiotic trapezoid (see Figure 4). Two references and two interpretants are supporting the mathematical thinking: If the model says something about covariation, the common sense and physical expe-
FIGURE 4
The semiotic trapezoid in students’ counterbalance metaphor.
274
CARREIRA
rience of finding alternatives to achieve satisfaction says something similar. The mathematics embedded in the model is disclosed in students’ reasoning as the counterbalance metaphor.
Episode 2: What Happens to the Utility When the Amount of One Drink Is Kept Unchanged? Students were then asked to investigate how the utility changes when the amount of one of the two goods is kept constant and the other varies. 17 Eduardo: Let’s make x equal to 4. 18 Cristina: The result is U = 5y + 10. Now let’s make a test. Giving y the value 2, yields U = 20. That’s the case of y equal to 2. Now, what happens with y equal to 4? Of course it must increase … if we’re assuming there’s more consumption … 19 Isabel: Shall we make a graph for that? 20 Cristina: There’s no need. It’s obvious that it could only increase. 21 Eduardo: The function is increasing. 22 Cristina: Sure. But what does it mean in the real situation? 23 Isabel: It means that for getting a greater satisfaction you’ll have to have more beer. 24 Eduardo: I don’t believe it’s quite that. 25 Miguel: What it means is that if we keep one of the variables fixed, the utility increases as the other variable increases. 26 Eduardo: And what would happen if we had given the amount of beer the same constant value and made the wine increase? 27 Isabel: The utility would increase but with larger increments. 28 Cristina: Yes. Because of this 2 which is larger than 1 [she compared the two factors in the expression of the utility function]. 29 Isabel: The utility will also increase but this time faster. That’s what we should conclude. 30 Cristina: Shall we check that? 31 Isabel: So, let’s do it. We make y equal to 4. 32 Cristina: That’s U = 6x + 6. If we compare it with the previous one, the conclusion is the one you mentioned. Here, the utility also increases with x, but it does it faster than before. Students reached the idea that each of the two goods has a distinct influence in the increase of utility. The power of each good to make utility grow is weighted. In particular, they concluded that wine has a stronger contribution than beer to the consumers’ utility. To a certain extent, the process of changing each variable into a
STUDENTS’ METAPHORICAL THINKING
275
parameter made possible to think of two utilities, although the model expresses utility as a function of the amounts of both wine and beer.
Signs and interpretants. Looking at the flow of interpretants in students’ meaning production, the leading signs focus on increasing processes. First were several combinations of “increase,” “more consumption,” “more beer,” and “greater satisfaction,” which converge to the notion of a general type of linear positive growth. Later, the issue of different linear patterns was raised, and other signs became central: “but with larger increments,” and “increase but faster.” The sign but must be underlined in this new chain of interpretants as it renders the fact that students were making distinctions, finding differences, and discovering details that reveal new aspects of the phenomenon. A deeper understanding of the mathematical model impelled students to a new way of seeing the reality of compensation or substitution. The new perception is that the way both goods compensate each other is not equivalent. The influence of each product in the consumer’s utility is not the same, and in particular, wine has a bigger weight than beer in deciding the utility.
Metaphorical thinking: The weighted counterbalance metaphor. Throughout this interpretation process, the counterbalance metaphor was refined and amplified. The idea of replacing beer for wine or wine for beer was given a second inspection. In fact, the consumer’s choice shows how the wine is more valued than the beer. Compensation does not mean permutation. One cannot just take a certain amount of one good and replace it for the same amount of the other good. Wine and beer are competitive goods but not equivalent from the consumer’s point of view. There was an opportunity to extend the counterbalance metaphor to a weighted counterbalance metaphor: • U(x, c) = (x + 1)(c + 2) increases faster than U(c, y) = (c + 1)(y + 2), for a constant value of c. • Wine is preferable compared to beer. • To permute the variables x and y does not yield the same output for U. • Wine and beer are competitive but not equivalent in what concerns the consumer’s options. The mathematical model of utility unfolds as a metaphorical net of concepts. Even though it is possible to have many ways of getting a certain utility (counterbalance), that does not mean that each item consumed has the same influence on the consumer’s satisfaction. Different linear rates of change are given a meaning
276
CARREIRA
and are used to explain something new about the consumers’ way of acting (weighted counterbalance). Episode 3: Why Are the Level Curves U(x, y) = k Called Indifference Curves? Students proceeded with their inquiries as they were confronted with the definition of level curve. It was explained to them that such curves in economics are usually called indifference curves. They were then asked to interpret the designation of indifference curves in the given context of the utility model. 33 34 35
36 37
38 39 40
41 42 43
44 45 46 47
Cristina: I have heard of level curves in cartography, and I worked a lot with that. Isabel: But that kind of curves is only used in economics. Cristina: Excuse me! In cartography there are also level curves! If you want to represent the terrain elevation on a system of axes, you get something like this [she makes a drawing in her notebook; see Figure 5]. You can mark the heights above the sea … for instance 200 meters, 300 meters. Isabel: No. In economics it is different, it’s like this [she makes her own sketch; see Figure 6]. Cristina: In geography, level curves are usually defined with the help of a land survey, that is, a collection of data on the elevation of the land. Eduardo: Those curves indicate different altitudes on a map. Cristina: Well, in economics it must be something of the kind, I mean, in the same line of reasoning. Isabel: No. What I think is that it must be more or less this … to have the same degree of satisfaction, we have to … follow one of these curves. Cristina: What you’re saying is that to get the same satisfaction, if the amount of beer increases, the amount of wine must decrease. Isabel: Each of these curves is one utility … Cristina: Yes, it shows that utility is always the same. And to have the utility unchanged, the variables have to change. If one increases, the other decreases. Miguel: Each of the curves gives a different relationship between the variables x and y. Cristina: Of course. It’s like in geography. For instance, this utility is different from that one. Miguel: But along each curve the utility doesn’t change. Cristina: It only changes from curve to curve.
STUDENTS’ METAPHORICAL THINKING
277
FIGURE 5 Christina’s representation of level curves.
FIGURE 6 Isabel’s representation of level curves.
Signs and interpretants. A very powerful semiotic chain can be traced from the way students thought about the concept of level curve. At first, two of the students showed different conceptions of level curve, one coming from the field of cartography (line 33) and the other from economics (line 34). They tended to see it as completely independent things, and there seemed to be no clear connection between their contrasting sketches of level curves. Despite the apparent disconnection, students struggled to find some way of bridging the two conceptual domains. Cristina, for instance, tried to add information on the process underlying the depiction of level curves (contour lines) in cartography (lines 35, 37). She talked about altitude, about a land survey, and explained how the different curves indicate different heights on a map. On the other hand, students recognized that, in economics, more concretely in the context of the utility model, level curves outline points for which the utility remains constant. They understood these curves as representations of the relation between the independent variables for a certain constant value of utility. The sketch produced by Isabel shows that they kept the idea that the increase of one variable corresponds to a decrease of the other. This is clearly in consonance with their previous analysis of the utility function. In students’ attempts to interpret the concept of level curve we can identify a chain of meanings. There is a sequence of interpretants for the idea of level curve, each of them tied to a certain referential domain:
278
CARREIRA
• Representation of terrain elevation: “cartography,” “land survey,” “elevation of the land,” and “different altitudes on a map.” • Path defining a certain constant utility: “economics,” “the same degree of satisfaction,” “follow the curve,” and “along each curve the utility doesn’t change.” • Depiction of the counterbalance metaphor: “if the amount of beer increases, the amount of wine must decrease.” • Icon for the various combinations that preserve utility: “each curve is one utility” and “this utility is different from that one.” • Representation of the relation between x and y, for a given value of U: “the variables have to change,” “if one increases, the other decreases,” and “a different relationship between the variables x and y.” In the end, Cristina seems to have realized the connection between the notion of level curves in the two contexts (line 45). However, it took the other students some more thinking and arguing to cross over the borders between the two domains. The fact that learning is supported by evolving meanings that can be pushed by other meanings, in a nonlinear process of semiosis, is well illustrated by the contrast between the previous transcript and the one that follows. In the succeeding dialogues, another sign, formerly dismissed, became a crucial turning point to the creation of new relations and interpretations for the concept of level curves. 48 Isabel: Each curve is a different level of utility. 49 Eduardo: But why are they called indifference curves? 50 Cristina: Because regardless of the values of the variables, the utility is indifferent. 51 Eduardo: I see. They’re indifference curves because each curve has always the same level of utility. A curve is different only in relation to the other curves. 52 Cristina: The utility stays constant. Only the x and y change to make the utility unchanged. 53 Isabel: But what has that to do with cartography? 54 Cristina: It must have something. Look, I have this mountain. This inside area tells me the maximum height … 55 Eduardo: The point is that you have several levels. Except that here you have utility levels. Here the mountain is the utility. The consumers’ satisfaction is also rising, isn’t it?
Metaphorical thinking: The mountain metaphor. The sign “level” was largely responsible for the opportunity of putting the two domains in connection: “height level” and “utility level.” Students persisted in finding some way of bridg-
STUDENTS’ METAPHORICAL THINKING
FIGURE 7
279
The semiotic trapezoid in the metaphorical meaning of level curve.
ing the two conceptual fields. They wondered what the possible link may be, and in their search they came up with a metaphor to explain it—“the mountain is the utility” (line 55). The following is an outline of the implicit mapping contained in the metaphor (see Figure 7): • • • • •
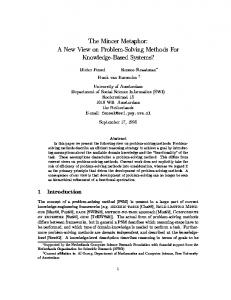
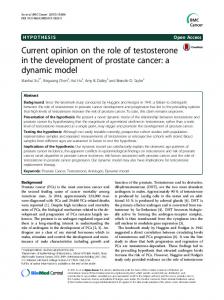
In a mountain there are several height levels. Consumers experience different levels of satisfaction. The mountain rises up. The utility increases with the increase of consumption. To walk on a level curve of a mountain is to keep a certain altitude, despite the change of position. • To follow a level curve of utility is to preserve a certain satisfaction, despite the change of the amounts of wine and beer. The mountain metaphor not only solves the problem of coupling two conceptual fields but also integrates aspects of the mathematics students had already explored and analyzed. The double anchoring, which is visible in this metaphor, also reveals how students brought into their reasoning their specific knowledge and familiarities with different meaningful contexts. The use of the notion “rising” to talk about the consumers’ utility is a good indicator of the way metaphor became a powerful mechanism to understand and express the mathematics involved in the notion of indifference curves. Episode 4: Indifference Curves and the Difference Between Wine and Beer At some point, the teacher introduced a few computational graphs representing the utility function (see Figures 8 and 9). Those graphs showed different views of the three-dimensional representation of U(x, y) and the level curves of U(x, y) in the XOY plane.
280
CARREIRA
FIGURE 8
One view of the graph of the utility function.
FIGURE 9
The level curves of the utility function.
Students were then asked to compare the different graphs and to explain the representation of the level curves. 56 Cristina: Look, each of these curves has a number on it … 57 Eduardo: It’s the number that tells the level of utility. 58 Cristina: So, it means that along this curve … 59 Eduardo: The utility level is constant.
STUDENTS’ METAPHORICAL THINKING
281
60 Isabel: But there may be different utility levels. 61 Eduardo: Depending on the degree of satisfaction. 62 Isabel: If we keep the beer unchanged and increase the amount of wine, the utility increases. This forces us to jump to another utility level. 63 Cristina: Yes, we’ll have a higher utility. 64 Miguel: It’s almost as if we draw a line here and we were moving along it [he draws the horizontal line y = 2 on the map of indifference curves]. 65 Isabel: I don’t get it. What’s the point of that? 66 Miguel: Well, we have fixed one variable, which is the y, here. When you move along the line to the right, the x is increasing, right? So, you’re going from one utility level to the other, and to the other, and each time it’s a higher one. 67 Isabel: Oh, I see … you have fixed the y, which is the beer. Then you’re having 2 units of beer and the amount of wine keeps increasing. So, when you reach the 10 units of wine, here … you have crossed … 68 Miguel: Several utility levels. 69 Isabel: Look how you get with 2 units of beer and 10 units of wine! … Students laugh at Isabel’s comment and make jokes on the hypothetical poor state of Miguel, as a result of such amounts of wine and beer. 70 71
Cristina: OK, but does this work for other cases? I mean, if you had it reversed, maybe you wouldn’t get that drunk … Isabel: But he wouldn’t get as much satisfaction either, according to what we have found out.
Students did some more laughing about the subject and afterwards returned to the problem. 72 73 74 75 76 77 78
Isabel: Now, I’m serious. They prefer wine to beer … Cristina: She’s right. I’ve taken a note on it. When we fix the amount of beer, the increase of utility is faster. Miguel: OK, in that case, we should reverse it. It’s the x that should be equal to 2 … so it’s on a vertical line. Isabel: Yes, so draw the line. Miguel: It gets up to here. It goes over the 30, doesn’t it? Cristina: So it happens in this one [the horizontal]. Look, it gets over the 40! Miguel: I know. But here [on the vertical] it doesn’t get so far, that’s the difference.
282
CARREIRA
Signs and interpretants: Jumping across utility levels. The map of indifference curves acquired a supplementary meaning because students could read and interpret it in many ways. It is especially relevant that further interpretations were able to include and extend students’ findings and metaphorical reasoning about the utility model. They started by noticing the values labeling the curves and concluded that they indicated the several utility levels. An indifference curve was meaning the conservation of utility and, at the same time, was showing a path along which the consumption of the two goods was changing. The variation of the consumer’s satisfaction was conceived as moving from one level curve to the other. In a very inspired way, Miguel brought the idea of increasing just one of the variables and suggested a horizontal line on the graph that crosses the successive level curves (lines 64, 66). Building on that idea, the act of taking one variable as a parameter is given a relevant new interpretation. To fixate one of the variables means—in terms of the indifference map—to trace a straight horizontal or vertical line. Where the line intersects the indifference curves one finds the different values of the utility function. By means of concrete references, students were able to interpret the change of satisfaction when having two units of beer and an increasing amount of wine. They managed to see how the consumer experiences several utility levels in an increasing order. They also verbalized it in terms of jumping from one utility level to another (line 62). After some amusement, taken from the implicit idea of too much drinking, students also retrieved the notion that beer and wine do not have the same influence on the consumer’s satisfaction (lines 71, 72). Hence, taking a vertical line or a horizontal line yields different results (lines 74–78). Their conclusion was confirmed: “They prefer wine to beer.” The different weights of wine and beer in the production of utility took on new interpretants that came from the exploration of the map of indifference curves. They were activated by the process of shifting from curve to curve when following a straight horizontal or vertical line. In addition, the transformation of a variable into a parameter received a new enlarged signification, confirming some of students’ findings with algebraic methods. In particular, it sustained the idea that wine and beer are competitive but not equivalent, which is one of the important features to be discerned from the mathematical model of utility.
RESULTS Mathematical Models as Gateways to Metaphorical Thinking Our research problem concerns the type of metaphorical thinking and the processes of meaning making students have developed.
STUDENTS’ METAPHORICAL THINKING
283
The data analysis points to the emergence of a net of metaphors strongly combined with the mathematical aspects and properties of the mathematical model. The questions students have worked on were related to both concrete and common phenomena, such as consumption and satisfaction, and to abstract and formal concepts, such as utility and functions. To some extent, such questions were a stimulus to their transfer ability. One relevant feature of the metaphorical sequence—counterbalance, weighted counterbalance, and mountain—is the fact that metaphors appeared as part of students’ understanding of the mathematics surfacing from the exploration of the mathematical model. This may be the reason why such metaphors developed as a consistent net. Each metaphor extended some aspects of the others; they all incorporated and rearranged pieces of knowledge embedded in the others. The overall students’ activity revealed a continuous process of approximation between concepts and domains. For example, satisfaction became a way of thinking about utility, and indifference curves were related to contour lines on a topographical map. Why was students’ thinking sustained by such metaphorical mechanisms? The first answer—the one asserting that metaphor is inherent to all human cognition—may now be supplemented with a more local analysis. When students are offered realistic problems that involve modeling or the use of models, they are challenged and compelled to unpack the metaphorical matrix underlying the mathematical modeling. Once the construction of the metaphorical scaffolds takes place, that is, once the metaphorical senses start to be appropriated, the activity of adopting alternative points of view becomes valid and beneficial. It means an advance in terms of conceptualization and structuring of ideas. Through its iconic potentiality, the metaphor opens up the scope of possibilities and interpretations. It provides a double anchoring for the production of interpretants; it offers duplicated references by linking different objects and referential domains. Indifference curves were seen as contour lines representing the height of a mountain, but they were also found to represent the way wine and beer compensate each other and were even used as a form of visualizing the fact that beer and wine have different effects on the utility. All such notions and ideas had further mathematical counterparts, which means that they interacted with important mathematical concepts. Students developed a deep understanding of the mathematical key aspects of the problem situation. For instance, they were able to make sense of the role of two independent variables in an equation with infinite solutions, to describe the behavior of each variable in terms of the other, to recognize different linear patterns from different parameterizations. However, the mathematics explored within the problem situation was always given some sensible and tangible meaning from its relation with equally sensible and tangible references—many possible consumers’ choices, more of one and less of the other, and wine preferable to beer.
284
CARREIRA
Another significant issue is the fact that metaphors, once produced, were kept active and accessible throughout students’ reasoning on subsequent questions. The data showed that metaphors grew in power and speculative strength as new metaphorical nodes were formed. That is a fundamental result because it suggests that applied mathematics problems can drive and sustain the production of metaphorical nets. To think metaphorically seems to be an intrinsic part of the work of applying mathematics. The mathematical model can only be the model of some phenomenon when its metaphorical matrix is uncovered.
Semiosis and Mathematical Meanings Applied mathematical problems hold unique qualities that make them capable of triggering the production of metaphorical thinking. It remains to explain the cognitive mechanisms that allowed students to move from the mathematical models to the metaphorical nets. We found evidence of the mediated nature of meaning in the way students engaged in the process of enchaining interpretants. The notion of infinite semiosis matches students’ systematic production of interpretants. Their findings and associated meanings were an outcome of such interpretations. Students were regularly drawing on their conceptual repertoire to understand and make sense of the mathematics involved in the problem. In many of students’ significant conclusions, the mathematical reasoning flowed as an extension of their experience, everyday knowledge, formal knowledge, and possibly embodied knowledge. Some notions, such as balancing the two commodities or seeing the utility rising or jumping across utility levels, indicate a bodily basis of interpretants production. Particular signs played a special role in students understanding of the utility problem. Expressions such as “the more, the less” were used to describe the mathematical outcomes of the model manipulation, and the utterance “increase but faster” appeared in the explanation of the different influence of wine and beer. The sign “level” prompted a viable interaction between the concept of level curves in two separated domains. Such examples are an indicator of how students’ meaning making was filtered by a diversity of semiotic chains. Specifically, mathematical meanings were the result of that filtering process. The more interpretations were performed, the more students’ mathematics understanding was refined. This was particularly evident in the discussion regarding the map of indifference curves when the geometric parameterization came into play. Students’ ongoing activity showed how mathematics provides forms of describing and organizing real-world phenomena, how the concrete experience can be projected onto mathematics, and how mathematical objects can rebuild other mathematical objects. Students’ production of meanings indicate that theoretical
STUDENTS’ METAPHORICAL THINKING
285
notions can become familiar objects as everyday notions can become part of theorization. A special case of semiotic mediation is the instances of metaphorical thinking in the production of meanings. The duplication of references was considered essential and corresponded to a trapezoidal relation among sign, object, and interpretant. In the same cognitive act—the iconic momentum of metaphor—students were able to reach double interpretants that completed and explained each other. From the data it becomes clear that metaphorical meaning is a doubly anchored meaning. Applied problems involve models. The understanding of a mathematical model impels the unveiling of metaphors. The metaphorical meaning does not restrict itself to just one referential domain but rather requires elements of different systems. The duplication of referents entails a duplication of interpretants, and a doubly anchored meaning is created. Such is a possible way of understanding the role of applied mathematical problems in the production of mathematical meanings. Metaphorical thinking as a way of projecting inferences from one domain onto another discloses the known in the unknown and generates new ideas from previous ideas.
CONCLUSIONS A general conclusion that emerges from the analyzed data is the fact that mathematical modeling and applied problem solving offer a productive context for the opening and flowing of metaphorical thinking. The meanings induced by this kind of semiotic mediation include powerful mechanisms for the learning and understanding of mathematical concepts. There is the chance of seeing mathematics in terms of something else and vice versa. The iconic face of mathematics becomes available to inspection. That offers a new basis upon which the psychological argument may be reinforced and regain legitimization. Models and applications can represent gateways to metaphorical thinking and open fundamental routes to mathematics understanding.
REFERENCES Black, M. (1962). Models and metaphors. Ithaca, NY: Cornell University Press. Black, M. (1993). More about metaphor. In A. Ortony (Ed.), Metaphor and thought (pp. 19–41). Cambridge, England: Cambridge University Press. Blum, W. (1991). Applications and modelling in mathematics teaching—A review of arguments and instructional aspects. In M. Niss, W. Blum, & I. Huntley (Eds.), Teaching of mathematical modelling and applications (pp. 10–29). Chichester, England: Ellis Horwood.
286
CARREIRA
Blum, W., & Niss, M. (1991). Applied mathematical problem solving, modelling, applications and links to other subjects—State, trends and issues in mathematics instruction. Educational Studies in Mathematics, 22(1), 36–68. Carreira, S. (1998). Significado e aprendizagem da matemática: Dos problemas de aplicação à produção de metáforas conceptuais [Meaning and mathematics learning: From applied problem solving to the production of conceptual metaphors]. Unpublished doctoral thesis, Departamento de Educação, Faculdade de Ciências, Universidade de Lisboa, Portugal. Eco, U. (1981). O signo [The sign]. Lisboa, Portugal: Editorial Presença. Edwards, D., & Hamson, M. (1990). Guide to mathematical modelling. Boca Raton, FL: CRC Press. Erickson, F. (1986). Qualitative methods in research on teaching. In M. C. Wittrock (Ed.), Handbook of research on teaching (pp. 119–161). New York: Macmillan. Galbraith, P. (1995). Modelling, teaching, reflecting—What I have learned. In C. Sloyer, W. Blum, & I. Huntley (Eds.), Advances and perspectives in the teaching of mathematical modelling and applications (pp. 21–45). Yorklin, DE: Water Street Mathematics. Krumholtz, N. (1989). Modelling and metaphors: Power and risks. In W. Blum, J. S. Berry, R. Biehler, I. D. Huntley, G. Kaiser-Messmer, & L. Profke (Eds.), Applications and modelling in learning and teaching mathematics (pp. 81–87). Chichester, England: Ellis Horwood. Lakoff, G. (1987). Women, fire, and dangerous things: What categories reveal about the mind. Chicago: University of Chicago Press. Lakoff, G. (1993). The contemporary theory of metaphor. In A. Ortony (Ed.), Metaphor and thought (pp. 202–251). Cambridge, England: Cambridge University Press. Lakoff, G. (1995). Embodied minds and meanings. In P. Baumgartner & S. Payr (Eds.), Speaking minds: Interviews with twenty eminent cognitive scientists (pp. 115–129). Princeton, NJ: Princeton University Press. Lakoff, G., & Johnson, M. (1980). Metaphors we live by. London: University of Chicago Press. Lakoff, G., & Núñez, R. (1997). The metaphorical structure of mathematics: Sketching out cognitive foundations for a mind-based mathematics. In L. English (Ed.), Mathematical reasoning: Analogies, metaphors, and images (pp. 21–89). Mahwah, NJ: Lawrence Erlbaum Associates, Inc. Lopez-Real, F. (1989). Metaphors and related concepts in mathematics: Pt. 1. Mathematics Teaching, 127, 50–52. Lopez-Real, F. (1990). Metaphors and related concepts in mathematics: Pt. 2. Mathematics Teaching, 130, 34–36. Moreira, L. (1996). Mais matemática ou mais oportunidades de matematização?—Um trabalho em desenvolvimento curricular [More mathematics and more opportunities for mathematization?— Working on curricular development]. In A. Roque & M. J. Lagarto (Eds.), Profmat 96—Actas (pp. 67–77). Lisboa, Portugal: Associação de Professores de Matemática. Moreira, L., & Carreira, S. (1998). Nickname: Zeno—From figurant to character. In P. Abrantes, J. Porfírio, & M. Baía (Eds.), Proceedings of the CIEAEM 49 (pp. 150–156). Setúbal, Portugal: Escola Superior de Educação de Setúbal. Niss, M. (1989). Aims and scope of applications and modelling in mathematics curricula. In W. Blum, J. S. Berry, R. Biehler, I. D. Huntley, G. Kaiser-Messmer, & L. Profke (Eds.), Applications and modelling in learning and teaching mathematics (pp. 22–31). Chichester, England: Ellis Horwood. Peirce, C. S. (1931). Collected papers. Cambridge, MA: Harvard University Press. Peirce, C. S. (1978). Écrits sur le signe [Writings on the sign] (G. Deledalle, Ed.). Paris: Éditions du Seuil. Pimm, D. (1995). Symbols and meanings in school mathematics. London: Routledge. Ricoeur, P. (1983). A metáfora viva. Porto, Portugal: Rés-Editora.
STUDENTS’ METAPHORICAL THINKING
287
Santos, L. R. (1994). Metáforas da razão ou economia poética do pensar kantiano. Lisboa, Portugal: Fundação Calouste Gulbenkian and Junta Nacional de Investigação Científica e Tecnológica. Vile, A. W. (1996). Developmental semiotics: The evolution of a theoretical framework for the description of meaning-making in mathematics education and in mathematics. Unpublished doctoral thesis, South Bank University, London.


![Theres Wocket My Pocket Seuss Dr - [Download] - Google Sites](https://m.moam.info/img/260x300/theres-wocket-my-pocket-seuss-dr-download-google-s_64771783097c4737708b5029.jpg)