forest dominated by Eucalyptus regnans F. Muell. in gullies and near the valley floor, and Eucalyptus delegatensis R.T.. Baker on the upper slopes with a mixed ...
Tree Physiology 18, 557--563 © 1998 Heron Publishing----Victoria, Canada
Whole-tree transpiration and water-use partitioning between Eucalyptus nitens and Acacia dealbata weeds in a short-rotation plantation in northeastern Tasmania MARK A. HUNT1,3,4 and CHRISTOPHER L. BEADLE1,2 1
Cooperative Research Centre for Sustainable Production Forestry, GPO Box 252-12, Hobart 7001, Australia
2
CSIRO Division of Forestry and Forest Products, GPO Box 252-12, Hobart 7001, Australia
3
Department of Plant Science, University of Tasmania, GPO Box 252-55, Hobart 7001, Australia
4
Present address: Queensland Forestry Research Institute, MS 483 Fraser Road, Gympie 4570, Australia
Received July 24, 1997
Keywords: competition, eucalypts, heat pulse, sap flux, scaling.
Introduction Quantification of stand water use is important for forest management in the context of water yield (Vertessy et al. 1995), species selection (White et al. 1996) and silvicultural management (Whitehead and Kelliher 1991). Consequently, a satisfactory approach is needed to measure and predict the transpiration component of water use at the stand scale where problems of terrain, floristic and structural heterogeneity preclude the use of physical and leaf-level parameterization models, and where scale prevents the use of modern remote sensing approaches at the resolution required. The measurement of whole-tree water use by the heat pulse method potentially provides accurate physiological estimates of transpiration by
individual plants under such conditions (Hatton and Vertessy 1990). Development of the heat pulse technique (Marshall 1958, Swanson and Whitfield 1981, Swanson 1983) has been accompanied by improvements in the accuracy and speed of point measurements of sap flow, thus, other sources of error in converting these measurements to whole-tree estimates have become increasingly important (Daoqun et al. 1996). The most critical component of these errors involves the variation in sap flow velocity with sapwood depth (e.g., Cohen et al. 1985). The first attempt to account for this variation involved fitting a least squares polynomial to point estimates integrated from several depths (Cohen et al. 1981, Edwards and Warwick 1984, Green and Clothier 1988); however, it is not always possible to identify such a sap velocity profile with depth (Dunn and Connor 1993). An alternative approach is a weighted-average method that takes into account the correlation of flow rate with seasonal wood production. This method has been applied in young trees (Hatton et al. 1990, Hatton et al. 1992, Dye 1996). Recently, Daoqun et al. (1996) described a method for developing correction coefficients based on small numbers of sensors to account for radial variation in sap flow. Although methodology for obtaining accurate measurements of sap flux from routine point measurements is now available, biometric problems in scaling transpiration from tree to stand are still evident. A variety of approaches has been used, including the use of crown classes (Ladefoged 1963), tree size (Èermák and Kuèera 1987) and a combination of stand inventory characteristics such as stem diameter, basal area and sapwood area/leaf area ratios (Hatton et al. 1995). Analyses of the errors associated with such scaling approaches have been investigated (e.g., Hatton and Vertessy 1990, Hatton et al. 1995). Scaling problems involve identification of elements in the forest that are likely to behave differently as a result of variation in either physical or physiological controls, and finding a satisfactory relationship between sap flux and an easily measured inventory parameter. Both types of problems are increased by the structural complexity of a stand (Hatton et
Downloaded from treephys.oxfordjournals.org by guest on July 13, 2011
Summary Whole-tree water use in 4- and 8-year-old plantations of Eucalyptus nitens Deane and Maiden (ex Maiden) in the presence and absence of Acacia dealbata Link. weeds was estimated by the heat pulse velocity technique during a sixweek summer period. Maximum sap velocities were recorded between 5 and 15 mm under the cambium for both eucalypt and acacia trees, and marked radial and axial variations in sap velocity were observed. The latter source of variation was most pronounced in mixed stands where crowns were asymmetrical. Mean daily sap flux ranged from 1.4 to 103.6 l day −1 for eucalypts and from < 0.1 to 8.4 l day −1 for acacias. Stem diameter explained 98% of the variation in sapwood area for E. nitens and 89% for A. dealbata, and was determined to be a suitable parameter for scaling water use from the tree to stand level. Plot transpiration varied from 1.4 to 2.8 mm day −1 in mixed 8-year-old plots and was 0.85 mm day −1 in a mixed 4-year-old plot. The degree of A. dealbata infestation was associated with absolute plot water use and regression models predicted that, in the absence of acacia competition, plot water use for the 8-year-old stand would approach 5--6 mm day −1 during the growing season.
558
HUNT AND BEADLE
al. 1995) and the rate at which the stand is changing (Teskey and Sheriff 1996). Although application of whole-tree sap flux measurements is now routinely applied to plantation monocultures (e.g., Dye 1996, Loustau et al. 1996, Teskey and Sheriff 1996), application of the technique to the study of floristically complex forests is more difficult (but see Becker 1996). Prompted by a preliminary investigation indicating that acacia growth was correlated with decreased eucalypt productivity in a young forest of intermediate complexity at a heterogeneous site in northeastern Tasmania, we used whole-tree sap flux techniques to estimate the relative contributions to stand water use of plantation eucalypts and naturally occurring acacia weeds in this forest. The hypotheses tested were: (1) Acacia dealbata Link. contributes substantially to water use only in very young stands; and (2) the productivity of Eucalypts nitens Deane and Maiden (ex Maiden) is not reduced by competition for water with A. dealbata.
Materials and methods
The study was conducted in a commercial eucalypt plantation at Wyena in northeastern Tasmania, Australia approximately 35 km east of Launceston (41°12′ S, 147°16′ E). The plantation occupies the head of a small north-facing valley and comprises approximately 38 ha of Eucalyptus globulus Labill. and 560 ha of Eucalyptus nitens. All experimental work was conducted in the E. nitens stands. The site receives moderate rainfall (1000 mm year −1) and has generally good but variable drainage because of the presence of Matthinna Shale as the parent rock. Soil depth varies from more than 2.5 m in colluvial deposits at topographically low points (130 m a.s.l.) to less than 0.5 m at several locations including eroded upper slopes (400 m a.s.l.). The original vegetation comprised wet eucalypt forest dominated by Eucalyptus regnans F. Muell. in gullies and near the valley floor, and Eucalyptus delegatensis R.T. Baker on the upper slopes with a mixed rainforest understory. Between 1958 and 1986, 300 ha of the site was cleared and used for agriculture. The site was converted to plantation forest between 1988 and 1992. Six experimental plots were used for transpiration measurements, three in the 8-year-old (1988) plantation on ex-pasture sites (Plots A--C) and three in the 4-year-old (1992) plantation on cleared native forest sites (Plots D--F). Plots A and B were located on the valley floor. Plot C was established in the same stand approximately 400 m upslope where a different approach to weed control had resulted in an absence of competing species. Each of the three plots represented the area covered by 16 eucalypts in a 4 × 4 pattern (nominally 192 m2). Plots D--F were located at the topographically highest part of the site and each covered a nominal area of 144 m2 (3 × 4 spacing of eucalypts). Plots D and E represented heavy acacia competition. Acacia was absent from Plot F, but a mixed understory primarily of bracken (Pteridium esculentum Forst F. (Cockayne)) and dogwood (Pomaderris apetala Labill.) was present. Acacias were removed from Plots B and E in September 1995.
Twelve sap flow sensor units (Greenspan Technology, Warwick, Australia) were used. One eucalypt (EucREF) and one acacia (AcREF) tree (both dominants), growing 2 m apart in Plot A, were used as reference trees as described by Vertessy et al. (1995). These trees occupied similar canopy positions, exhibited crown form typical of the species at the site and exhibited no crown damage. They were measured for 30 days between December 14, 1996 and January 20, 1997. Roving sensors were employed to make measurements on 3--4 trees in each of the six plots for a minimum of 4 days per tree. Two probesets (one logger) were used on each tree for routine measurements: Probeset 1 in the northern face of the tree and Probeset 2 in the eastern face. Thermistor pairs were placed at 5 and 10 mm depths under the cambium. Heat pulse was applied for 1.6 s at 10-min intervals. Probes were implanted at a height of 1--1.5 m aboveground, below any live branches and vertically not within 15 cm of any deformation or wound in the stem. Probesets were moved regularly in all but the reference trees where they were reinstalled after 28 days. Mean daily sap flux values measured with the roving sensors were regressed against measurements from the reference trees to predict daily water use for all trees for the entire sampling period (sensu Vertessy et al. 1995). During the measurement period, soils at the 8-year-old site developed mean water deficits of 20 mm in the top 75 cm of the profile after initially being close to field capacity. Mean daily maximum and minimum temperatures were 21.0 and 6.3 °C, respectively; mean daily vapor pressure deficit was 7.2 kPa and 11 mm of rainfall was recorded. Radial variation Radial variation in the conductivity of sapwood was accounted for by a modification of the method described by Zang et al. (1996). At the completion of routine measurements, radial profiles of sap flow for each sample tree were obtained on warm clear days. Because Zang et al. (1996) recommended that profile sampling across multiple axes was not necessary to obtain an accurate average sap velocity in E. globulus, we used one moving probe to determine radial variation in sap velocity for each tree. Radial profiles in the southern axis were used with point measurements in the northern and eastern axes to determine correction coefficients (a simple weighted average of the sap flow ratios with depth in the sapwood) for each tree. The correction coefficients were applied to routine point measurements made 10 mm under the cambium (on two axes) to obtain an accurate estimate of sap velocity. Sap flow velocities were multiplied by sapwood area to compute sap flux in individual trees. Stand transpiration Mean daily sap flux values were used to develop linear regression relationships between sap flux and diameter at breast height over bark (dbh) for acacias and eucalypts in the 4- and 8-year-old stands. These relationships were applied to diameter data collected in six 8-year-old plots (192 m2) and a single 4-year-old plot (144 m2) (referred to as Plots 1--6 and Plot 7,
TREE PHYSIOLOGY VOLUME 18, 1998
Downloaded from treephys.oxfordjournals.org by guest on July 13, 2011
Site description
Transpiration measurements
WATER USE PARTITIONING BETWEEN TWO AUSTRALIAN SPECIES
respectively) to estimate transpiration on a plot basis. For the mixed plots, it was necessary to combine eucalypt data for Plots A and B and acacia data for Plots A and D. Regression relationships were also developed between plot transpiration and plot basal area of A. dealbata and plot transpiration and the ratio of plot basal area of A. dealbata to total plot basal area. Sapwood area and volume fraction
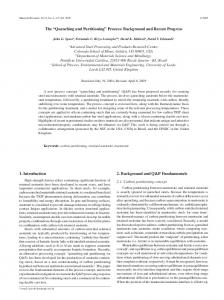
Results Sapwood characteristics Sapwood area varied from 33.7 to 266.5 cm2 for E. nitens and from 6.0 to 130.6 cm2 for A. dealbata (Table 1). Stem diameter explained 93% of the variability in sapwood area for both species (Figure 1). The relationships were stronger for 4-yearold eucalypt and acacia trees (r 2 = 0.97 and 0.99, respectively) than for 8-year-old trees (r 2 = 0.92 and 0.85, respectively) (Figure 1). For E. nitens, volume fractions of wood (Vw) and water (Vh) ranged from 0.27 to 0.38 and from 0.48 to 0.67, respectively (Table 1), with no significant difference between sites or ages. For A. dealbata, Vw and Vh ranged from 0.25 to 0.35 and from 0.16 to 0.43, respectively, with a significant difference between A. dealbata ages and between species (P < 0.05 in both cases).
Table 1. Stem diameter (dbh), sapwood parameters and volume fraction of water (Vh ) and wood (Vw) for sample trees. EucREF and AcREF refer to trees monitored throughout the experimental period (see text). Tree ID
dbh
Sapwood
Sapwood
(mm)
area (cm2)
radius (mm) V h
Vw
E. nitens 8-year-old E1 245 E2 121 EucREF 175 E4 128 E5 193 E6 165 E7 148 E8 229 E9 206 E10 228 E20 266
220.9 62.9 76.7 70.5 120.6 99.0 80.2 193.4 182.6 201.4 266.5
37.0 22.0 17.0 24.0 25.0 25.0 22.0 34.0 37.0 36.0 40.0
0.62 0.60 0.63 0.62 0.62 0.62 0.67 0.57 0.61 0.62 0.56
0.33 0.29 0.30 0.33 0.33 0.32 0.35 0.35 0.35 0.33 0.38
E. nitens 4-year-old E11 84 E12 94 E13 103 E14 94 E15 115 E16 119 E17 116 E18 115 E19 125
33.7 43.6 50.6 38.2 60.7 71.7 68.7 67.9 80.2
19.0 21.5 23.0 18.0 23.0 27.5 27.0 27.0 29.0
0.61 0.60 0.60 0.60 0.67 0.62 0.62 0.58 0.48
0.30 0.33 0.32 0.32 0.27 0.29 0.31 0.34 0.32
A. dealbata 8-year-old A1 173 130.6 A2 135 58.8 A3 124 81.1 A4 132 84.0 A5 94 40.9 AcREF 154 107.5
31.0 17.0 30.0 28.0 19.0 30.0
0.34 0.43 0.26 0.40 0.31 0.27
0.31 0.32 0.33 0.35 0.23 0.29
A. dealbata 4-year-old A21 36 A22 50 A23 71 A24 84
8.0 11.5 16.0 19.0
0.16 0.18 0.21 0.20
0.25 0.29 0.31 0.28
6.0 12.5 24.5 34.0
Volume fraction
Radial variation in sap velocity Maximum sap velocity was recorded between 5 and 15 mm under the cambium in all trees. Axial variation in the sap velocity profile was minimal in the absence of acacias (Plots C and F), but it was pronounced in the mixed acacia--eucalypt plots (Plots A and D). Attempts to correlate axial variation with aspect were unsuccessful. Sap velocity was predominantly but not always greatest on the northern axis. Correction coefficients, which were developed from radial profile analysis (e.g., Figure 2) and subsequently applied to point data, varied between 0.67 and 1.42 for the acacias and between 0.58 and 1.21 for the eucalypts, but were within 10% of unity for half of the 30 trees investigated. Eucalypts with similar sapwood areas had almost identical correction coefficients; however, there was insufficient replication to make a quantitative assessment of this observation.
Tree transpiration Mean daily sap flux for EucREF varied between 4.5 and 17.7 l day −1 (mean 12.2 l day −1), whereas mean daily sap flux for AcREF was 6.9 l day −1 (range 3.7 to 9.1 l day −1) (Table 2). Sap velocities (data not shown) were similar for the two reference trees. Although daily transpiration for AcREF was only half that of EucREF on most measurement days (Figure 3a), the two trees followed the same pattern of variation (Figure 3b). On heavily overcast days, the ratio of EucREF transpiration to AcREF transpiration was reduced. First-order linear regression analysis of daily sap flux between EucREF and the experimental trees yielded significant relationships (P < 0.05) for all 8-year-old eucalypts except Tree E2 (r 2 = 0.81, significant at r 2 = 0.811) (Table 2). Mean daily transpiration ranged from 5 to 104 l (Table 2). There were
TREE PHYSIOLOGY ON-LINE at http://www.heronpublishing.com
Downloaded from treephys.oxfordjournals.org by guest on July 13, 2011
At the completion of the measurement period, samples of wood were taken from all trees with a 5-mm diameter increment corer for determination of sapwood radius (rsw ). Sapwood was identified by a yellow to red color change of heartwood following application of dimethyl yellow. The sapwood--heartwood boundary was not as clearly defined in A. dealbata as in E. nitens, primarily because of unassociated changes in wood texture in A. dealbata. Sapwood area (Asw ) was calculated from dbh, bark depth and rsw as determined from the core. Unstained sapwood segments from the cores were used for gravimetric determination of the volume fractions of wood, water and air for each sample tree.
559
560
HUNT AND BEADLE Table 2. Sap flow parameters for sample trees (r 2 values refer to first order linear regressions between reference trees and experimental trees). The reference tree used for each species and age class combination is indicated by bold type. Mean sap flux (l day −1)
E. nitens 8-year-old E1 5 E2 5 EucREF 30 E5 8 E6 8 E7 8 E8 14 E9 11 E10 11
0.99 0.81 -0.73 0.84 0.89 0.82 0.98 0.94
36.33 5.01 12.24 38.52 18.22 19.00 44.69 103.57 31.24
E. nitens 4-year-old E11 15 E12 14 E13 16 E14 6 E15 6 E16 6
-0.96 0.57 0.84 0.96 0.97
1.40 9.08 10.10 18.15 11.24 17.38
Figure 1. First-order linear regression relationships between sapwood area and diameter at breast height over bark for 4- and 8-year-old A. dealbata and E. nitens (8-year-old E. nitens: y = 1.4x -- 129.5, r 2 = 0.92; 4-year-old E. nitens: y = 1.1x -- 65, r 2 = 0.97; 8-year-old A. dealbata: y = 1.1x -- 65.2, r2 = 0.85; 4-year-old A. dealbata: y = 0.6x -- 15.8, r 2 = 0.99). Data from both mixed and acacia-free plots were pooled for the eucalypt relationships.
A. dealbata 8-year-old AcREF 30 A2 23 A4 5 A5 8
-0.61 0.83 0.67
6.90 6.88 8.42 0.59
no significant regression relationships between EucREF and the 4-year-old eucalypts (P > 0.05). Therefore, daily sap flux of the 4-year-old eucalypts E12--E16 was regressed against
A. dealbata 4-year-old A21 5 A22 5 A23 6 A24 16
0.95 0.93 0.97 --
0.26 0.02 2.04 2.18
Measurement (days)
Tree E11 with significant relationships in all cases (Table 2). Because the eucalypts in Plot F were not measured concurrently with the other 4-year-old trees, they could not be used to estimate plot transpiration. There were also significant linear relationships between daily transpiration of AcREF and that of the other 8-year-old acacias (Table 2), but not between daily transpiration of AcREF and the 4-year-old acacias (r 2 < 0.1). Therefore, Tree A24 was used as a reference tree for the 4-year-old acacias (Table 2). Plot transpiration
Figure 2. A typical profile of sap velocity ratio for a single radius (in this case a 4-year-old E. nitens tree in a mixed plot). The stationary sensor was placed in the northern axis of the stem and the moving sensor sampled a profile on the southern axis.
Because of the short period since removal of competition, eucalypts in the cleared plots (B and E) did not yield significantly different results from the corresponding competition plots (A and D). Therefore, eucalypt data were combined for Plots A and B, and D and E, respectively, yielding significant regression relationships between dbh and mean daily sap flux in both cases (Figure 4a). The loss of one of the three replicates in Plot C precluded any analysis of that plot. There was a significant regression relationship for mean daily sap flux and dbh for 4-year-old acacias (Figure 4a), but not for 8-year-old acacias. When all data for the two species were pooled, highly
TREE PHYSIOLOGY VOLUME 18, 1998
Downloaded from treephys.oxfordjournals.org by guest on July 13, 2011
r2
Tree ID
WATER USE PARTITIONING BETWEEN TWO AUSTRALIAN SPECIES
significant regression relationships were derived (Figure 4b). Acacia dealbata accounted for nearly half the water use in the 4-year-old plot (0.41 mm day −1) and for 13% of water use in the 8-year-old plots (0.26 mm day −1) (Table 3). Significant curvilinear relationships between plot transpiration and either plot basal area of A. dealbata (Figure 5a) or the contribution of A. dealbata to total plot basal area (Figure 5b) indicated that increasing acacia basal area resulted in decreasing plot transpiration.
Discussion Acacia dealbata contributed significantly to stand water use at the experimental site. The contribution was proportionally greater in 4-year-old stands than in 8-year-old stands (50 versus 13%). In stands of both ages, plot water use (1--3 mm day −1) was less than would be expected for a closed eucalypt canopy (5--6 mm day −1; Honeysett et al. 1992). The amount of A. dealbata infestation was associated with absolute plot water use and regression models predicted that, in the absence of acacia competition, plot water use would approach 5--6 mm day −1 during the growing season. Radial variation in sap flow velocity followed similar patterns for the two species and was higher at the periphery of the sapwood as has been reported for a variety of other species (e.g., Swanson 1967, Swanson 1974, Daoqun et al. 1996). Cyclic variation in sap velocity within radii, which has been
Figure 4. First-order linear regressions describing the relationships between estimated mean daily sap flux and diameter at breast height: (a) for 4- and 8-year-old A. dealbata (n and ,, respectively) and E. nitens (u and s, respectively) trees; and (b) for A. dealbata (u) and E. nitens (s), ages combined.
reported in several studies (e.g., Dye et al. 1991), was not observed for either species. Cohen et al. (1985) reported that axial variation in sap velocity in Douglas-fir was not associated with changes in sun position. Therefore, uneven axial distribution of crowns about the stem in the present study probably influenced the axial variation in sap velocity of trees in the mixed plots. Because it was not possible to quantify three-dimensional crown distribution in the experimental trees (and thereby adjust the sampling protocol), a significant source of error potentially exists. Therefore, more rigorous sampling may be required for determination of a sap velocity correction coefficient under mixed species conditions than in monoculture. Because we did not observe any cyclic variation in the sap velocity profile, concurrent point measurements in the 5-15 mm annulus at the four cardinal radii is probably sufficient to reduce potential errors to an acceptable level (when combined with a full profile on a single radius). However, a full error analysis is warranted for future studies, particularly in species where cyclic radial variation has been reported (e.g., Eucalyptus regnans; Dunn and Connor 1993). For trees occupying the same canopy position, species differences in tree transpiration were primarily the result of differences in sapwood area and the time during which sap
TREE PHYSIOLOGY ON-LINE at http://www.heronpublishing.com
Downloaded from treephys.oxfordjournals.org by guest on July 13, 2011
Figure 3. Relationships between daily sap flux of the reference E. nitens tree (EucREF) and the reference A. dealbata tree (AcREF). (a) Pattern of variation between the two trees over a 14-day period in summer; and (b) first-order linear regression relationship describing the variation over the same period.
561
562
HUNT AND BEADLE
Table 3. Plot biometric characteristics and estimated daily transpiration. Plot ID
Age (year)
Transpiration (mm)
A. dealbata
E. nitens −1
1 2 3 4 5 6 7
8 8 8 8 8 8 4
2.0 2.3 2.8 1.4 1.6 2.0 0.8
Contribution (%) Frequency (stems ha )
Basal area (m ha )
Basal area (m2 ha −1)
9 9 24 9 16 12 48
13.6 10.0 7.4 13.5 17.9 13.9 24.0
21.9 23.8 23.3 15.6 15.1 18.3 4.0
−1
In a Nothofagus forest, Köstner et al. (1992) reported that 50% of sap flux for a 14-tree plot was accounted for by three emergent trees and that significant differences in sap flux density existed between canopy layers. Similarly, variation in sap flux density among dominance classes has been reported for Douglas-fir (Granier 1987) and Pinus radiata D. Don. (Teskey and Sheriff 1996). Plot transpiration estimates were within the range expected for a native eucalypt forest (0.81--1.86 mm day −1, Dunn and Connor 1993; 2.9 mm day −1, Vertessy et al. 1995), a coniferous forest (0.67 mm day −1, Èermák et al. 1995) or a pine plantation (1--5 mm day −1, Whitehead and Kelliher 1991) but less than half that expected for a closed canopy eucalypt plantation (5--6 mm day −1, Honeysett et al. 1992). There was no indication that drought stress accounted for the twofold discrepancy between expected and estimated plot transpiration. Because the regression relationships in Figure 5 indicated that plot water use would approach the expected value of 5--6 mm day −1 in the absence of acacia competition, we conclude that: (a) A. dealbata was not limiting water availability in the 8-yearold plantation; and (b) A. dealbata was restricting water use (and by definition the productivity) of E. nitens through competition for another limiting resource, probably light. Acacia dealbata crowns occupy a large area of the overstory canopy, reducing the size of the eucalypt crowns. Further studies of canopy structure and comparative leaf water relations are required to elucidate these interactions between the species.
Acknowledgments We thank Boral Timber Tasmania for use of the plantation site and Mr. Blair Miller for valuable comments on the manuscript. We are grateful to Dr. Don White for assistance with the measurement protocol.
References
Figure 5. Second-order linear regression relationships describing the influence of A. dealbata infestation on plot transpiration in terms of: (a) absolute contribution of A. dealbata basal area; and (b) proportional contribution of A. dealbata basal area to plot basal area.
Becker, P. 1996. Sap flow in Bornean heath and dipterocarp forest trees during wet and dry periods. Tree Physiol. 16:295--299. Èermák, J. and J. Kuèera. 1987. Transpiration of fully grown trees and stands of spruce (Picea albes (L.) Karst.) estimated by the treetrunk heat balance method. In Proc. Forest Hydrology and Watershed Measurements, Vancouver, Canada. Eds. R.H. Swanson, P.Y. Bernier and P.D. Woodward. Publ. No. 167, IAHS, Wallingford, U.K., pp 311--317.
TREE PHYSIOLOGY VOLUME 18, 1998
Downloaded from treephys.oxfordjournals.org by guest on July 13, 2011
velocities were at or close to the maximum, rather than any significant differences in maximum sap velocity. However, subdominant and suppressed trees (generally acacias) exhibited significantly (P < 0.05, t-test) lower sap velocities than dominant neighbors in both the 4- and 8-year-old stands. For such trees, limited light availability was probably responsible for the lower maximum sap velocities and shorter periods of high sap velocities. The suggestion of Diawara et al. (1991) that shading accounts for much of the variation in sap flux among trees is supported by the findings that between-tree variation in sap flux is low where trees are widely spaced (Granier et al. 1990, Loustau et al. 1996), but high in closed forest canopies (Kelliher et al. 1992, Köstner et al. 1992). Kelliher et al. (1992) concluded that between-tree variation in mean daily sap flux is related to social position within stands.
2407 1296 2130 5648 3796 2593 14444
2
WATER USE PARTITIONING BETWEEN TWO AUSTRALIAN SPECIES
Honeysett, J.L., C.L. Beadle and C.R.A. Turnbull. 1992. Evapotranspiration and growth of two contrasting species of eucalypts under non-limiting and limiting water availability. For. Ecol. Manag. 50:203--216. Kelliher, F.M., B.M.M. Köstner, D.Y. Hollinger, J.N. Byers, J.E. Hunt, T.M. McSeveny, R. Meserth, P.L. Weir and E.-D. Schulze. 1992. Evaporation, xylem sap flow, and tree transpiration in a New Zealand broad-leaved forest. Agric. For. Meteorol. 62:53-73. Köstner, B.M.M., E.-D. Schulze, F.M. Kelliher, D.Y. Hollinger, J.N. Byers, J.E. Hunt, T.M. McSeveny, R. Meserth and P.L. Weir. 1992. Transpiration and canopy conductance in a pristine broad-leaved forest of Nothofagus: an analysis of xylem sap flow and eddy correlation measurements. Oecologia 91:350--359. Ladefoged, K. 1963. Transpiration of forest trees in closed stands. Physiol. Plant. 16:378--414. Loustau, D., P. Berbigier, P. Roumagnac, C. Arruda-Pacheco, J.S. David, M.I. Ferreira, J.S. Pereira and R. Tavares. 1996. Transpiration of a 64-year-old maritime pine stand in Portugal. 1. Seasonal course of water flux through maritime pine. Oecologia 107:33-42. Marshall, D.C. 1958. Measurement of sap flow in conifers by heat transport. Plant Physiol. 33:385--396. Swanson, R.H. 1967. Seasonal course of transpiration of lodgepole pine and Engelman spruce. In Proc. Int. Symp. on Forest Hydrology. Eds. W.E. Sopper and H.W. Lull. Pennsylvania State Univ., pp 419--434. Swanson, R.H. 1974. Velocity distribution patterns in ascending xylem sap during transpiration. In Flow: Its Measurement and Control in Science and Industry. Ed. R.B. Dowell. Instrument Society of America, Pittsburgh, PA, pp 1425--1430. Swanson, R.H. 1983. Numerical and experimental analyses of implanted-probe heat pulse theory. Ph.D. Thesis, Univ. Alberta, Edmonton, AB, Canada, pp 117--138. Swanson, R.H. and D.W.A. Whitfield. 1981. A numerical analysis of heat pulse velocity theory. J. Exp. Bot. 32:221--239. Teskey, R.O. and D.W. Sheriff. 1996. Water use by Pinus radiata trees in a plantation. Tree Physiol. 16:273--279. Vertessy, R.A., R.G. Benyon, S.K. O’Sullivan and P.R. Gribben. 1995. Relationships between stem diameter, sapwood area, leaf area and transpiration in a young mountain ash forest. Tree Physiol. 15:559-567. White, D.A., C.L. Beadle and D. Worledge. 1996. Leaf water relations of Eucalyptus gobulus and E. nitens: seasonal drought and species effects. Tree Physiol. 16:469--476. Whitehead, D. and F.M. Kelliher. 1991. Modeling the water balance of a small Pinus radiata catchment. Tree Physiol. 9:17--33.
TREE PHYSIOLOGY ON-LINE at http://www.heronpublishing.com
Downloaded from treephys.oxfordjournals.org by guest on July 13, 2011
Èermák, J., E. Cienciala, J. Kuèera, A. Lindroth and E. Bednarova. 1995. Individual variation in sap-flow rate in large pine and spruce trees and stand transpiration: a pilot study at the central NOPEX site. J. Hydrol. 168:17--27. Cohen, Y., M. Fuchs and G.C. Green. 1981. Improvement of the heat pulse method for determining sapflow in trees. Plant Cell Environ. 4:391--397. Cohen, Y., F.M. Kelliher and T.A. Black. 1985. Determination of sap flow in Douglas-fir trees using the heat pulse technique. Can. J. For. Res. 15:422--428. Daoqun Zang, C.L. Beadle and D.A. White. 1996. Variation in sapflow velocity in Eucalyptus globulus with position in sapwood and use of a correction coefficient. Tree Physiol. 16:697--703. Diawara, A., D. Loustau and P. Berbigier. 1991. Comparison of two methods for estimating the evaporation of a Pinus pinaster (Ait.) stand: sap flow and energy balance with sensible heat flux measurements by an eddy covariance method. Agric. For. Meteorol. 54:49--66. Dunn, G.M. and D.J. Connor. 1993. An analysis of sapflow in mountain ash (Eucalyptus regnans) forests of different age. Tree Physiol. 13:321--336. Dye, P.J. 1996. Response of Eucalyptus grandis trees to soil water deficits. Tree Physiol. 16:233--238. Dye, P.J., B.W. Olbrich and A.G. Poulter. 1991. The influence of growth rings in Pinus patula on heat pulse velocity and sap flow measurement. J. Exp. Bot. 42:867--870. Edwards, W.R.N. and N.W.M. Warwick. 1984. Transpiration from a kiwifruit vine as estimated by the heat pulse technique and the Penman-Monteith equation. N.Z. J. Agric. Res. 27:537--543. Granier, A. 1987. Evaluation of transpiration in a Douglas-fir stand by means of sap flow measurements. Tree Physiol. 3:309--320. Granier, A., V. Bobay, J.H.C. Gash, J. Gelpe, B. Saugier and W.J. Shuttleworth. 1990. Vapour flux density and transpiration rate comparisons in a stand of maritime pine (Pinus pinaster Ait.) in Les Landes forest. Agric. For. Meteorol. 51:309--319. Green, S.R. and B.W. Clothier. 1988. Water use of kiwifruit vines and apple trees by the heat pulse technique. Can. J. For. Res. 15:422--428. Hatton, T.J. and R.A. Vertessy. 1990. Improved sampling procedures for the robust estimation of sapflow in Pinus radiata by the heat pulse method. Hydrol. Proc. 4:289--298. Hatton, T.J., E.A. Catchpole and R.A. Vertessy. 1990. Integration of sap flow velocity to estimate plant water use. Tree Physiol. 6:201--209. Hatton, T.J., J. Walker, W. Dawes and F.X. Dunin. 1992. Simulations of hydroecological responses to elevated CO2 at the catchment scale. Aust. J. Bot. 40:679--696. Hatton, T.J., S.J. Moore and P.H. Reece. 1995. Estimating stand transpiration in a Eucalyptus populnea woodland with the heat pulse method: measurement errors and sampling strategies. Tree Physiol. 15:219--227.
563
Downloaded from treephys.oxfordjournals.org by guest on July 13, 2011