Journal of Sustainability Science and Management Volume 9 Number 2, December 2014: 1-20
ISSN: 1823-8556 © Penerbit UMT
WIND CHARACTERISTICS AND GIS-BASED SPATIAL WIND MAPPING STUDY IN MALAYSIA M. Z. IBRAHIM1*, K. H. YONG1, M. ISMAIL2, A. ALBANI2 AND A. M. MUZATHIK3 School of Ocean Engineering, Universiti Malaysia Terengganu, 21030 Kuala Terengganu, Terengganu. 2School of Marine Science & Environment, Universiti Malaysia Terengganu, 21030 Kuala Terengganu, Terengganu. 3Institute of Technology, University of Moratuwa, Moratuwa, Sri Lanka.
1
*Corresponding author:
[email protected]
Abstract: Malaysia intends to find alternative energy resources in electricity generation. Wind is one of the fastest growing resources in the world. However, initial wind characteristic study and spatial wind mapping need to be established prior to develop wind energy systems. Spatial wind mapping could provide a compact, informative picture of wind data. The aim of this study was to conduct initial wind characteristic study and spatial wind mapping in Malaysia. Wind data measured at a height of 10 m for nine selected potential sites in Malaysia were obtained from the Malaysian Meteorological Department. In this study, variations of wind speed according to height, Weibull distribution and spatial wind mapping by Inverse Distance Weighted (IDW) were analyzed. The results revealed that, both wind resources at sites, Mersing and Kudat, had higher potential to develop a modern wind system. In addition, the Weibull distribution also proved that higher potential wind resources at Mersing site. Lastly, IDW spatial wind mapping showed that wind resources in the southern part of Peninsular Malaysia are higher than other areas. Spatial wind mapping could be a useful tool for the decision making and planning in wind energy development. KEYWORDS: Spatial mapping, IDW, wind resources, power law, Weibull distribution. Introduction Increasing energy demands and the decreasing availability of fossil fuels have brought more focus on the development of renewable energy. Malaysia is among the nations intent on investigating alternative energy resources (Unit Perancang Ekonomi, Jabatan Perdana Menteri, 2010). Renewable energy was only energy option in human histories and only last few centuries non-renewable energy had been used due to its cheaper cost (Sørensen, 1991). Amongst the variety of renewable energy resources, today, wind is the fastest growing renewable energy resource in the world (Mathew, 2006). In 2009, wind power capacity installed around the world grew 31.7% as compared to last year, bringing the total installed capacity to 158.5 GW (Global Wind Energy Council, 2010). In wind energy history, Europe countries proved successful in the implement of usage (Promsen, et al., 2012). However, India, where it was located near to Equator areas, was also
1.indd 1
showed successful on implementing wind energy. India was one of the top five countries with nearly 11, 8000 MW wind generation capacity in 2010 (Hossain, et al., 2011). Moreover, Thailand, had started a pilot model implementing renewable energy in Phaluay island and wind maps were developed (Promsen, et al., 2012). The exploitation of wind energy in Malaysia is new and there are still lacking reliable and accurate wind data (Muzathik, et al., 2009). Additionally, the studies on the wind energy in Malaysia still rely on secondary wind data which collected not for wind energy assessment purposes. Hence, constructing a wind system for measuring wind resources is a must to develop wind energy in Malaysia. However, constructing a wind system such as wind measurement or wind harvesting machine is very costly (Gipe, 2004). Studies on wind characteristic of the site before constructing a wind system are needed to reduce costs. The wind characteristic is one of the
11/16/14 4:02 PM
M. Z. Ibrahim et al.
significant studies to determine the suitable sites for wind system construction. Next, a GIS-based spatial wind mapping is giving a geographical distribution of wind resource and very useful for decision making and planning in wind energy development (Sreevalsan, et al., 2010). Thus, this research describes the wind characteristic for the selected potential building wind system site, as feeder studies of the exploitation of wind energy in Malaysia. Nonetheless, the spatial wind mapping was conducted to study the potential areas in Malaysia through a wind map. Meanwhile, an existing wind data (secondary wind data) is useful in the wind resource assessment in early stage. Indeed, the wind characteristics necessary to be studied for wind resource assessment are wind speed at different height, wind direction, frequency distribution, and spatial wind speed distribution. Assessment of the wind resources began with the wind speed comparison among the nine selected potential sites. Next, wind speeds at heights of 20, 40, 60, 80 and 100 m for each selected sites are extrapolated using the power law profile. The power law profile is widely utilized by wind energy researchers to interpolate or extrapolate wind speed variation with height (Manwell, et al., 2002; Muzathik, et al., 2009). Next, wind direction distribution for each selected sites were plotted in the wind rose. Also, the wind speed frequency distribution is described in the statistical models. The Weibull distribution has been found to fit a wide range of experimental wind data (Rehman, et al., 1994; Lun & Lam, 2000; Seguro & Lambert, 2000; Weisser, 2003; Celik, 2003; Ramírez & Carta, 2005; Cellura, et al., 2007; Muzathik, et al., 2009). Nevertheless, spatial wind mapping presented a spatial wind speed distribution, in a compact and informative way. Spatial wind mapping was interpolated by the IDW method. Methodology Study Area The weather in Malaysia is characterized by two monsoon regimes, namely, the southwest monsoon from late May to September and the
2
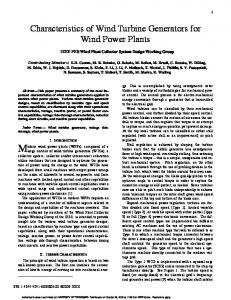
northeast monsoon from November to March (Muzathik, et al., 2009; Weather Phenomena, 2009). The wind power in Malaysia varies according to the southwest monsoon and the northeast monsoon. The study areas, nine selected potential sites, are mainly in coastal areas. In fact, at the beginning of the exploitation of wind energy, it is more convenient to build a wind system at flat area. Moreover, there are available of wind data from the Malaysian Meteorological Department (MMD) for the nine selected potential sites. The selected meteorological stations are Mersing, Kuala Terengganu, Pulau Langkawi, Sandakan, Kudat, Kota Kinabalu, Bintulu, Kuching and Tawau. Figure 1 shows the location of nine meteorological stations. These meteorological stations are located at the airport respectively. Five year data recording were needed to obtain yearly average wind speed (Lun & Lam, 2000; Yoreley & Jorge, 2008) but only one year wind data would be sufficient to realize its potential (Muzathik, et al., 2009). One year wind data is only sufficient to show the initial wind characteristics. Data Preprocessing Measured wind data obtained from the MMD were used in the research and it is measured at the height of 10 m. Several null values present in the wind data set probably not due to windcalm periods but to the faults of the probes. These affected the statistical interpretation and created errors in the Weibull distribution analysis. Hence, data preprocessing was done by substituting the null values with the means of the previous and next values. Wind Speed Trend Monthly measured wind speeds at 10 m height for the nine selected potential sites were plotted into a graph to make a comparison of the wind speed. Wind Speed Variation with Height The measured wind data are based on the height of 10 m. However, modern wind turbines have
J. Sustain. Sci. Manage. Volume 9 (2) 2014: 1-20
1.indd 2
11/16/14 4:02 PM
WIND CHARACTERISTICS AND GIS-BASED SPATIAL WIND MAPPING STUDY IN MALAYSIA
3
Figure 1: Location Map of Selected Meteorological Stations
different hub heights, and all are greater than 10 m (Lu, et al., 2002; Ramachandra & Shruthi, 2004). Thus, it is crucial that the wind speeds at different heights were extrapolated to assess the availability of wind resources. The vertical wind speed was extrapolated to the height of 20, 40, 60, 80 and 100 m. Vertical wind speed profiles for each station were extrapolated using the power law (Ahmed, 2010; Safari, 2010; Ohunakin, 2011). Power law is the most common yet simple empirical expression for the extrapolation wind speed to the desired height (Hossian, 2009). The power law equation is as below: (1) where v is the wind speed estimated at desired height, z; v0 is wind speed measured
at the reference height, zr; and α is the ground surface friction coefficient calculated using the Counihan equation with the surface roughness, z0 (Manwell, et al., 2002). α = 0.096log10z0 + 0.016(log10z0)2 + 0.24
(2)
Wind Direction The distributions of wind direction for the nine selected potential sites were studied with the aid of the wind rose. Measured wind speed and wind direction were plotted into wind rose to show the distribution of wind direction for each selected potential sites. Weibull Distribution Wind speed data are commonly fitted by two probability distribution functions: Weibull and Rayleigh (Manwell, et al., 2002; Celik, 2003; Manwell, et al., 2009). However, Rayleigh distribution is a simplified version of the
J. Sustain. Sci. Manage. Volume 9 (2) 2014: 1-20
1.indd 3
11/16/14 4:02 PM
M. Z. Ibrahim et al.
Weibull distribution, which is often used by manufacturers to show estimates of annual energy production if and only if annual average wind speed is known (Manwell, et al., 2009; Northwest Community Energy, 2013). Thus, in this study wind speed were fitted to Weibull distribution function for the indication of the frequency distribution of the wind speed at nine selected potential sites. The wind speed Weibull probability distribution function can be calculated as: (3) where f(v) is the probability of observing wind speed v, c is the Weibull scale parameter and k is the dimensionless Weibull shape parameter. The Weibull parameters c and k, characterize the wind potential of the region under study. Basically, the scale parameter, c, indicates how ‘windy’ a wind location under consideration is, whereas the shape parameter, k, indicates how peaked the wind distribution is (distribution having a high k value is very sharp in shape) (Rehman, et al., 1994; Seguro & Lambert, 2000; Manwell, et al., 2002; Lu, et al., 2002; Weisser, 2003; Celik, 2003; Ramírez & Carta, 2005; Cellura, et al., 2007; Alghoul, et al., 2007; Muzathik, et al., 2009; Ahmed, 2010; Safari, 2010; Ohunakin,, 2011). The Weibull parameters c and k can be calculated from the mean and standard deviation:
4
Mersing, Pulau Langkawi, Sandakan and Tawau from MMD shown a point distribution of wind speed on the map only. Spatial wind speed distribution in Malaysia is required to identify for the allocation of potential sites. So, the IDW method was aid to calculate the unknown wind speed values for the surrounding area, drawing a spatial wind speed distribution for Malaysia. The IDW method estimates an unknown value as the weighted average of its surrounding points, in which the weighted value is the inverse of the distance raised to a power (Zhang & McGrath, 2004; Wang, 2006). Equation 1 shows the expression of IDW.
(6) where, zu is the unknown value of estimated at u; zi is the attribute value at control point i; diu is the distance between points i and u; s is the number of control points used in estimating and k is a factor. Meanwhile, coordinate system or map projection is necessary for Geographic Information System (GIS) mapping. In this study, coordinate system for the spatial wind speed distribution is based on the World Geodetic System (WGS). Results and Discussion
(4) (5) Inverse Distance Weighted (IDW) Interpolation of Wind Speed Measured wind speeds at a height of 10 m for the year 2009 at stations Bintulu, Kota Kinabalu, Kuala Terengganu, Kuching, Kudat,
Wind Speed Trend An initial wind resource available could be evaluated via plotting graph. Figure 2 shows the monthly mean wind speed at a measured height (10 m) for selected potential sites. During the Northeast monsoon, Bintulu, Kuala Terengganu, Kuching, Mersing, Pulau Langkawi and Sandakan obtained higher value of wind speed. In contrast, Kota Kinabalu, Kudat and Tawau obtained higher value of wind speed during the Southwest monsoon. Over the year, the highest wind speed was obtained in January at Mersing
J. Sustain. Sci. Manage. Volume 9 (2) 2014: 1-20
1.indd 4
11/16/14 4:02 PM
WIND CHARACTERISTICS AND GIS-BASED SPATIAL WIND MAPPING STUDY IN MALAYSIA
5
Figure 2: Monthly Measured (10 m) Wind Speed for 2009 Table 1: The Location, Values of Surface Roughness Length and Ground Surface Friction Coefficient, α Station Bintulu
Latitude
Longitude
3°07' N
113°01' E
Terrain Description Fallow Field
z0(m)
α
0.03
0.131
Kota Kinabalu
5°56' N
116°03' E
Blown Sea
0.0005
0.097
Kuala Terengganu
5°23' N
103°06' E
Suburbs
1.5
0.257
Kuching
1°29' N
110°20' E
Suburbs
1.5
0.257
Kudat
6°55' N
116°50' E
Hedges
0.25
0.188
Mersing
2°27' N
103°50' E
Few trees
0.1
0.16
Pulau Langkawi
6°20' N
99°44' E
Fallow field
0.03
0.131
Sandakan
5°54' N
118°04' E
Fallow field
0.03
0.131
Tawau
4°18' N
118°07' E
Forest and woodlands
0.5
0.213
site, where the mean wind speed recorded at 4.76 m/s. Whereas, Kudat showed the highest mean wind speed from August to October. The highlighted part in Figure 2 was Mersing and Kudat showed a higher value of mean wind speed. In addition, the results revealed that wind speed at Mersing was affected by the monsoon and higher wind speed could be obtained in Mersing during Northeast monsoon. Meanwhile, higher wind speed could be obtained in Kudat during Southwest monsoon.
measured wind speeds at the height 10 m for the nine selected potential sites. At the same time, the ground surface friction coefficient, α, obtained by equation 3 and showed in Table 1. Likewise, the surface roughness for each MMD station was determined through satellite image in Google Earth. The ground surface friction coefficient, α, were directly proportional to the surface roughness, smoother the surface roughness gave smaller value to α. Then, the higher value of α gave a higher rate of change in the extrapolation of the wind speed.
Wind Speed Variation with Height
Wind turbine is categorized into three major groups which are household-size, rotor diameter less than 3 m, hub height below 50 m; Mediumsize, rotor diameter from 10 to 15 m, hub height below 100 m; and Large wind turbine, rotor
Wind speed varies with height. Thus, wind speeds at the height of 20, 40, 60, 80, 100 m were extrapolated by equation 2 based on
J. Sustain. Sci. Manage. Volume 9 (2) 2014: 1-20
1.indd 5
11/16/14 4:02 PM
M. Z. Ibrahim et al.
diameter from 50 to 60 m, hub height are 100 m and above (Gipe, 2004). A survey showed that there was 47% of wind turbine with cut-in wind speed below 3 m/s, 38% between 3 to 4 m/s, and 15% above 4 m/s in the Europe wind turbine market (Wineur, 2005). Hence, the focus of the wind harnessing at different height were set to 3 m/s or greater as the primary requirement. Figure 3(a-i) shows the measured wind speed at 10 m height and the extrapolated wind speeds at heights of 20, 40, 60, 80, and 100 m. The results revealed that the monthly mean wind speeds for heights of 60 m and above at Mersing and Kudat were greater than 3 m/s for the entire
6
year of the study. The mean wind speeds for the 60 m height at Mersing and Kudat were in the range of 3.17-6.34 m/s and 2.86-4.47 m/s respectively. Meanwhile, 3.44-6.88 m/s and 3.15-4.92 m/s mean wind speeds were recorded for the 100 m height at Mersing and Kudat, respectively. However, Kuala Terengganu, Kuching and Sandakan also have the potential for the 100 m height, at these sites, the mean wind speeds are 2.83-4.79 m/s, 2.91-3.87 m/s and 2.72-4.01 m/s respectively. In other words, the wind resources available for wind harnessing in Mersing and Kudat at moderate height or above, 60 m and above.
a) Bintulu
b) Kota Kinabalu
J. Sustain. Sci. Manage. Volume 9 (2) 2014: 1-20
1.indd 6
11/16/14 4:02 PM
WIND CHARACTERISTICS AND GIS-BASED SPATIAL WIND MAPPING STUDY IN MALAYSIA
7
c) Kuala Terengganu
d) Kuching
e) Kudat
J. Sustain. Sci. Manage. Volume 9 (2) 2014: 1-20
1.indd 7
11/16/14 4:02 PM
M. Z. Ibrahim et al.
8
f) Mersing
g) Pulau Langkawi
h) Sandakan
J. Sustain. Sci. Manage. Volume 9 (2) 2014: 1-20
1.indd 8
11/16/14 4:02 PM
WIND CHARACTERISTICS AND GIS-BASED SPATIAL WIND MAPPING STUDY IN MALAYSIA
9
i) Tawau
Figure 3(a-i): Monthly Wind Speed (m/s) Varies with Height in 2009
Wind Direction Wind direction was another significant wind characteristic, showing the frequency of wind blowing from. Figure 4(a-i) shows the wind rose for wind speed at the measured height (10 m) in the year 2009. Even though Malaysia’s weather was affected by both the northeast monsoon and the southwest monsoon, the wind directions are influenced by the land and sea breezes. Referring a) Bintulu
to the geographical locations (Figure 1) in Bintulu, Kota Kinabalu, and Tawau, the wind direction affected by land and sea breezes were clearly shown. In year 2009, there was a small percentage of the wind speed in the range of 7.00 – 8.50 m/s blow from direction southwest at Kudat, from direction north, northeast, southeast at Mersing, and from the direction northeast of Sandakan. b) Kota Kinabalu
J. Sustain. Sci. Manage. Volume 9 (2) 2014: 1-20
1.indd 9
11/16/14 4:02 PM
M. Z. Ibrahim et al.
10
c) Kuala Terengganu
d) Kuching
e) Kudat
f) Mersing
g) Pulau Langkawi
h) Sandakan
J. Sustain. Sci. Manage. Volume 9 (2) 2014: 1-20
1.indd 10
11/16/14 4:02 PM
WIND CHARACTERISTICS AND GIS-BASED SPATIAL WIND MAPPING STUDY IN MALAYSIA 11
i) Tawau
Figure 4(a-i): Wind Rose for Wind Speed at the Measured Height (10 m) in 2009
Weibull Distribution Figure 5(a-i) shows the histogram of the measured wind speed and Weibull probability distribution of wind speeds at the selected nine potential sites. All the previous graphs were only descriptive and not sufficient to evaluate the wind potential. The wind speed frequency distribution is crucial for evaluating the wind potential and the economic feasibility. The simplest and most
practical method is to use the wind distribution function. There are several density functions to describe the wind speed frequency curve. The most widely used and accepted in the specialized literature is the Weibull distribution, which was used extensively in this study. Thus, the probability of measured wind speeds at 10 m height based on the Weibull distribution were analyzed and reported.
a) Bintulu
J. Sustain. Sci. Manage. Volume 9 (2) 2014: 1-20
1.indd 11
11/16/14 4:02 PM
M. Z. Ibrahim et al.
12
b) Kota Kinabalu
c) Kuala Terengganu
J. Sustain. Sci. Manage. Volume 9 (2) 2014: 1-20
1.indd 12
11/16/14 4:02 PM
WIND CHARACTERISTICS AND GIS-BASED SPATIAL WIND MAPPING STUDY IN MALAYSIA 13
d) Kuching
e) Kudat
J. Sustain. Sci. Manage. Volume 9 (2) 2014: 1-20
1.indd 13
11/16/14 4:02 PM
M. Z. Ibrahim et al.
14
f) Mersing
g) Pulau Langkawi
J. Sustain. Sci. Manage. Volume 9 (2) 2014: 1-20
1.indd 14
11/16/14 4:02 PM
WIND CHARACTERISTICS AND GIS-BASED SPATIAL WIND MAPPING STUDY IN MALAYSIA 15
h) Sandakan
i) Tawau
Figure 5(a-i): Histogram and Weibull Distribution for Measured Wind Speed at the 10 m Height in 2009.
J. Sustain. Sci. Manage. Volume 9 (2) 2014: 1-20
1.indd 15
11/16/14 4:02 PM
M. Z. Ibrahim et al.
16
The Weibull distribution parameters shape and scale were summarized in Table 2. Mersing was the most probable to have higher wind speed due to the significant value of the Weibull scale parameter, 3.28 m/s. Also, there was less wind speed variation at Mersing, due to larger values of the Weibull shape parameter, 2.24. Besides, Kudat has a second higher probability to have higher wind speed; the scale parameter is 2.86 m/s. However, there was more wind speed variation in Kudat, 1.67, the lowest shape parameter. At other potential sites which are Sandakan and Kota Kinabalu, both have higher wind speed, 2.66 m/s and 2.47 m/s scale parameter respectively. Both Sandakan and Kota Kinabalu have less wind speed variation as well, 1.95 and 2.08 respectively. Table 2: Weibull Parameter, k and c Shape, k
Scaler, c (m/s)
Bintulu
1.91
2.02
Kota Kinabalu
2.08
2.47
Kuala Terengganu
1.93
2.18
Kuching
1.78
2.00
Kudat
1.67
2.86
Mersing
2.24
3.28
Pulau Langkawi
1.76
2.30
Sandakan
1.95
2.66
Tawau
1.68
1.97
Station
a) January
IDW Interpolation of Wind Speed Spatial wind mapping provides a visual determination of potentially higher wind resources. Figure 6(a-l) shows the monthly wind mapping in Malaysia at the selected locations. The areas that have low wind speed or high wind speed can be determined by the colors from red to green. IDW method estimates an unknown value as the weighted average of its surrounding points, in which the weighted value is the inverse of a distance raised to a power (Chang, 2004; Wang, 2006). Thus, the wind speed in Malaysia showed a decreasing trend when the distance from the selected meteorological stations is increasing. IDW interpolation is that all predicted values are within the range of maximum and minimum of the known points (Chang, 2004). Results showed that, south of the Peninsular Malaysia remained in green, most of the high wind speeds over the year. During the northeast monsoon, November until March, the state of Johor showed the highest wind speed distribution. In January, the highest wind speeds occurred during the month of the northeast monsoon, when the range of wind speeds was 1.50 – 4.76 m/s. In the transition period, April, the highest wind speeds can be found at the south of the Peninsular Malaysia and the tip of Borneo in the range of 1.65 – 2.55 m/s. Next, at the beginning of the southwest Monsoon, May to July, the southern part of Peninsular Malaysia also showed high wind speeds. However, at the end of the southwest monsoon, August to October, the highest wind speeds were found at the tip of Borneo. b) February
J. Sustain. Sci. Manage. Volume 9 (2) 2014: 1-20
1.indd 16
11/16/14 4:02 PM
WIND CHARACTERISTICS AND GIS-BASED SPATIAL WIND MAPPING STUDY IN MALAYSIA 17
c) March
d) April
e) May
f) June
g) July
h) August
J. Sustain. Sci. Manage. Volume 9 (2) 2014: 1-20
1.indd 17
11/16/14 4:02 PM
M. Z. Ibrahim et al.
18
i) September
j) October
k) November
l) Disember
Figure 6(a-l): Interpolated Wind Speed at Measured Height (10 m)
Conclusion
Acknowledgements
Initial study of wind resources is essential to conduct for the exploitation of wind energy in Malaysia. Secondary wind data are not measured for the purpose of wind energy, but it only provides an initial idea about the wind characteristics in the potential sites. A spatial wind mapping is very useful for initial feasibility study of wind development sites on the decision making and planning.
The authors would like to thank the Ministry of Science, Technology and Innovation of Malaysia (MOSTI) for their financial support. The authors also thank the Malaysian Meteorological Department (MMD) for the wind data it provided for this study.
Mersing and Kudat are considered potential sites with average 3 m/s above at 60 m high. IDW spatial wind mapping showed that the southern part of Peninsular Malaysia has higher wind resources than other areas. In addition, the Weibull distribution also proved that Mersing has potentially high wind resources.
References Ahmed, A. S. (2010). Wind Energy as a Potential Generation Source at Ras Benas, Egypt. Renewable and Sustainable Energy Reviews, 14(8): 2167-2173. Alghoul, M. A., Sulaiman, M. Y., Azmi, B. Z., & Wahab, M. A. (2007). Wind Energy Potential of Jordan. International Energy Journal, 8: 71-78.
J. Sustain. Sci. Manage. Volume 9 (2) 2014: 1-20
1.indd 18
11/16/14 4:02 PM
WIND CHARACTERISTICS AND GIS-BASED SPATIAL WIND MAPPING STUDY IN MALAYSIA 19
Celik, A. N. (2003). A Statistical Analysis of Wind Power Density Based on the Weibull and Rayleigh Models at the Southern Region of Turkey. Renewable Energy, 29(4): 593-604. Cellura, M., Cirrincione, G., Marvuglia, A., & Miraoui, A. (2007). Wind Speed Spatial Estimation for Energy Planning in Sicily: Introduction and Statistical Analysis. Renewable Energy, 33(6): 1237-1250. Chang, K. T. (2004). Introduction to Geographic Information Systems, (2nd ed.). New York: McGraw-Hill. Gipe, P. (2004). Wind Power. London: James & James. Global Wind Energy Council (GWEC). (2010). Global Wind 2009 Report. Belgium: Global Wind Energy Council. Hossain, J., Sinha, V., & Kishore, V. (2011). A GIS Based Assessment of Potential for Windfarms in India. Renewable Energy, 36(12): 3257-3267. Hossian, J. (2009). Wind Energy Resources. In V. Kishore (Ed.), Renewable Energy Engineering and Technology: Principles and Practice, 435-486. UK: Teri Press. Lu, L., Yang, H., & Burnett, J. (2002). Investigation on Wind Power Potential on Hong Kong Islands – An Analysis of Wind Power and Wind Turbine Characteristics. Renewable Energy, 27(1): 1-12. Lun, I. Y., & Lam, J. C. (2000). A Study of Weibull Parameters Using Long-term Wind Observations. Renewable Energy, 20(2): 145-153. Manwell, J. F., McGowan, J. G., & Rogers, A. L. (2002). Wind Energy Explained: Theory, Design and Application. England: John Wiley & Sons. Mathew, S. (2006). Wind Energy Fundamentals, Resource Analysis and Economics. Netherlands: Springer. Muzathik, A. M., Ibrahim, M. Z., Wan Nik, W. B., & Samo, K. B. (2009). Wind Resource Investigation of Terengganu in the WEST
Malaysia. Wind Engineering, 33(4): 389402. Ohunakin, O. S. (2011). Wind Resources in North-East Geopolitical Zone, Nigeria: An Assessment of the Monthly and Seasonal Characteristics. Renewable and Sustainable Energy Reviews, 15(4): 1977-1987. Promsen, W., Masiri, I., & Janjai, S. (2012). Development of Microscale Wind Maps for Phaluay Island, Thailand. Procedia Engineering, 32: 369-375. Ramachandra, T. V., & Shruthi, B. V. (2004). Wind Energy Potential Mapping in Karnataka, India, using GIS. Energy Conversion and Management, 46(9-10): 1561-1578. Ramírez, P., & Carta, J. A. (2005). Influence of the Data Sampling Interval in the Estimation of the Parameters of the Weibull Wind Speed Probability Density Distribution: A Case Study. Energy Conversion and Management, 46(15-16): 2419-2438. Rehman, S., Halawani, T. O., & Husain, T. (1994). Weibull Parameters for Wind Speed Distribution in Saudi Arabia. Solar Energy, 53(6): 473-479. Safari, B. (2010). Modeling Wind Speed and Wind Power Distribution in Rwanda. Renewable and Sustainable Energy Reviews, 15(2): 925-935. Seguro, J. V., & Lambert, T. W. (2000). Modern Estimation of the Parameters of the Weibull Wind Speed Distribution for Wind Energy Analysis. Journal of Wind Engineering and Industrial Aerodynamics, 85(1): 75-84. Sørensen, B. (1991). A History of Renewable Energy Technology. Energy Policy, 19(1): 8-12. Sreevalsan, E., Shankar Das, S., Kumar R, S., Arivukkodi, G., & Badge, J. (2010). India Wind Atlas. Chennai: Centre for Wind Energy Technology (C-WET). Unit Perancang Ekonomi, Jabatan Perdana Menteri. (2010). Rancangan Malaysia Kesepuluh 2011-2015. Malaysia: Unit
J. Sustain. Sci. Manage. Volume 9 (2) 2014: 1-20
1.indd 19
11/16/14 4:02 PM
M. Z. Ibrahim et al.
Perancang Ekonomi, Jabatan Perdana Menteri. Wang, F. (2006). Quantitative Methods and Applications in GIS. US: Taylor & Francis. Weather Phenomena. (2009). Monsoon. Retrieved 2 January, 2010, from http:// www.kjc.gov.my/english/education/weather/ monsoon01.html Weisser, D. (2003). A Wind Energy Analysis of Grenada: An Estimation Using the ‘Weibull’ Density Function. Renewable Energy, 28(11): 1803-1812.
20
Wineur. (2005). Urban Wind Turbines Technology Review. A Companion Text to the Catalogue of European Urban Wind Turbine Manufacturers. Europe: Wineur. Yoreley, C. S., & Jorge , X. B. (2008). Statistical Analysis of Wind Power in the Region of Veracruz (Mexico). Renewable Energy, 34(6): 1628-1634. Zhang, C., & McGrath, D. (2004). Geostatistical and GIS Analyses on Soil Organic Carbon Concentrations in Grassland of Southeastern Ireland From Two Different Periods. Geoderma, 119(3-4): 261-275.
J. Sustain. Sci. Manage. Volume 9 (2) 2014: 1-20
1.indd 20
11/16/14 4:02 PM


![ENVIRONMENTAL CASE STUDY Wind energy Wind energy: the ... [PDF]](https://m.moam.info/img/260x300/environmental-case-study-wind-energy-wind-energy-t_648b05dc098a9e9a098b4574.jpg)


