Mock-up for Proceedings of PORSEC 2000 (Goa, 5th-8th Dec. 2000). Vol. I, 305-309
Wind, Waves and Rain: Changes in spatial distribution and intercorrelation G.D. Quartly, T.H. Guymer and M.A. Srokosz Southampton Oceanography Centre, Empress Dock, Southampton, Hants, SO14 3ZH, UK email:
[email protected] Abstract Dual-frequency altimeters provide us with simultaneous measurements of wind speed, wave height and rain rate. We examine the spatial patterns in these three variables in the Indian Ocean, using 1995 as a representative year. We also look at their intercorrelations, noting how the sea state in the Arabian Sea varies according to the phase of the monsoon, and also that the rain in the equatorial region tends to be associated with swell conditions. Studying data during the recent El Niño indicates that, in the Indian Ocean, MarchApril 1998 (i.e. the end of the El Niño) showed a slight increase in winds and waves compared to 3 years earlier, but that the rainfall was considerably more frequent. 1. Introduction Satellite-borne altimeters provide estimates of significant wave height, Hs, and the normalized backscatter strength, σ0. From the latter term wind speed, u10, can be inferred (Witter and Chelton, 1991); the two operating frequencies of the TOPEX altimeter (Ku- and C-band) also allow an estimate of the differential attenuation caused by atmospheric liquid water, which can be related to rainfall rate (Quartly et al., 1999). One of the great advantages of the TOPEX altimeter is the simultaneity of its measurements of wind, waves and rain. We examine the spatial observations and intercorrelation of these measurements in the Indian Ocean, as it provides a wide variety of climatic regimes (Fig. 1a). The Arabian Sea, in the northwest, is dominated by the monsoon, with dry winds from the northeast during November to April, and moist winds from the southwest for May to October. The Inter Tropical Convergence Zone (ITCZ), a region of low winds and high rainfall, lies in the equatorial region, with some latitudinal migration with season. The southern region is influenced by the SE Trade Winds throughout the year, and generally has higher waves than the other regions on account of the longer fetch in that region. 2. Processing Previous studies of wave height and wind speed from the TOPEX altimeter have concentrated on the values determined from the Ku-band measurements. For such studies, any data possibly contaminated by rain is discarded, using a combination of tests involving data from the on-board radiometer and the standard error in the estimate of Hs. As we wish to examine the wind and wave conditions associated with rain, we cannot afford to discard such data; instead we use the Hs and σ0 data from C-band, which is much less affected by the rain. The σ0C values can be converted to equivalent σ 0Ku using the empirical relationship between the two (Quartly et al., 1999), and then a standard wind speed algorithm applied (Witter and Chelton, 1991). The
20
1
0
2
-20
3
20
7
0
5
-20
3
Wind Speed (m/s)
b)
c) 20
3
0
2
-20
1
Wave Height (m)
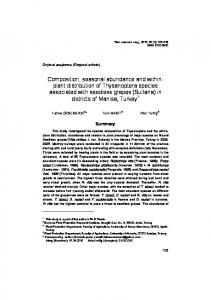
3. Spatial distributions To provide complete sampling of the diurnal cycle (as it can be significant for rainfall) we aggregate the wind, wave and rain data in 2month periods (see Quartly et al., 1999). Figure 1 shows the mean values of these parameters, over the Indian Ocean for the period March-April 1995. Significant winds (greater than 7 ms-1) are found in the south (Fig. 1b), with the highest values banded along 20˚S; however, during this season, all regions north of 10˚S have much gentler conditions, with several areas having average winds less than 3 ms-1. The mean winds within 5˚ of the equator are always low, but the intensity in both the other regions increases during the year, peaking in July-August. Then, the strongest mean winds in the south lie near 15˚S, with averages exceeding 10 ms-1; some regions in the Arabian Sea have average winds of 12 ms-1, but with much lower levels immediately outside this 2-month interval. Not too surprisingly the mean wave height shows the same general spatial distribution and seasonal trends, with highest values in the
a)
d) 20
5
0
3
-20
1 40
60
80
100
Fig. 1. a) Extent of Indian Ocean covered in this study, with 3 special regions marked (1 Arabian Sea; 2 - Equatorial region; 3 - S. Indian Ocean). b), c) and d) Mean wind speed, wave height and frequency of occurrence of rain for 5˚x5˚ boxes during March-April 1995.
Frequency of rain (%)
wave height averaged over a footprint several kilometres across varies gradually, with the Hs values at the two frequencies generally agreeing to within 0.2m (Quartly, 2000); however the presence of rain in the footprint can lead to derived Hs values many metres larger than in adjacent footprints, due to distortion of the waveforms. Although the shape of the C-band waveforms is relatively unaffected, they too may still yield anomalously large values, because of mispositioning within the tracker window. Quartly (1997) showed how this might be ameliorated by retracking the waveform data, but that is computationally intensive. Here we take the C-band values of σ 0 and Hs from the 1 Hz Geophysical Data Records (GDR) and apply a 13point median filter to deal with such anomalies, since in the absence of rain, these derived parameters usually change gradually.
Wave Height (m) Wave Height (m)
b)
c) Wave Height (m)
4. Wind-Wave correlations It is apparent that there are some similarities in the spatial patterns of areal average winds and waves, with the highest wave heights generally being found in the regions of highest wind speeds (see Fig. 2a). Indeed there is not only a connection in the regions affected, but also between the individual 1 Hz observations in a region. Figures 2b and 2c show the simultaneous observations of u10 and Hs for all three regions; the curved line shows the Pierson-Moskowitz relationship. That relationship indicates the expected wave height if the waves are in equilibrium with the winds; points below the curve have lower wave height than expected, and are thus developing seas, whilst those above are dominated by swell surviving from earlier stormy winds. The scatter of mean wave height against mean winds (Fig. 2a) shows a tight distribution, with all point lying above the Pierson-Moskowitz curve. The individual points for the same season show a much wider distribution, including some points lying below the curve. Careful examination of Fig. 2b shows that for a given wind speed the typical wave heights in the Arabian Sea are less than in the equatorial region, which are less than in the southern region. This is due to the short fetch for winds in the Arabian Sea
a)
d) Wave Height (m)
southern section (see Fig. 1c) and the largest wave heights in July-August, when the seasonal mean for some parts of the Arabian Sea can be nearly 4m. During March-April 1995 there is precipitation throughout the equatorial region, with the likelihood of significant rainfall (more than 2.5 mm hr-1) being 10% for regions just to the west of Indonesia, but less than 1% for large parts of the S. Indian Ocean. During the year the equatorial rain band moves away from the coast of Africa, so that by July-August nearly all the region with a rain probability exceeding 3% lies in the Bay of Bengal or the equatorial region to the west of Indonesia.
6
4
2
0 6
4
2
0 6
4
2
0 6
4 Jul-Aug May-Jun
2
Mar-Apr
0
0
5 10 Wind Speed (m/s)
15
Fig. 2. Correlation of wind speed and wave height observations. a) Scatter plot of mean winds and waves in 5˚ x 5˚ boxes for MarchApril 1995. b) Scatter plot of individual 1 Hz observations during March-April 1995 (with 'x', 'o' & '+' for regions 1, 2 & 3, and only a subset of points actually shown). c) Same as Fig. 2b but for July-August 1995. d) Indication of extent of scatter of points for the Arabian Sea for three 2-month intervals (each pair of lines shows mean wave height ± 1 std. dev. for given wind speed). [Added curves on Figs. 2a-c denote the Pierson-Moskowitz relationship.]
during the NE monsoon, as the wind is then blowing off the land onto the sea. During the higher wind conditions of July-August, with increased winds and waves for all 3 regions, there is no clear separation of the points for each region (Fig. 2c). The change in sea state development for the Arabian Sea is summarised in Fig. 2d, where the scatter of points is represented by a pair of lines giving the mean wave height ± 1 std. dev. for a given wind speed. March-April is marked by quiet conditions, where a wind speed of, say 5 ms-1, would be associated with a wave height of 1m. May-June has much larger wind speeds within its range of observations, and the typical wave height for a wind speed of 5 ms-1 is 1.5m. By July-August there are no light winds, and those of 5 ms-1 are associated with a wave height of 2.5m. [The results for September-October are similar to May-June and the other 2-month seasons are like March-April.] Similar observations hold for the other regions i.e. that for a given wind speed the wave heights are greatest in July-August and least for November-April, although the magnitude of the changes is less pronounced than for the Arabian Sea.
Frequency of rain (%)
Wave Height (m)
Wave Height (m)
5. Wind-Wave conditions associated with rain in the equatorial region A similar analysis of wind-wave conditions may be performed for occasions known to be rainy. By dividing the number of rainy points for a) a given sea state by the total number of observations of that condition, one may determine 4 the likelihood of rain for a given wind-wave combination. In the equatorial region (Fig. 3) this likelihood varies markedly with the conditions. 2 During March-April (Fig. 3a) rain is at its most probable for winds exceeding 8 ms-1, and with wave heights just below the added curve i.e. for 0 b) developing seas. A slightly different picture emerges for July-August (Fig. 3b) — then the 4 6 greatest likelihood of rain is for low wind speeds 4.5 and high wave heights i.e. swell conditions. Values are not shown for wind less than 2 ms-1, as 2 3 the interpretation of backscatter strength in terms 1.5 of wind speed and rainfall rate is not reliable for 0 high values of σ (low winds). 0 0 2 5 8 11 14 Of the two seasons shown in Fig. 3, it is Wind Speed (m/s) the March-April one that is anomalous. For the equatorial region, all the 2-month periods show Fig. 3 Frequency of occurrence of rain in the equatorial Indian Ocean for given windthe highest likelihood of rain for high wave wave conditions. a) March-April 1995, b) heights; only March-April 1995 shows such a July-August 1995. [No values calculated high probability of rain for developing conditions. unless there are at least 50 observations of that particular sea state. Added curve A plot of the wave height p.d.f. for rainy denotes the Pierson-Moskowitz conditions is thus skewed towards higher Hs relationship.] values than the p.d.f. for all conditions. As the difference is only moderate and the frequency of rain no more than 10% on average for the region there is not much bias in using the mean Hs value
7
0
5
-20
3
Wind Speed (m/s)
20
20
3
0
2
-20
1
Wave Height (m)
b)
20
5
0
3
-20
1 40
60
80
Frequency of rain (%)
c)
100
d) 7.5
4
6 4.5
2
3 1.5
0
2
5
8
11
14
Frequency of rain (%)
6. Changes during the 1997/98 El Niño The analysis so far has been for 1995, although similar results are found for 1996. In this section we look at some of the changes in precipitation statistics associated with the recent El Niño, which commenced in May 1997, showed maximal seasonal anomalies in winds, mixed layer depth, SST and rainfall during early 1998 (McPhaden, 1999, Quartly et al., 1999) and then decayed rapidly in May 1998. In November-December 1997 (not shown) we note a strong rain signature for the ITCZ lying around 5˚N i.e. significantly north of its location for that season in 1995, with wind and wave fields slightly reduced. During January-February 1998 the ITCZ lies on or just to the south of the equator, and the wind and wave fields are as for that period in 1995. In Fig. 4 we show the spatial patterns of wind, waves and rain and their intercorrelation for March-April 1998. Early 1998 was not only the peak of the El Niño signal in the equatorial Pacific, but also marked by the highest rainfall for 6 years in both the tropical and southern parts of the Indian Ocean (Quartly et al., 1999). This is because, as in the Pacific, the rain in the Indian section of the ITCZ (Fig. 4c) was more pronounced and located further south than normal (cf. Fig. 1d). The wind field for March-April 1998 (Fig. 4a) is similar to that of 3 years earlier, but with the
a)
Wave Height (m)
for "dry" conditions as an estimate of the mean for the region. [Such a slight bias is incurred when one uses K u -band data and discards all the observations possibly contaminated by rain.] However, greater errors can occur when one is interested in joint products of wind, waves and rain, such as for predicting the spectra of underwater acoustic noise. [In such cases, moderate winds can severely reduce the sound of light rain (Medwin et al., 1990).] Studies using wind, wave and rain observations from different spacecraft cannot readily allow for the correlations between these 3 parameters, because they change on such short time scales.
0
Wind Speed (m/s) Fig. 4 Meteorological conditions in the Indian Ocean for March-April 1998. a) Wind speed, b) Wave height, c) Rain rate, d) Likelihood of rain in the equatorial region for given wind-wave conditions. [No values calculated unless there are at least 50 observations of that particular sea state. Added curve denotes the P-M relationship.]
band of highest mean winds being centred further south at 25˚S and of slightly greater magnitude. The mean wave heights (Fig. 4b) also appear similar to those of 1995. Examining the distribution of data in wind-wave space (Fig. 4d) one notes that for all wind speeds there are a significant number of wave height observations over 2.5m in March-April 1998, which were not present 3 years earlier, and also that these higher wave heights have a higher likelihood of rain. The change in the sea state conditions associated with rain is most pronounced in the March-April period, probably due to the large extent of the Doldrums then lying to the north of the ITCZ. 7. Summary and Discussion In this paper we have examined the wind speed, wave height and rain data determined from the TOPEX altimeter over the Indian Ocean. Some investigations of atmosphere-ocean fluxes only require knowledge of one of these 3 fields; however studies of gas transfer or the production of underwater acoustic noise require knowledge of more than one of these variables. Where non-linear processes are involved it is not sufficient to take mean values of these fields in order to yield a mean flux. By making simultaneous observations of all these variables, TOPEX has provided a dataset that allows us to examine the correlations between these three fields. There is a very simple relationship between winds and waves in equilibrium with them (Pierson and Moskowitz, 1964), but many observations (e.g. Challenor and Srokosz, 1991) have shown that there is a wide scatter in wind-wave observations, with the majority of open ocean points containing swell. Figure 2a reminds us that using mean climatologies does not sample the scatter experienced by individual observations; for example none of the open ocean locations show developing seas on average. The scatter in simultaneous wind-wave observations varies both regionally (Figs. 2b,c) and with season (Fig. 2d), as different wind directions afford different lengths or durations of fetch. The likelihood of rain is also shown to vary with wind-wave conditions. Quartly et al. (1999) noted that in mid- and high-latitudes rain occurred preferentially in developing seas, typical of mid-latitude storms. They also found that rain in the tropics was associated with swell, and ascribed this to rain there tending to occur on the periphery of depressions, with the swell propagating out from the central windy region. In this paper we find similar results in a specific study of the Indian Ocean, but note that in March-April 1995 there was significant rain in the equatorial region during conditions of developing seas. In March-April 1998, near the end of the recent El Niño, the wind and wave fields were marginally greater than normal. The ITCZ, which in November-December 1997 had been more intense than its seasonal average and located further north, moved south during March-April 1998 and increased even more in intensity, with the extra rain being associated with swell conditions. Acknowledgements The data used in this study were the Merged GDR, provided on CD by AVISO/Altimetry. References Challenor, P.G. and M.A. Srokosz., 1991, Wave studies with the radar altimeter, Int. Jour. Rem. Sensg., 12, 1671-1686. McPhaden, M.J., 1999, Genesis and evolution of the 1997-98 El Niño, Science, 283, 950-954. Medwin, H., A. Kurgan and J.A. Nystuen, 1990, Impact and bubble sound from raindrops at normal and oblique incidence, J. Acoust. Soc. Am., 88, 413-418. Pierson, W.J. and L. Moskowitz, 1964, A proposed spectral form for fully-developed wind seas based on similarity theory of S.A. Kitaigorodskii, J. Geophys. Res., 69, 5181-5190.
Quartly, G.D., 1997, Achieving accurate altimetry across storms: Improved wind and wave estimates from Cband, J. Atmos. Oceanic Technol., 14, 705-715. Quartly, G.D., 2000, The gate dependence of geophysical retrievals from the TOPEX altimeter, J. Atmos. Oceanic Technol., 17, 1247-1251. Quartly, G.D., M.A. Srokosz, and T.H. Guymer, 1999, Global precipitation statistics from dual-frequency TOPEX altimetry, J. Geophys. Res., 104, 31489-31516. Witter D.L. and Chelton D.B., 1991, A Geosat altimeter wind speed algorithm and a method for altimeter wind speed algorithm development. J. Geophys. Res., 96, 8853-8860.