J.S.Prasath. Asst. Professor, Dept. ... via the sinoatrial (SA) node located in the upper right atrium. The SA .... with MATLAB by Graphical user interface (GUI). Fig.
ISSN: 2277 – 9043 International Journal of Advanced Research in Computer Science and Electronics Engineering (IJARCSEE) Volume 2, Issue 2, February 2013
Wireless monitoring of Heart Rate using Microcontroller J.S.Prasath Asst. Professor, Dept. of EIE, Hindustan University.
Abstract - This paper describes the development of
of heart disease using ECG signals may be achieved
wireless monitoring of a heart rate based on a
by either correlating the pattern of the ECG signal
microcontroller. We can record the ECG signals and
with a typical healthy signal, characterizing the
Heart beats of all patients in a single computer. These
typical ECG signal using basic logical decisions, or
biomedical signals are acquired and then processed
more complicated algorithms to process in depth the
with a microcontroller. After processing, all data are
heart disease. The first approach requires complicated
sent to a communication interface that can send this
mathematical
information to a personal computer. For the patient
diagnosis, while the second one involves only simple
suffering from the cardiac disease it is very necessary
analysis in most cases.
to perform accurate and quick diagnosis. For this
Electrical signals from the heart characteristically
purpose a continuous monitoring of the ECG signal,
precede
patient’s current heart rate and BP are essential. We
monitoring
can monitor the patient’s ECG signal by using
significance. The ECG provides valuable information
Bluetooth transmission and reception in the central
about a wide range of cardiac disorders such as the
place in any hospital. The MATLAB software is used
presence
to simulate the ECG waveform.
enlargement of the heart muscle.
Keywords - Microcontroller, Bluetooth,
II. NEED OF WIRELESS TRANSMISSION
Instrumentation amplifier, Filter, MATLAB
An ECG/Blood Pressure signal is useful for a doctor
the
analysis
normal these
of
an
to
obtain
mechanical
signals
inactive
has
part
the
required
function great
and
clinical
(infarction)
or
to evaluate a patient’s heart condition relating to whether a heart attack has occurred - What parts of
I. INTRODUCTION Early diagnosis for heart disease is typically based on recording of ElectroCardioGram (ECG) signal which is then studied and analyzed using a microcontroller. This paper presents the design and implementation of a compact microcontroller-based system used for wireless monitoring of heart rate on real time. An electrocardiogram (ECG) is a test that records the electrical activity of the heart. ECG is used to measure the rate and regularity of heartbeats as well as the size and position of the chambers, the presence of any damage to the heart and the effects of drugs or devices used to regulate the heart. Diagnosis
the heart is damaged - Irregular heartbeats - Whether the heart is not receiving enough blood or oxygen It has been demonstrated, an ECG/Blood Pressure signal
is
extremely
valuable,
making
it
a
conventional mechanism used in hospitals by both doctors and nurses. Similarly it provides the doctor or nurse with a trouble-free approach to the patient’s ECG/Blood Pressure signal. In fact, for patients in rural and regional areas an ECG report could be sent to a doctor for examination. Thus, this is a system in which the doctors at his/her house can treat the patient in the emergency condition in the hospital.
214 All Rights Reserved © 2013 IJARCSEE
ISSN: 2277 – 9043 International Journal of Advanced Research in Computer Science and Electronics Engineering (IJARCSEE) Volume 2, Issue 2, February 2013
III. WIRELESS COMMUNICATION
70 beats/minute. This action potential travels across
The wireless technologies such as Bluetooth,
the nerves of the atria causing depolarization and
GPRS, GSM or Wi-Fi allow wireless transmission to
contraction, resulting in the P wave. The electrical
health or control centers. This system describes a
signal
low-cost, portable system with wireless transmission
Atrioventricular (AV) node where a brief delay
capabilities for the acquisition, processing, storing
(~0.15 seconds) allows for atrial emptying (into the
and visualization in real time of the electrical activity
ventricles). The AV node transmits the signal to the
of the heart to a Personal Computer. The data
Purkinje fibers (also called the Bundle of His) to
acquisition unit, built here transmits ECG and BP
cause ventricular depolarization and contraction,
signals
Bluetooth
depicted as the QRS complex. Specifically, the peak
technology was used in the system for reliable
of the R segment denotes the beginning of ventricular
communication.
contraction. Post contraction begins a phase of
using
Bluetooth
technology.
continues
from the
SA
node
to
the
repolarization, the T wave, in which blood is pumped
IV. THE ECG Signal The ECG signal measures the electrical activity
from the ventricle chambers to the lungs or body. The
of specialized heart cells that generate repetitive self-
T wave diffuses differently than the QRS complex,
induced action potentials. Each action potential
beginning in the outer segments of the ventricles and
generated leads to a contraction of the heart muscle
propagating inward thus creating a lower amplitude
and thus the heartbeat.
signal. Occurring shortly after the T wave, the U wave is the repolarization of the Purkinje fibers (rarely detectable
due
to
low SNR).
These
contractions are a result of synchronized action potentials controlling all myofibrils (muscle fibers) to produce the electrical signals collectively called the cardiac cycle. The ECG signal can be visually represented by three major waves which are synchronized with the heart activity. The focus of the
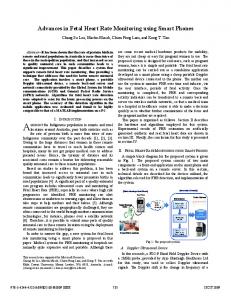
Fig.1 The Heart Conduction System The heart is divided into four distinct chambers. The upper chambers of the heart are called the Atria. They are electrically stimulated first. After some delay for allowing the atria to empty their contents, the lower chambers, called the Ventricles, are then stimulated. Initially, the right and left atria (also called auricles) are electrically stimulated to contract via the sinoatrial (SA) node located in the upper right atrium. The SA node is motivated through action potentials to maintain a heart rate of approximately
project relates to the basic measure that is related to the heart rhythm, the heart rate.
Heart Rate Calculation The number of beats per minute is calculated using a three beat average. In the main function of the supporting software, the time scale is tracked using two variables, counter and pulse period. Pulse period is incremented by one during every sample period, and because we sample at a rate of 512Hz, it is relatively easy to track the timescale based on the number of counts in the pulse period. Whenever there
215 All Rights Reserved © 2013 IJARCSEE
ISSN: 2277 – 9043 International Journal of Advanced Research in Computer Science and Electronics Engineering (IJARCSEE) Volume 2, Issue 2, February 2013
is a beat detected, the counter is reset. The pulse
generated by the heart’s beating, which can be used
period is accumulated for 3 consecutive beats, and on
as a diagnostic tool for examining some of the
the third beat the heart rate is calculated using the
functions of the heart. It has a principal measurement
formula below.
range of 1 to 3 mV and signal frequency range of 0.05 to 140 Hz. ECG signals were acquired through a low power consumption ECG amplifier. The ECG amplifier can construct with a gain of 1000, a CMRR
ECG Parameters
of 80dB and a frequency bandwidth of 0.05-100 Hz.
Parameter
Range
Units
Heart Rate
60 – 100
Beats Per
These signals are both amplified and filtered to the required specifications. The duration between peaks of the QRS waves can be used to calculate the beat-
Minute
to-beat heart rate. The output waveform from the
PR Interval
0.12 – 0.20
Seconds
ECG amplifier is then fed to the rest of the system.
QT Interval
0.39 + 0.04
Seconds
Proper ECG signal acquisition is carried out using
P Wave
0.12
Seconds
Duration
filters for noise suppression and amplifiers to enlarge the signal amplitude as much as possible, while keeping it within the input voltage range of the
QRS Width
0.05 – 0.1
Seconds
analog to digital converter (ADC). The task of the
T Wave
0.08
Seconds
ADC is then to digitize the analog voltage with a resolution high enough to represent the original
Duration
signal. These values can then be collected by a microcontroller connection
Fig. 2 Relationship between the heartbeat and pressure changes in the heart chambers V. BLOCK DIAGRAM Fig.3 shows the block diagram of ECG
(MCU)
with
the
which
maintains
wireless
the
transmitter.
Fig. 3 Block Diagram of microcontroller based wireless heart rate monitoring system
module. The ECG signal is an electrical signal
216 All Rights Reserved © 2013 IJARCSEE
ISSN: 2277 – 9043 International Journal of Advanced Research in Computer Science and Electronics Engineering (IJARCSEE) Volume 2, Issue 2, February 2013
VI. SIGNAL CONDITIONING CIRCUIT
Microcontroller Unit A Microchip 8-bit microcontroller AT89C51
Electrodes In order to measure potentials in the body, an interface is needed between the body and the measuring device. This function is performed by biopotential. They serve as transducers to change ionic current flowing in the body to electrical current carried by electrode wires to the measuring device. One of the most important characteristics of electrodes is that they should not polarize. This means that the electrode potential must not vary considerably even when current is passed through them. Electrodes made of Silver-Silver Chloride have been found to yield acceptable standards of performance. These electrodes are also nontoxic and are preferred over other electrodes like Zinc-Zinc Sulphate, which are highly toxic to exposed tissue. The Silver-Silver Chloride electrodes meet the demands of medical practice with their highly reproducible parameters and superior properties with regard to long term stability. Hence, these electrodes
by is used for outputting the values sequentially. It provides a variety of fast addressing modes for accessing the internal RAM to facilitate byte operations on small data structures. Microcontroller is used for storing the values of ECG and Blood Pressure waveforms. The AT89C51 is a low-power, high-performance CMOS 8-bit microcomputer with 4K bytes of Flash programmable and erasable read only memory. By combining a versatile 8-bit CPU with Flash on a monolithic chip, the Atmel AT89C51 is a powerful microcomputer which provides a highly-flexible and cost-effective solution to many embedded control applications. The Bluetooth Transmission Module Bluetooth technology is the wireless protocol used in the transmitter. Bluetooth has many advantages. First, it is available in a user-friendly modular form. There are many available Bluetooth devices which hide the Bluetooth stack and allow the user to interact with the device using simple modem commands. This reduces
were chosen for signal acquisition.
development
Instrumentation Amplifiers The instrumentation amplifier is basically a differential amplifier that amplifies the difference between the two input signals. Hence the common mode signal is effectively eliminated. Two buffer amplifiers at the input of each signal are provided to offer very high input impedance. The gain of the
time
considerably.
In
addition,
Bluetooth is a common technology on mobile phones, and this will expand the range of use for the transmitter. The Bluetooth Intelligent Serial Module HM1100 is the device selected for the wireless module.
VII. SIMULATION OF HEART RATE USING MATLAB
instrumentation amplifier is set around 1000.
The aim of the heart rate simulator is to produce
Band pass Filter To remove the unwanted frequencies in this
the typical ECG waveforms of different leads and as
case requires a highly selective band pass four order
many arrhythmias as possible. The heart rate
filter. The attenuation of low-frequency components
simulator is a Matlab based simulator and is able to
is designed to remove the baseline (or DC) drift and
produce normal lead 1 ECG waveform. Figure 4
obtain stable EGG recording.
shows the visual representation of ECG waveform.
217 All Rights Reserved © 2013 IJARCSEE
ISSN: 2277 – 9043 International Journal of Advanced Research in Computer Science and Electronics Engineering (IJARCSEE) Volume 2, Issue 2, February 2013
Fig. 5 Simulated Heart Rate waveform using ECG IX. CONCLUSION
Fig. 4 Representation of ECG waveform
In this paper, the implementation of wireless
VIII. SIMULATION RESULT OF HEART
real time analysis of ECG signal and then simulation
RATE In this experiment, an ECG waveform with standard specification like Heart beat: 72, Amplitude of P wave: 25mv, Amplitude of Q wave: 0.025mv, Amplitude of QRS wave: 1.6mv, Amplitude of S wave: 0.25mv, Amplitude of T wave: 0.35mv, Amplitude of U wave: 0.035mv, Duration of P wave: 0.09 second, Duration of Q wave: 0.066 Sec, Duration of QRS wave: 0.11 sec, Duration of S wave: 0.066 sec, Duration of T wave: 0.142 sec, Duration of U wave: 0.0476 sec, P-R interval: 0.16 sec and S-T interval: 0.18 sec taken and simulated in MATLAB. With the help of different electrode we monitor the heart bit of the heart and store the heart bit sound in AT89C51
microcontroller
monitoring of heart rate based on microcontroller for
then
stored
of these ECG signal in MATLAB has been investigated. The system has been tested successfully on simulated ECG signals. A wireless ECG transmission system, using Bluetooth device, is able to transmit, record and display the ECG signal in real time.
This
Bluetooth device. The Bluetooth device interfaced with MATLAB by Graphical user interface (GUI).
introduces
the
wireless
communication electrocardiogram detection system with the use of AT89C51 microcontroller and the communication module. Here we use bluetooth device for the wireless telemedicine. By using bluetooth transmission and reception we can monitor the ECG signal of patient in the central place in any hospital.
ACKNOWLEDGMENT
result
transmitted to personal computer with the help of
work
I wish to thank Professor Ramachandraiah for provided the guidance for this work and faculty members
of
the
EIE
department,
Hindustan
University for their great support in this work. I also thank the management of Hindustan University for their continues support and encouragement.
218 All Rights Reserved © 2013 IJARCSEE
ISSN: 2277 – 9043 International Journal of Advanced Research in Computer Science and Electronics Engineering (IJARCSEE) Volume 2, Issue 2, February 2013
2002. He got a Master degree in process control and
REFERENCES [1] S. haddab , M .laghrouche measurement
instrumentation from Annamalai University, 2007.
science review, volume 9, no.5, 2009
He presented and published the research papers in the
“microcontroller -based system for
area of underwater sensors, process control, industrial
electrogastrography monitoring through
automation and Micro-Electro Mechanical Systems.
wireless transmission “ department of
He is a member of ISTE. His research interests
electronics, mouloud mammeri university.
include
[2] Mohammad Faaiz Bin Jamaluddin. “Wireless Heart Rate Monitor”, University Teknology
process
control,
microcontroller,
microprocessor, wireless sensors and industrial automation.
Malaysia, Thesis (B. Eng), 2008. [3] Mohamed Fezari, Mounir Bousbia-Salah, and Mouldi Bedda The international arab journal of information technology, vol 5 no. 4 oct 2008 “Microcontroller Based Heart Rate Monitor “Department of electronics, University of Badji Mokhtar, Annaba . [4] T. Samaras, S. Karavasiliadou, E. Kouidi, et al.Transtelephonic electrocardiographic transmission in the preparticipation screening of athletes, International Journal of Telemedicine and Applications, vol. 1, 2008, 1-4. [5] Arif C., “Embedded Cardiac Rhythm Analysis and Wireless Transmission (WiCARE),” MS Thesis, School of Computing and Software Engineering, Southern Polytechnic State University, Marietta, Georgia, USA, 2004.
Prasath is an assistant professor in department
of
electronics
and
instrumentation
engineering at the Hindustan University, Chennai. He got a Bachelor degree in electronics and instrumentation from Madurai Kamaraj University,
219 All Rights Reserved © 2013 IJARCSEE