hensive anomaly detection strategies that jointly address network, node, and data ... While significant work on conventional network management tools exists [2], ...... anomalies, such as routing loops, are best detected with distributed or hybrid.
Chapter 12 Wireless Sensor Network Anomalies: Diagnosis and Detection Strategies Raja Jurdak, X. Rosalind Wang, Oliver Obst, and Philip Valencia CSIRO ICT Centre, Australia {raja.jurdak,rosalind.wang,oliver.obst,philip.valencia}@csiro.au Abstract. Wireless Sensor Networks (WSNs) can experience problems (anomalies) during deployment, due to dynamic environmental factors or node hardware and software failures. These anomalies demand reliable detection strategies for supporting long term and/or large scale WSN deployments. Several strategies have been proposed for detecting specific subsets of WSN anomalies, yet there is still a need for more comprehensive anomaly detection strategies that jointly address network, node, and data level anomalies. This chapter examines WSN anomalies from an intelligent-based system perspective, covering anomalies that arise at the network, node and data levels. It generalizes a simple process for diagnosing anomalies in WSNs for detection, localization, and root cause determination. A survey of existing anomaly detection strategies also reveals their major design choices, including architecture and user support, and yields guidelines for tailoring new anomaly detection strategies to specific WSN application requirements.
1
Introduction
Wireless Sensor Networks (WSNs) represent an emerging system paradigm that tightly couples the network with its deployment environment [1]. Relying on resource-constrained embedded devices for communication, processing, and sensing, WSNs can experience unexpected problems during deployment, due to hardware, software, or environmental anomalies. The volatility of WSNs is always in tension with ambitious application goals, including long term deployments of several years, large scale networks of thousands of nodes, and highly reliable data delivery. As the WSN field matures, strategies for detecting (and possibly correcting) the anomalies that are inherent to their physically coupled low-end system design will only grow in importance. In fact, providing appropriate tools that can effectively detect and respond to anomalies can greatly increase uptake of the technology by stakeholders. While significant work on conventional network management tools exists [2], WSN counterparts have been slow to gain traction within the community. One of the main challenges for WSN anomaly detection is determining where to embed the intelligence for detecting and localizing anomalies. While centralized approaches rely on more comprehensive network state information available at the back-end and are thus simpler to implement, distributed approaches A. Tolk and L.C. Jain (Eds.): Intelligence-Based Systems Engineering, ISRL 10, pp. 309–325. c Springer-Verlag Berlin Heidelberg 2011 springerlink.com �
310
R. Jurdak et al.
provide more scalable and responsive anomaly detection, as nodes can detect network problems in their vicinity immediately. A challenge for distributed anomaly detection is its implementation complexity and the limited state information available at resource-constrained sensor nodes. Another key requirement for any anomaly detection strategy is catering to the needs and to the feedback of the human operator. A user-friendly detection strategy should provide several modes of notification, such as email and SMS alerts, and adapt its frequency of alerts to user feedback, in order to avoid “crying wolf” too many times and risking user apathy to more significant alerts. An effective anomaly detection strategy should also provide the versatility to cater to diverse user requirements, supporting both network managers who require detailed diagnostic information, and end users who are only interested in data quality. A recent review article on anomaly detection in WSNs [3] focuses on data anomalies, mainly due to security attacks, and the statistical approaches for detecting them. Because of their tight coupling to often harsh physical environments, WSNs and other networks used in extreme conditions (like, e.g. in space [4]) are more likely than conventional networks to experience anomalies related to connectivity or hardware failures. Recent work also focuses on devising detection strategies that target network level [5,6], data level [7,8], or node and data level [9,10] anomalies. One shortfall of existing strategies is that none of them comprehensively addresses network, node and data level anomalies in WSNs. A common reason for this are application-specific design choices in sensor networks that tend to tailor anomalies detection strategies to a family of applications with a given set of constraints and assumptions. The lack of comprehensive anomaly detection strategies for WSNs contributes to slower adoption and more frustration in deploying and maintaining these networks. From a WSN user or operator perspective, it is crucial that a network management tool embeds the required intelligence to detect all possible anomaly types, as the network is perceived holistically as an intelligent data delivery system. To design such system-level tools demands a comprehensive understanding of all types of WSN anomalies, their likely causes, and their potential solutions. This chapter examines WSN anomalies from a systems perspective, covering anomalies that arise at the network, node and data levels. It introduces a simple process for diagnosing anomalies in WSNs for detection, localization, and root cause determination. A survey of existing anomaly detection strategies also reveals their major design choices, including architecture and user support, and yields guidelines for tailoring new anomaly detection strategies to specific WSN application requirements.
2
Types of WSN Anomalies
We begin by defining the scope of the term anomalies in this chapter. Anomalies can range from faults, such as complete hardware failures, to unexpected system
Wireless Sensor Network Anomalies: Diagnosis and Detection Strategies
311
performance, such as gradual degradation. Note that certain outliers in spatial or temporal sensor data can signify events of interest in the monitored area, and should not be reported as anomalies to the network operator unless explicitly specified. Otherwise, separate data analysis tools can handle these outliers. Observe Symptons
Determine Root Cause
Likely anomaly
Anomaly details Observe Outputs
Determine Scope How widespread it is
Who's responsible
Check Detection Metric
Check Localization Metric Definite anomaly
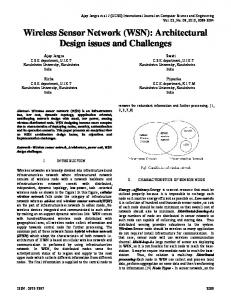
Fig. 1. Anomaly diagnosis process
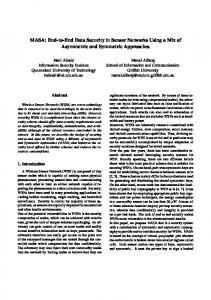
The conditions that signal an anomaly relate to user policy for a particular application. For instance, an operator sets the frequency and timeout period for data delivery by the sensor nodes. These determine thresholds for detecting and reporting anomalies to operators. Whenever data from a sensor node is not received according to the expected schedule, the operator can be notified. The frequency, urgency and level of detail within the the notification can also be user-defined. Anomaly diagnosis is established in conventional network management tools [2]; however, we revisit it here from a WSN perspective to expose how it can apply to the different types of WSN anomalies. The main goal of WSN anomaly diagnosis is mapping the symptoms to possible root causes, in order to possibly suggest remedial actions [9]. The process for characterizing a sensor network fault or anomaly is very similar to diagnosing an illness, as Figure 1 illustrates. The symptoms must first be examined, followed by a specification of the scope of the affected region. The process then involves some testing on the affected region (detection), where the operator must localize the anomaly causing node and expect some diagnostic information on the nature of the problem. This feedback yields a hypothesis on the most likely root cause of the problem. Based on the above process, we now examine how to detect common WSN anomalies, which fall into three broad categories: (1) network anomalies; (2) node anomalies; (3) data anomalies. Figure 2 illustrates the scope of each of the three anomaly types, and Table 1 summarizes the most common WSN anomalies that fall into these three categories. The remainder of this section visits each anomaly type individually.
many/all
many/all
many many/all
one one one one
Loss of connectivity
Intermittent connectivity
Routing loop
Broadcast storm
Solar charging degradation
Battery degradation
Node failures
Node resets
Temporal anomalies Spatial anomalies Spatiotemporal anomalies many
many
one
Scope
Symptom
Network Anomalies
Type
Node Anomalies
Data Anomalies
sensor value time series local/neighborhood sensor reading variation local time series and local/neighborhood comparison
lack of interaction with neighbors packet counter = 0
sustained reduction in solar current battery voltage decrease rate
packet delivery rate packet delivery rate link quality changes routing loop count, node IDs node IDs, storm duration, duplicate packet count solar current degradation rate battery current degradation rate time last heard
Diagnostic Outputs
timestamp last sequence number packet origin address duration/rate of change in local sensor values packet origin address degree of skew from neighboring nodes packet origin addresses degree of local and sensor IDs neighborhood variations
node id with stale entries in neighbor tables packet origin address
packet origin address
packet origin address
network-wide packet frequency
link endpoints path node addresses
packet origin address
high delivery rate variability tx/rx link quality origin address =forwarder address high broadcast
packet origin address
Localization Metric
packet delivery rate=0
Detection Metric
Table 1. WSN anomalies
312 R. Jurdak et al.
Wireless Sensor Network Anomalies: Diagnosis and Detection Strategies
313
Fig. 2. Scope of each anomaly type
2.1
Network Anomalies
Network anomalies are communication-related problems that arise in WSNs. Their typical symptoms are an unexpected increase or decrease in amount of packets traversing the network. Loss of Connectivity. The simplest type of network anomaly to detect is loss of connectivity. The interruption of incoming packets from two or more nodes indicates loss of connectivity with these nodes. Loss of connectivity can occur at a group of nodes, or indeed at all network nodes. Detection of connectivity losses follows a simple process: any network entity can keep track of incoming packets from other nodes. The lack of reception of packets from a group of nodes for a certain duration, defined by the timeout period set in the operator policy, signals partial or full loss of connectivity with these nodes. Alternatively, operators can set a threshold for the number of missed packets to signal loss of connectivity. The process for localizing this anomaly relies simply on extracting the node IDs of missing packets. The extraction of node IDs with missing packets can be done either at a central database or locally at a sensor node, depending on the detection architecture (see section 3.1 for more details). The anomaly’s scope helps narrow down the possible root causes behind the loss of connectivity. If a group of nodes with a common routing parent has disappeared, the likely cause of the problem is a hardware or software failure at the parent node. Alternatively, if nodes lose connectivity in different parts of the network topology, the likely cause is less evident, and could be related to link degradation issues at these nodes. Intermittent Connectivity. A related network anomaly is intermittent connectivity. Intermittent connectivity occurs when the frequency of data reception from certain nodes is highly variable relative to an operator-set link stability threshold. This anomaly also varies in scope and can cover few or all nodes. Detection of this anomaly involves setting a certain threshold on packet delivery
314
R. Jurdak et al.
rate or link quality variability. Most collection protocols in WSN’s, such as CTP [11], include unique sequence numbers for each packet, so a simple check of sequence number gaps can identify missing packets for each node in the network. The diagnostic parameter for further characterizing intermittent connectivity is the variability of connectivity, indicated by the packet delivery rate variance for affected nodes. The root cause of intermittent connectivity in most cases is highly time-variant link qualities and Received Signal Strength Indicator (RSSI) values, and it is heavily dependent on the anomaly’s scope. Intermittent connectivity at a spatially clustered group of nodes in a single region of the network indicates high noise, multi-path, or interference affecting that region. To localize intermittent link qualities at disjoint links simply requires examination of the link’s end points. The operator should be provided with a measure of how drastic a change has occurred for the link’s quality to further diagnose this anomaly. Likely causes of sudden and transient changes in link throughput include environmental changes, such as storms or fires, or movement of animals, people, or objects in the deployment area, all of which can cause sharp variations in link qualities of low power radios. If the throughput of links in different regions of the network exhibit prolonged variations, this could indicate low receiver sensitivity or high inter-node distances relative to the radio transmission range of the nodes. Routing Loops. Routing loops are yet another network anomaly whose detection is difficult at the back-end. Routing loops occur when a packet is relayed across several nodes and arrives back at the originating node. Because such packets may never make it to the base node, detecting this anomaly requires either: (1) injection of diagnostic packets by the base into the network to determine that the routing loops exist and the software problem that is causing them; (2) maintenance of the full network topology at the base node; or (3) use of source routing protocols to allow nodes to detect their own ID in the path to the destination, and to generate problem reports. Since routing loops inherently involve several nodes, all of the above methods involve large communication overhead to maintain node IDs in packets or to generate global topology information at the base, so they do not scale well with network size. Detection and resolution of routing loops within the energy constraints of WSN’s remains an open issue, even in the latest IETF Routing Over Low Power Lossy Links (ROLL) draft standard [12]. Broadcast Storms. A final type of network anomaly for WSN’s is broadcast storms, which typically affect many or all nodes in the network. Nodes that lose connectivity with their routing parents may decide to continuously broadcast packets to discover alternate paths to the base station. This behavior is due to Trickle [13] timers that drive the beacon period in collection protocols. Trickle timers are used for maintaining consistent state within WSN’s. As long as there are no changes to the local state, a node doubles its Trickle timer, effectively doubling the beaconing period. However, when a node detects a change in its local state, it resets its Trickle timer to the lowest possible value (commonly
Wireless Sensor Network Anomalies: Diagnosis and Detection Strategies
315
in the range of milliseconds). When multiple nodes simultaneously follow this behavior, the local channel becomes heavily congested. To make things worse, neighboring nodes may forward broadcast packets to nodes further away, which causes heavy congestion and eventually saturation on the wireless channel in the wider network. Fortunately, detecting broadcast storms is relatively simple: if a certain number of duplicate broadcast packets arrive from more than one node, then a broadcast storm has started. Network operators can set thresholds on the number of packet duplicates that indicate a broadcast storm, the minimum number of nodes involved, and the frequency of running this query. The anomaly detection system should provide operators with a list of nodes involved in the storm, the number of packet duplicates, and the duration of this storm. A common root cause of broadcast storms is loss of routing connectivity, which causes nodes to probe neighbors in hope of regaining connectivity. 2.2
Node Anomalies
Node level anomalies are rooted at hardware or software problems at a single node and are not related to communications with neighboring nodes. Because they arise in single nodes, distributed detection of node anomalies can be highly effective. A common node-level symptom is when a node stops transmitting data. The most likely cause of this node anomaly is the failure/degradation of solar panels, which leads to on-board power drops. Solar Panel Issues. There are four main possibilities for solar panel failures: (1) not enough sunlight during the day, (2) blocked solar panel, (3) shifted solar panel, and (4) solar panel degradation. During cloudy or rainy days, the solar charging current of several nodes is affected instead of just one. This exemplifies multiple node anomalies arising simultaneously, and it can be detected by observing the drop in solar current of the multiple nodes. This is in contrast to a network-related problem at the same group of nodes, which would exhibit connectivity losses that are not correlated to solar current changes. Based on our deployment experience in many long term environmental monitoring sensor networks in forests, lakes, farms, and deserts around Australia [21], we have observed numerous unexpected obstructions to solar panels in the field. Blocked solar panels involve cases such as bird droppings, cob webs, or fallen leaves on the solar panel. Moving animals in the deployment region or strong winds can also shift solar panels away from the favourable direction for maximum solar harvesting. Both shifted or blocked solar panels result in dramatic and sustained drops in solar current. Finally, long term degradation of the panel can also cause node power drops. This anomaly requires long term observation of solar current trends to detect decreases in solar output over time. Battery Issues. Another cause for power drops is battery failure or depletion. There are two possibilities when a battery does not provide enough power: (1) insufficient battery charging, and (2) hardware failure of the battery. Insufficient
316
R. Jurdak et al.
battery charging can be diagnosed, locally or centrally, through examination of the solar current of the previous day, potentially combined with relevant weather data for indicating cloud cover during that period. Battery failure can be diagnosed when a node fails to send data during the night. If a node that has enough harvested solar energy to remain active all night ceases to send data before sunrise, then it is highly likely that the node’s battery has reached the limit for its recharge cycles and needs replacement. Node Failure. The node memory, CPU, or radio may also enter a locked state or fail during a deployment. This situation may arise due to poor or defective hardware components, or poor software integration of the components. Detecting this anomaly is challenging, as the problem with a specific component may not exhibit any detectable symptoms by neighbors or at the base node. In this case, only proactive checking of node integrity can detect the problem’s existence. Node anomalies that cause the node to stop operating are more easily detectable. If a node stops interacting with any other node for a pre-specified period of time, the node is deemed to have failed. In beaconing based routing protocols, this entails the examination of neighboring nodes’ routing state tables and identifying any stale entries. Each node must compare the stale entries in its own table with stale entries of neighboring nodes, so that a consensus can be reached on the node’s failure. Any remote designation of a node failure remains speculative without a global cross-check of neighbor table entries. Mobility of nodes complicates the detection of node failures, since the lack of packets from a node may indicate that it has moved away rather than failed. Node Resets. The final node anomaly we examine is node resets. The operator can set a grenade timer to reset the node periodically for operational reasons, which causes the node’s packet counter to reset to zero at the same interval. Alternatively, the packet counter may be unexpectedly reset by the node. Since user-specified resets are predictable and periodic, they can be ignored as anomalies. All other resets are classified as node anomalies that indicate a software bug and potential race conditions in the code. Note that malicious entities may attempt to gain control of sensor nodes and alter their operation. This is an increasingly viable possibility with the advent of the 6LoWPan standard, which implements IPv6 on sensor nodes. Detecting such security attacks remains an open issue as the malicious entity may be able to emulate normal operation of the node. If the attack specifically alters data readings, this may be detectable by statistical methods, which are discussed in the next section. 2.3
Data Anomalies
Data anomaly detection depends on statistical irregularities in the data. These irregularities may be caused by miscalibrated or faulty sensor hardware or environmental variations. Sensor hardware problems are data anomalies rather than
Wireless Sensor Network Anomalies: Diagnosis and Detection Strategies
317
node anomalies because they manifest themselves in erroneous data values rather than the failure or degraded performance of the node. Faulty sensors typically report extreme or unrealistic values that are easily distinguishable. In contrast, environmental variation causes sensor data values to change rapidly, but the sensor readings remain within reasonable ranges. Furthermore, one can distinguish data anomalies by spatial or temporal comparison from several sensors since it is unlikely that many sensors will exhibit a calibration skew or failure at the same time. Security breaches can also lead to anomalous data values from sensor nodes. There are three broad categories of data anomalies: temporal anomaly at a single node location due to changes in data values over time; spatial anomaly at a single node location due to comparison with neighboring nodes; and spatiotemporal anomaly detected through a number of node location due to changes in data value over time and space. Temporal Anomalies. Temporal anomalies exhibit one of several symptoms: high variability in subsequent sensor readings; lack of change in sensor readings; gradual reading skews; and out-of-bound readings. High variability in subsequent sensor readings at the same node could signify major changes or events in the sensed environment, or they could arise from sensor voltage fluctuations. In some instances, sensor samples may remain the same over long periods of time, which may indicate a locked state or that the sensor has failed to obtain new samples. Gradual yet sustained skews in sensor readings could indicate a need for sensor recalibration. Finally, out-of-bound readings represent sensor values that are physically not possible, which points towards a major malfunction of the sensor. Detection of temporal data anomalies can take place locally at each node, which requires the node to store historical data, or at a central point. For a detailed review of temporal data anomaly detection methods, see [3]. Spatial Anomalies. Spatial data anomalies can be detected by comparing the values with the surrounding sensors. For example, if the measurement for air temperature on one node differs from measurements of all the surrounding nodes, then it is highly likely that the data is spatially anomalous, and is due to a calibration error in the sensor. This applies to some types of data, such as temperature and humidity, which typically have low spatial variation, but not to data such as audio and video, which differ dramatically at neighboring nodes, depending on the angle and location of signal capture. Spatiotemporal Anomalies. Spatiotemporal data anomalies combine both spatial and temporal variations, inherently involving more than one node. For example, changes of chemical content in a waterway [14] represent a spatiotemporal anomaly. This will affect nodes along the waterway at different times. Diagnosing this anomaly should account for data throughout the network over a certain period of time. Temporal anomalies can be detected locally at each node, while spatial and spatiotemporal anomalies require more involved internode interaction to establish the existence of the anomaly.
318
2.4
R. Jurdak et al.
Other Anomalies
Anomalies that do not fit any of the above types are classified as other anomalies. These can be related to back-end software issues, which may cause loss of data or connectivity, without the anomaly residing within the sensor network. Another class of node software-related anomalies may not be explicitly detectable since it does not degrade performance in the short term but causes logical errors in the long-term, for instance due to timer rollovers. Addressing these types of anomalies is currently done offline, by disconnecting the network, fixing the problem, then reactivating the network. Online solutions for these anomalies remain an active research area.
3
Anomaly Detection Strategies
Having examined the main anomaly types in the previous section, we now focus on the strategies for WSN anomaly detection and their design choices. Table 2 shows a set of current representative approaches to anomaly detection. We now briefly survey these approaches to extract the relevant design features and strategies for anomaly detection. Current approaches vary in their level of development, with some available as fully functional tools and others that are algorithmic. The available tools typically adopt a centralized approach, where a process at the back-end monitors incoming traffic for detecting anomalies. For example, Sympathy [6] is a tool for anomaly detection and debugging in sensor networks. It embeds networkrelated metrics in packets from all nodes. The sink node observes packets and hypothesizes on the presence and locale of anomalies. Another tool that also uses back-end processing of data appears in [9]. This tool relies on rules at node and data level, such as whether the node is broken or has a bad sensors. It maps these rules to possible root causes of anomalies and provides potential remedial actions to fix the anomaly. Octopus [15] is a sensor network monitoring and visualization tool that provides live topology and link state information on the nodes and enables users to issue simple preset commands to the nodes. Table 2. Existing Tools Strategy Octopus [15] Momento [5] Sympathy [6] Wang et al. [16] Rajasegarar et al. [17] Walchli and Braud [7] Ramanathan et al. [9] Chen et al. [10] Krishnamachari and Iyengar [8] Chang et al. [18] Obst [19,20]
Concept topology/state variance-based metrics collection Bayesian cluster-based prototypes rules-based majority voting Bayesian
Status tool modules tool algorithm algorithm algorithm tool algorithm algorithm
Recurrent NN Recurrent NN
algorithm algorithm
Type Architecture Usability Network centralized visualization Network distributed target FP rate Network centralized specify epoch Data centralized n/a Data hybrid n/a Data hybrid n/a Data/Node centralized n/a Data/Node distributed unattended Data distributed n/a Data Data
centralized distributed
n/a n/a
Wireless Sensor Network Anomalies: Diagnosis and Detection Strategies
319
A separate class of approaches distributes the anomaly detection logic at the nodes. In contrast with tools, these approaches are algorithmic in nature. Momento [5] is a network health monitoring system for sensor networks that relies on a variance-based detector. Its main concept is that the presence of significant changes in node states can indicate the presence of anomalies. It relies on node collaboration on the basis of periodic heartbeats in order to detect deviations from expected behavior. Rajasegarar et al. [17] devise a cluster-based algorithm for detection of data anomalies. Their algorithm distributes the computation of the detection algorithm over all nodes for scalability. However, decisions on whether anomalies have occurred are left for the central sink node, where the results of computations from all nodes converge. A similar computation model is proposed in [7], where sensor nodes classify incoming signals according to learned prototypes, prior to sending the classification to a fusion center for system-wide access patterns. Distributing the decision process even further, Krishnamachari and Iyengar [8] propose two Bayesian algorithms that run on each node to distinguish between node/data faults and unusual events in the environment. A similar distributed approach that relies on majority voting in a local neighborhood to establish likely ground truths data measurements is proposed in [10]. Decentralized approaches based on recurrent neural networks are presented in [19], which uses only local communication with a few neighbor nodes, and learn a model of sensor values dependent on time series data from their neighbors. It uses online learning by gradually acquiring an improved model of sensors over time. This brief survey of the existing anomaly detection approaches highlights a set of relevant design choices, including: architecture and target anomaly types. The remainder of section visits these design choices, in addition to examining the usability features of the existing strategies. The degree of distribution has, at least indirectly, ramifications for the usability of the approach. For instance, centralized anomaly detection approaches are easier to handle for a centralized user interface, whereas decentralized approaches can signal faults more easily and more quickly at the local node, using e.g. status LEDs. Anomaly Detection
database
t=26
26 27
25
33
24 25
24
26
Sensor nodes 24
t=25
t=25 t=33
Anomaly detected locally
t=26
t=24
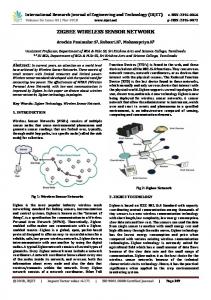
(a) Centralized anomaly de- (b) Distributed anomaly detection tection Fig. 3. Architectural choices for anomaly detection
320
3.1
R. Jurdak et al.
Architecture
Architecture of an anomaly detection strategy refers to the design of the procedure that actually checks for anomalous behavior in the network. There are three options for the architecture of an anomaly detection strategy: (1) centralized; (2) distributed; or (3) hybrid. Centralized. Figure 3(a) illustrates a simple example of centralized anomaly detection. In this example, each node samples its temperature sensor periodically and sends the temperature data in a packet over its radio towards the central base node, which has a connection to a back-end database. The number on each node represents its current temperature reading. The node in bold reports an anomalous temperature reading which differs significantly relative to all its neighboring nodes. In this centralized approach, detection of this anomalous data reading occurs at a process that monitors the back-end database where all the data converges. This process then localizes the anomaly through the sender ID of the anomalous data packet (in this case node 33), and proceeds to diagnose the anomaly to determine possible root causes, which include miscalibrated sensors or interesting yet highly localized environmental events. In general, centralized anomaly detection (such as [6,9,16]) relies on analysis of information that converges at the base station or back-end database, as in the example above. Detecting anomalies at the central sensor node itself has the advantage of containing the anomaly detection logic within the network. This avoids any additional interaction between the base station and the backend system. However, this approach restricts the complexity of queries that can run to detect anomalies, given the limited processing power and storage space at the base station relative to full blown PCs. For instance, most sensor nodes currently have 8- or 16-bit micro-controllers, with typical clock speeds of 16Mhz, 8-10KB of RAM, and up to 1MB of external flash. Storing diagnostic and data packets from tens of nodes over several days can cause the external flash to fill up quickly at the base node. In addition, running multiple queries at this node while forwarding all node packets to the back-end can strain the micro-controller. Recent work towards sensor nodes with 32-bit processors and more RAM may alleviate these issues to some extent. Alternatively, central anomaly detection can use information at the back-end database, as in Figure 3(a). This design enables far more powerful queries for detecting more involved anomalies, as the database resides on a PC-class machine with relatively high memory and processing resources. Composite queries that examine data packet arrivals over several hours or days become possible. For example, to detect a broadcast storm requires a check of the following: – A node has attempted to deliver a broadcast data packet, which can result in network flooding – Multiple retransmissions of this packet have occurred (same sequence number and originator ID), due to lost or delayed acknowledgements – This behavior is replicated at multiple nodes
Wireless Sensor Network Anomalies: Diagnosis and Detection Strategies
321
The set of queries required to identify these conditions can easily run every few minutes at the database. The same task is not possible at the base station node, mainly because of processing limitations. Distributed. In distributed anomaly detection [8,10,19], it is up to the sensor nodes themselves to monitor their respective conditions and detect anomalous behavior by themselves or their neighbors. Distributed anomaly detection trades off the resources of centralized detection for quicker and more localized detection. It also exploits spatial correlation of environmental events to distinguish unusual (anomalous) events from faults. Figure 3(b) illustrates the use of spatial data for distributed anomaly detection. As in the example above, all nodes sample their temperature sensors and send their data periodically. Nodes can snoop on their neighbors’ packets and compare them with their own temperature reading. The node in the middle of Figure 3(b) has a local temperature reading of 33o C, while all its neighbors have readings between 24-26oC. As a result, the node in the middle can detect its anomalous data and possibly diagnose this anomaly locally. Hybrid. Hybrid anomaly detection strategies [5,7,17] try to combine the best of both worlds: the availability of network state information at the back-end of the centralized approach and the responsiveness and low communication overhead of the distributed approach. A hybrid approach uses a centralized strategy for anomalies whose detection metric can be readily examined at the database, such as connectivity anomalies, broadcast storms, and node resets, and complex data anomalies. For any anomaly that can be detected locally at nodes, such as routing loops, link quality changes, variations in solar or battery currents, and threshold-based data anomalies, hybrid approaches place the detection and localization responsibility on the nodes themselves. 3.2
Usability
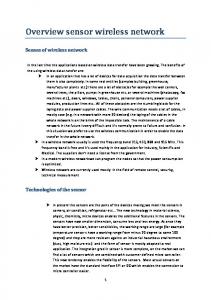
The usability of a WSN anomaly detection refers to the interaction with human users. Figure 4 provides an overview of user interaction with WSN anomaly detection. Regardless of the detection architecture, an anomaly is reported to a notifier/scheduler process at the base station. This process schedules and sends alerts to users through a service provider network (cellular or Internet) in the form of SMS, email, or web notifications. As explained in the following section, the communication strategy between individual nodes may depend on the way notifications are triggered. A further aspect of usability is the feedback the user provides to the notifier/scheduler process to change how, when, and how often anomaly notifications are sent. Notifications. We mentioned above the ramifications of the architecture for a user-friendly design of the system. Stand-alone applications are useful for providing an overview of the system status or to report problems on demand. Normally,
322
R. Jurdak et al.
User
Service provider network
Base station
WSN database
SMS feedback
SMS alert Email/ Web alert
Anomaly Detection Notifier/ Scheduler
Email/Web feedback
Fig. 4. User interaction with WSN anomaly detection
however, users will want to be automatically notified of exceptional events, and otherwise assume the WSN is working as expected. Thus, the two main methods of remotely notifying users are either by email or by Short Message Service (SMS) on mobile telephones. Specific widgets or applications for smart phones can represent an interesting compromise between the two. Dependent on the architecture of the anomaly detection approach, sending notifications to users in real time has an impact on the communication strategy of the system. In a centralized architecture, the relevant information is readily available at the base station. In this case, no additional communication between individual nodes is required to notify users. On the other hand, distributed architectures may be able to detect anomalies locally. However, local detection requires nodes to report events to the base station. An alternative design choice is to report events only when queried by the network operator for on-demand operation. The notification modality is highly related to the length of the message and the speed at which users receive it. SMS notifications are limited to 160 characters, which limits them to short high level descriptions of the anomaly. In contrast, an email notification can be as long as necessary, thus is able to include detailed information about the anomaly, for instance, specific node IDs and diagnosis details. The tradeoff is that people tend to carry their mobile phones all the time, so SMS alerts provide a more timely mode of notification. A final modality for user notification is through a secure website, where interactive maps can provide richer context information for anomalies. Scheduling. Scheduling involves deciding when and how often to send notifications. This aspect is important because users need to know about faults in the network, however, if a problem persists when it is not fixed straight away, constant notifications of the same problem will eventually cause human operators
Wireless Sensor Network Anomalies: Diagnosis and Detection Strategies
323
to ignore the messages. The simplest solution is to keep a flag or timer in the diagnostic logic to track if and when a message has been sent to a user about a particular anomaly, and to suppress further notifications. Alternatively, the user should be able to configure a set of parameters that indicate how long and how often he/she should receive alerts after an anomaly appears. Another issue of scheduling is how urgently to send notifications. In other words, if a fault was detected in the network, when should the users be notified? The answer is user-specific, and depends on whether they would want instant notification or after a problem has persisted for a while. Related to this is the scheduling of the diagnostic tool, i.e how often should it check for anomalies in the network? In general, the tool should run at a time interval in the same order as the nodes’ data reporting periods. In distributed implementations that run on resource-limited nodes, anomaly check frequency can be reduced accordingly. User Feedback. The last aspect of usability is user feedback, which involves changing various user-specified parameters, temporary suspension of alerts, and adding new features to notifications. User feedback should be received and processed automatically through emails, SMS or the web interface, allowing for scalability and responsiveness. The simplest user feedback is the “out of office” reply sent by most email programs when a user is away. During that time, a user might not wish to receive notifications of anomalies in the network. Therefore, the diagnostic tool should stop sending notifications until the user sends another email to resume the notifications. A related feature is for a user to simply send an email or SMS to start/stop receiving notifications. Other feedback mechanisms to the system is changing the various user specified parameters, such as notification scheduling, alert types, and deployments of interest. In centralized strategies, user feedback simply feeds into the back-end system and adjusts its configuration. In distributed or hybrid architectures, user feedback must propagate to the nodes to alter their frequency of detection or their thresholds for various anomalies. While user feedback can still use the same modalities (email, SMS, web), the back-end can then relay the new settings to individual nodes through Tiny RPC messages. Individual nodes can then respond to such RPC requests by adjusting their local configuration accordingly.
4
Design Guidelines and Conclusions
This section summarizes the guidelines for design of anomaly detection strategies, on the basis of the discussion in previous sections. The first set of guidelines relates to architectural choices for anomaly types. For network anomalies, centralized detection is useful when diagnostic network data can be piggybacked in packets, providing the centralized anomaly detector with a comprehensive view of network state. More complex network anomalies, such as routing loops, are best detected with distributed or hybrid detection, where nodes can snoop on packets that they forward to detect a loop,
324
R. Jurdak et al.
or link quality changes, where a node is in the best position to determine the quality of its own links. For node anomalies, centralized, hybrid and distributed approaches are all suitable for detection and localization using the source node id. However, finding the root cause of the node anomaly is more challenging in centralized detection, as the strategy can only hypothesize on the cause on the basis of the data at the back-end. A distributed approach provides more responsive node anomaly detection. For data anomalies, centralized detection is slow relative to distributed detection, which can rely on threshold, spatial, or temporal comparisons run locally at each node. For computationally challenging anomalies, a hybrid approach that locally detects problems then triggers more involved analysis centrally is most suitable. Usability is another major factor in promoting uptake of WSN anomaly detection tools. Thus, usable tools should provide several modes of notification, including email, SMS, and html, and tailor notification formats to each mode’s constraints. Tools should also enable users to flexibly schedule notifications by deciding when, how often, and how urgently notifications are received. Alongside the scheduling feature, several modes of user feedback should be supported to maintain user control of the type and frequency of notifications they receive. This set of guidelines will hopefully serve as an enabler for further research into the design of more effective and comprehensive anomaly detection strategies.
Acronyms WSN Wireless Sensor Networks SMS Short Message Service tx transmit rx receive CTP Collection Tree Protocol RSSI Received Signal Strength Indicator ROLL Routing over Low Power Lossy Links CPU Central Processing Unit 6LoWPAN IPv6 Compression for low power networks FP False Positive LED Light Emitting Diode RPC Remote Procedure Call
References 1. Akyildiz, I.F., Su, W., Sankarasubramaniam, Y., Cayirci, E.: Wireless sensor networks: a survey. Computer Networks 38(4), 393–422 (2002) 2. Subramanian, M.: Network Management: An Introduction to Principles and Practice. Addison-Wesley Longman Publishing Co., Inc., Boston (1999) 3. Rajasegarar, S., Leckie, C., Palaniswami, M.: Anomaly detection in wireless sensor networks. Wireless Communications, 34–40 (August 2008)
Wireless Sensor Network Anomalies: Diagnosis and Detection Strategies
325
4. Prokopenko, M., Wang, P., Foreman, M., Valencia, P., Price, D.C., Poulton, G.T.: On connectivity of reconfigurable impact networks in ageless aerospace vehicles. Journal of Robotics and Autonomous Systems 53(1), 36–58 (2005) 5. Rost, S., Balakrishnan, H.: Memento: A Health Monitoring System for Wireless Sensor Networks. In: SECON 2006, Reston, VA, pp. 575–584 (September 2006) 6. Ramanathan, N., Chang, K., Kapur, R., Girod, L., Kohler, E., Estrin, D.: Sympathy for the sensor network debugger. In: SenSys 2005, pp. 255–267. ACM Press, New York (2005) 7. W¨ alchli, M., Braun, T.: Efficient signal processing and anomaly detection in wireless sensor networks. In: Giacobini, M., Brabazon, A., Cagnoni, S., Di Caro, G.A., Ek´ art, A., Esparcia-Alc´ azar, A.I., Farooq, M., Fink, A., Machado, P. (eds.) EvoWorkshops 2009. LNCS, vol. 5484, pp. 81–86. Springer, Heidelberg (2009) 8. Krishnamachari, B., Iyengar, S.: Distributed Bayesian algorithms for fault-tolerant event region detection in wireless sensor networks. IEEE T. on Computers 53, 241– 250 (2004) 9. Ramanathan, N., Balzano, L., et al.: Rapid deployment with confidence: Calibration and fault detection in environmental sensor networks. UCLA CENS, Tech. Rep. (January 2006) 10. Chen, J., Kher, S., Somani, A.: Distributed fault detection of wireless sensor networks. In: DIWANS 2006, pp. 65–72. ACM, New York (2006) 11. Gnawali, O., Fonseca, R., Jamieson, K., Moss, D., Levis, P.: The collection tree protocol. In: Sensys, pp. 1–14. ACM, New York (2009) 12. Thubert, P.: Draft ietf roll standard (February 2010), http://tools.ietf.org/ wg/roll/draft-ietf-roll-of0/ 13. Levis, P., Patel, N., Culler, D., Shenker, S.: Trickle: a self-regulating algorithm for code propagation and maintenance in wireless sensor networks. In: NSDI 2004: Proceedings of the 1st conference on Symposium on Networked Systems Design and Implementation, pp. 2–2. USENIX Association, Berkeley (2004) 14. Dunbabin, M., Udy, J., Grinham, A., Bruenig, M.: Continuous monitoring of reservoir water quality: The wivenhoe project. Journal of the Australian Water Association 36, 74–77 (2009) 15. Jurdak, R., Ruzzelli, A., Baribirato, A., Boivineau, S.: Octopus: monitoring, visualization, and control of sensor networks. Wireless Communication and Mobile Computing, 1–21 (2009) 16. Wang, X.R., Lizier, J.T., Obst, O., Prokopenko, M., Wang, P.: Spatiotemporal anomaly detection in gas monitoring sensor networks. In: Verdone, R. (ed.) EWSN 2008. LNCS, vol. 4913, pp. 90–105. Springer, Heidelberg (2008) 17. Rajasegarar, S., Leckie, C., Palaniswami, M., Bezdek, J.C.: Distributed anomaly detection in wireless sensor networks. In: ICCS 2006, pp. 1–5 (October 2006) 18. Chang, M., Terzis, A., Bonnet, P.: Mote-based online anomaly detection using echo state networks. Distributed Computing in Sensor Systems, 72–86 (2009) 19. Obst, O.: Construction and training of a recurrent neural network. Australian Provisional Patent Application 2009902733 (June 2009) 20. Obst, O.: Distributed backpropagation-decorrelation learning. In: NIPS Workshop: Large-Scale Machine Learning: Parallelism and Massive Datasets (2009) 21. Corke, P., Wark, T., Jurdak, R., Hu, W., Valencia, P., Moore, D.: Environmental Wireless Sensor Networks. Proceedings of the IEEE 98(11), 1903–1917 (2010)