Workload Characterization of Bioinformatics Applications Yue Li
Tao Li
Tamer Kahveci
José Fortes
Department of ECE University of Florida
[email protected]
Department of ECE University of Florida
[email protected]
Department of CISE University of Florida
[email protected]
Department of ECE University of Florida
[email protected]
Abstract The exponential growth in the amount of genomic information has spurred growing interest in large scale analysis of genetic data. Bioinformatics applications represent the increasingly important workloads. However, very few results on the behavior of these applications running on the state-of-the-art microprocessor and systems have been published. This paper proposes a suite of widely used bioinformatics applications and studies the execution characteristics of these benchmarks on a representative architecture – the Intel Pentium 4. To understand the impacts and implications of bioinformatics workloads on the microprocessor designs, we contrast the characteristics of bioinformatics workloads and the widely used SPEC 2000 integer benchmarks. The proposed bioinformatics benchmark suite as well as the input datasets can be downloaded from the following website: http://www.ideal.ece.ufl.edu/BioInfoMark.
1. Introduction Over the past few decades, advances in biology research have revolutionized our understanding of the basis of life. As genomics moves forward, having accessible computational methods with which to extract, view, and analyze genomic information, becomes essential. Bioinformatics allows researchers to sift through the massive biological data (e.g., nucleic acid and protein sequences, structures, functions, pathways and interactions) and identify information of interest. Bioinformatics is becoming increasingly important due to the interest of the pharmaceutical industry and biotechnology companies. A number of recent market research reports estimate the size of the bioinformatics market is projected to grow to $243 billion by 2010 [1]. Despite the widespread usage of bioinformatics applications, very few results on the execution characteristics of these applications have been published. It is therefore important to understand how the representative workloads from this emerging application domain behave on the stateof-the-art microprocessors and systems. Such studies can provide insights to computer architects on (1) how suitable current designs are for bioinformatics software, and (2) what optimizations will further improve the performance. This study characterizes the workload behavior of 17 widely used bioinformatics tools. We use hardware performance counters to measure various architectural characteristics of a Pentium 4 based machine running the
collected bioinformatics workloads. We chose Pentium 4 architecture due to its state-of-the-art design and popularity. Since bioinformatics benchmarks are not well-known from the architecture perspective, we believe that an in-depth analysis of a wide variety of bioinformatics software on the representative architecture is crucial in understanding the implications of bioinformatics tools on today’s market. We study the basic workload characteristics and examine the efficiencies of trace cache, out-of-order execution, caches and TLBs, branch prediction and speculative execution. To better understand the impacts and implications of bioinformatics workloads on microprocessor designs, we further contrast the characteristics of bioinformatics workloads and the widely used SPEC 2000 integer benchmarks. To date, most published work related to bioinformatics applications either uses single program [2][3] or focuses on the high level, parallel programming issues [4][5]. Compared with the former work, our study is much wider in scope and our analysis is specifically oriented towards microprocessor and memory performance. Compared with a recent study reported in [6], our (independent) work covers much more (17 vs. 7) bioinformatics tools and includes applications in protein structure analysis and molecular dynamics simulation. Moreover, our study is based on the more advanced Pentium 4 microarchitecture whereas in [6] Pentium 3 is used as the reference machine. Compared with previous studies, the set of statistics collected in this work is more comprehensive and fine-grained. The contributions of this paper include:
• Development of a benchmark suite that could be used to evaluate computer architecture performance on emerging bioinformatics applications • Detailed workload characterization of widely used bioinformatics tools on a representative architecture – the Intel Pentium 4 The rest of the paper is organized as follows. Section 2 provides an introductory biology background and a brief review of bioinformatics study areas. Section 3 describes the benchmark applications. Section 4 describes the experimental setup. Section 5 presents detailed characterization of the benchmarks and their architectural implications. Section 6 summarizes the major findings of this work.
2. Background This section provides an introductory background for biology and illustrates the major fields of bioinformatics.
2.1 Introduction: DNA, Gene and Proteins One of the fundamental principles of biology is that within each cell, DNA that comprises the genes encodes RNA which in turn produces the proteins that regulate all of the biological processes within the organism. DNA is a double chain of simpler molecules called nucleotides. The nucleotides are distinguished by a nitrogen base that can be of four kinds: adenine (A), cytosine (C), guanine (G) and thymine (T). A DNA can be specified uniquely by listing its sequence of nucleotides, or base pairs. Proteins are the molecules that accomplish most of the functions of a living cell, determining its shape and structure. A protein is a linear sequence of molecules called amino acids. Twenty different amino acids are commonly found in proteins. Similar to DNA, proteins are conveniently represented as a string of letters expressing its sequence of amino acids.
2.2 Biological Problems In this section, we illustrate the major problems in bioinformatics, including sequence analysis, phylogeny, protein structure analysis/prediction and molecular dynamics. (1) Sequence Analysis: Sequence analysis is perhaps the most commonly performed task in bioinformatics. Sequence analysis can be defined as the problem of finding similar and dissimilar parts of sequences (nucleotide or amino acid sequences). Comparison of sequences is crucial in understanding of their significance and functionality: high sequence similarity usually implies significant functional or structural similarity while sequence differences hold the key information of diversity and evolution. The most commonly used sequence analysis technique is pairwise sequence comparison. Multiple sequence alignment compares more than two sequences. (2) Phylogeny: Phylogeny infers lines of ancestry of genes or organisms. Phylogeny analysis provides crucial understanding about the origins of life and the homology of various species. Phylogenetic trees are composed of nodes and branches. Each leaf node corresponds to a gene or an organism. Internal nodes represent inferred ancestors. The evolutionary distance between two genes or organisms is computed as a function of the length of the branches between their nodes and their common ancestors. (3) Protein Structure Analysis: Once a protein is produced, it folds into a three-dimensional shape. Three-dimensional structures of only a small subset of proteins are known because expensive wet-lab experimentation is needed. Computationally determining the structure of proteins is an important problem as it accelerates the experimentation step and reduces expert analysis. Usually, the relationship among chemical components of proteins (i.e. their amino acid sequences) is used in determining their unique threedimensional native structures. (4) Molecular Dynamics: Molecular dynamics allows studying the dynamics of large macromolecules, including biological systems. Dynamic events play a key role in controlling processes which affect functional properties of
biomolecules. Drug design is commonly used in the pharmaceutical industry to test properties of a molecule at the computer without the need to synthesize it (which is far more expensive).
3. The Selected Bioinformatics Applications To characterize the architectural aspects of bioinformatics tools, various sets of applications are collected. Of the many bioinformatics applications, we currently select a subset of 17 workloads based on their popularity, availability, and how representative they are in general. This section describes the selected programs, which can be classified using the categories we introduced in Section 2.2.
3.1 Sequence Analysis Benchmarks The Blast (Basic Local Alignment Search Tool) programs [7] are a set of heuristic methods that are used to search sequence databases for local alignments to a query sequence. Blast is one of the most commonly used sequence comparison program. Over a hundred thousand queries are submitted to NCBI’s Blast server daily. Similar to Blast, Fasta [8] is a collection of local similarity search programs for sequence databases. While Fasta and Blast both do pairwise local alignment, their underlying algorithms are different. Clustal W [9] is a widely used multiple sequence alignment program for nucleotides or amino acids. It first finds a phylogenetic tree for the underlying sequences. It then progressively aligns them one by one based on their ancestral relationship. Hmmer [10] employs hidden Markov models (profile HMMs) for aligning multiple sequences. Profile HMMs are statistical models of multiple sequence alignments. Glimmer (Gene Locator and Interpolated Markov Modeler) [11] finds genes in microbial DNA. It uses interpolated Markov models (IMMs) to identify coding and noncoding regions in the DNA. Emboss (European Molecular Biology Open Software Suite) [12] is a software package which contains a wide variety of programs ranging from sequence alignment, protein motif identification to domain analysis, and codon usage analysis.
3.2 Phylogeny Analysis Benchmarks Phylip (PHYLogeny Inference Package) [13] is a widely used package of programs for inferring phylogenies (evolutionary trees). Methods that are available in the package include parsimony, distance matrix, maximum likelihood, bootstrapping, and consensus trees. Data types that can be handled include molecular sequences, gene frequencies, restriction sites and fragments, distance matrices, and discrete characters.
3.3 Protein Structure Analysis Benchmarks Dali [14] finds the structural neighbors of a protein by comparing it against the proteins in the PDB [15]. CE (Combinatorial Extension) [16] finds structural similarities between the primary structures of pairs of proteins. CE first aligns small fragments from two proteins. Later, these fragments are combined and extended to find larger similar substructures. Predator [17] predicts the secondary structure of a protein sequence or a set of sequences based on their
amino acid sequences. Threader [18] predicts protein fold. It uses a database of unique protein folds. The new protein is then threaded to existing proteins in the database.
3.4 Molecular Dynamics Simulation Benchmarks Gamess (General Atomic and Molecular Electronic Structure System) [19] is a general ab initio quantum chemistry package. Gamess can compute SCF wave functions and a variety of molecular properties. Amber (Assisted Model Building with Energy Refinement) [20] is a package of
programs that has been widely used for molecular dynamics simulations of proteins and nucleic acids. Table 1 summarizes the selected bioinformatics workloads and their inputs we used in our experiments. The inputs were chosen from the realistic and highly popular biological datasets, such as the NCBI nr [21] and bacteria genomes databases, EMBL [22], PDB [15], and SWISS-PROT [23] databases. Overall, these input datasets contain several GB biological data.
Table 1. Benchmark Description Software Package
Program
Description
Input Dataset
homo sapiens hereditary haemochromatosis protein, nr (primary databases from NCBI) compare a protein/DNA sequence to a protein/DNA human LDL receptor precursor protein, Fasta fasta34 NCBI nr database database 317 Ureaplasma’s gene sequences from Clustal W clustalw progressively align multiple sequences the NCBI Bacteria genomes database a profile HMM built from the alignment of Hmmer hmmsearch align multiple proteins using profile HMMs 50 globin sequences, uniprot_sprot.dat from SWISS-PROT find genes in microbial DNA, especially the 18 bacteria complete genomes from the Glimmer glimmer2 genomes of bacteria and archaea NCBI genomes database diffseq find differences between nearly identical sequences nucleic acid database EMBL Emboss megamerger merge two large overlapping nucleic acid sequences nucleic acid database EMBL Blast
blastpgp
shuffleseq dnapenny Phylip
search the query protein in a protein database
shuffle a set of sequences maintaining composition find all most parsimonious phylogenies for nucleic acid sequences
promlk
estimate phylogenies from amino acid sequences using maximum likelihood
Dali
dalilite
find structurally similar proteins to a query protein
CE
ce
align C∝ atoms of pairs of proteins
Predator
predator
predict protein secondary structure from a single sequence or a set of sequences
nucleic acid database EMBL ribosomal RNAs from bacteria and mitochondria protein amino acid sequences of 17 species ranging from a deep branching bacterium to humans 5 representatives from 5 superfamilies in Protein Data Bank 10 representatives from 31 superfamilies in Protein Data Bank 100 Eukaryote protein sequences from NCBI genomes database a yeast (Candida albicans) POL protein fragment, threader database
Threader threader
predict protein fold
Gamess
gamess
program for ab initio molecular quantum chemistry 37 test examples with Gamess distribution
sander
simulate and minimize molecular dynamics
ptraj
analyze trajectories
Amber
in vacuo model of a standard decamer poly(A)–poly(T) duplex DNA structure 7mer peptide in a box of periodic water (1577 Waters)
# Retired Instructions (Billions) 78 610 852 681 371 35 35 315 264 936 1465 326 711 208 158 1963 17
4. Experimental Setup
4.1 Machine Configuration
This section describes our experimental infrastructure, including the configuration of our machine, the microarchitecture features of the Pentium 4 processor and the methodology for collecting and analyzing hardware counter data.
All experiments were run on a 2.4GHz Pentium 4 processor [24] with 1GB main memory running Red Hat Linux 9.0 kernel version 2.4.26. The Pentium 4 architecture was chosen due to its advanced features and high popularity in today’s bioinformatics computing market. Table 2
Table 2. Microarchitectural Characteristics of Pentium 4 Processor In Order Front-End ITLB Front-End BTB Instruction Decoder Trace Cache Trace Cache BTB µop Queue Bandwidth Pipeline Length
128 entries, fully associative 4K entries 1 x IA-32 inst. / cycle 12K µops1, 8-way, 6 µops / line 2K entries 3 µops / cycle 31 hybrid predictor chooses between bimodal, local history, and global history 16 entries
Branch Prediction Return Address Stack
Out-of-order Execution Engine ROB Load Buffer Store Buffer Write Combining Buffer Dispatch Bandwidth Retirement Bandwidth
126 entries 48 entries 24 entries 8 entries 6 µops / cycle 3 µops / cycle
Execution Units Integer Register Files FP Register File AGU Integer ALU FP ALU L1 Data Cache DTLB
128 128 1 Load + 1 store 2 Fast + 1 Complex 1 Move + 1 MMX-SSE 16KB, 8-way, 64 Byte/line, writethrough, dual-ported, non-blocking (4), 2/6 cycles (Int./FP) 64 entries, fully associative
Memory Subsystem L2 Cache System Bus
1MB, 8-way, 128 Byte/line, writeback, non-blocking, 7/7 cycles (Int./FP) , 108GB/s quad pumped 6.4GB/s
4.2 Performance Counters We used hardware performance counters to measure architectural events [25]. The Pentium 4 performance counting hardware includes 18 hardware counters that can count 18 different events simultaneously in parallel with pipeline execution. The 18 Counter Configuration Control Registers (CCCRs), each associated with a unique counter, configure the counters for specific counting schemes such as event filtering and interrupt generation. The 45 Event Selection Control Registers (ESCRs) specify the hardware events to be counted and some additional Model Specific Registers (MSRs) for special mechanisms like replay tagging. These counters collect various statistics including the number 1
In order to improve the efficiency of the superscalar execution and the parallelism of the program, each x86 instruction is translated into one or more µops inside the Pentium 4 processor.
and type of retired instructions, mispredicted branches, cache misses etc. We used a total of 59 event types for the data presented in this paper. The benchmarks have been compiled using the Intel C/C++ and FORTRAN compilers for Linux, using generic Pentium 4 optimization options [26].All bioinformatics benchmarks are executed to completion. To contrast the execution characteristics of bioinformatics workloads and the well known benchmark suite, we run all SPEC 2000 integer benchmarks [27] with their reference input datasets. Due to the space limitation, we only present the average statistics of the SPEC benchmarks. For some architecture characteristics, we also show the best and the worst scenarios in the SPEC integer suite.
5. Experimental Results This section presents a detailed characterization of the Pentium 4 processor running the collected bioinformatics applications. We examine basic workload characteristics, trace cache, TLBs and memory system behavior, and superscalar execution.
5.1 Basic Characteristics Table 1 shows that the total number of instructions executed on the studied bioinformatics programs ranges from tens of billions to thousands of billions. This indicates that the computational requirement to process the realistic biological data is non-trivial. The using of performance counters (instead of simulation) in this study allows us to examine the characteristics of entire program execution. % of Dynamic Instructions bl as tp fa g p st c a h m lus 3 4 m ta l s w g l e arc im h m m d er 2 eg iff a m se s h er q uf ge d n fl es r a p eq en p r ny om d a lk li l it e pr c ed e th a to re r a ga de m r e s a ss nd e pt r ra j Bi S p o _A ec VG _A VG
summarizes the Pentium 4 processor microarchitectural characteristics.
100%
80% 60% 40% 20%
0%
Load
Store
Branch
FP
Integer
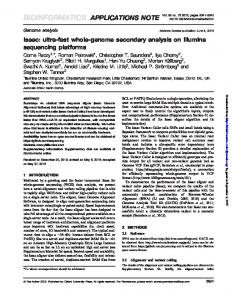
Figure 1. Dynamic Instruction Profile Figure 1 illustrates the dynamic instruction profile. As can be seen, sequence alignment and molecular phylogeny analysis programs contain high percentage loads in their instruction streams. Sequence alignment programs (e.g., blastpgp, fasta34 and hmmsearch) walk through large-scale databases and query sequences many times to find similar sequences. For example, for a given query, blastpgp sequentially slides a window on the database sequences. This results in many load instructions. Phylogeny analysis tools (i.e., dnapenny and promlk) iteratively read sequences from multiple species to build phylogenetic trees. The percentage of loads is significantly more than that of stores in all programs. Sequence analysis programs, which typically employ dynamic programming (DP) algorithms, have to read multiple entries from the DP matrix to update a single entry.
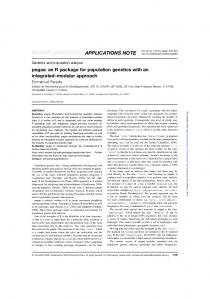
cache misses. Blastpgp uses longer seeds than fasta34. Therefore, seeds of blastpgp are more likely to yield high quality matches. This improves the branch prediction accuracy of blastpgp over fasta34. The IPCs are remarkably low on benchmarks diffseq, megamerger and shuffleseq due to their excessive L2 data cache misses. Benchmark gamess shows lower IPC due to instruction cache misses and the long latency floating point operations. Figure 2 shows that the greatest IPC (clustalw) that the processor can yield on bioinformatics applications is higher than that on the SPEC benchmarks (gap). The observed lowest IPC (diffseq) is still better than the worst case (mcf) of SPEC benchmarks. Overall, compared to SPEC benchmarks, bioinformatics applications show slightly better IPC and µPC. 2.0
1.0 0.5
as t fa p g p st c a h m lu s 3 4 m ta lw s g l ear im ch m m d i e r2 e g ffs a e sh m e q u f r ge d n fle s r ap eq e p r n ny om d a lk l il ite pr ed ce th ato re r g a a de m r sa e ss nd e pt r ra j Bi o _ Sp A ec V G Sp _A e V S p c_ g G ec ap _m cf
0.0
Figure 2. IPC and µPC
5.3 Trace Cache As the front end, the trace cache sends up to 3 µops per cycle directly to the out-of-order execution engine, without the need for them to pass through the decoding logic. Only if there is a trace cache miss, the front end fetches x86 instructions from the L2 cache. Additionally, for the long x86 instructions, the processor fetches µops from a special µops ROM that stores the canned µops sequence.
5.2 IPC and µPC
L2 Cache
Trace Cache
µops ROM
100% 80% 60% 40% 20% 0% bl as tp fa gp st c a hm lus 34 m tal se w gl arc im h m m d er2 eg iff am se sh er q uf g e dn fl es r ap eq en pr ny om da lk li l it e pr c ed e th ato re r a ga de m r e sa ss nd e pt r ra j B io Sp _A ec VG _A VG
% of µops
Using the events that count the number of cycles, number of instructions retired and number of µops retired, we computed the IPC and µops per cycle (µPC) of bioinformatics workloads. As shown in Figure 2, the highest IPC values come from multiple sequence alignment program clustalw and phylogeny analysis application dnapenny. The lowest IPCs values are programs that manage biological sequences (i.e. diffseq, megamerger and shuffleseq). The IPCs range from 0.15 to 0.93, with an average around 0.55. The µPCs range from 0.25 to 1.5, with an average around 0.82. Only four benchmarks (clustalw, dnapenny, ce, and threader) achieve more than one µops per cycle. A lower IPC can be caused by an increase in cache misses, branch mispredictions, or stalls due to the long latency instructions in the pipeline. For example, blastpgp, fasta34 and hmmsearch all perform sequence similarity search in databases. Hmmsearch yields the highest IPC due to the best branch prediction and cache performance. Benchmark blastpgp yields lower IPC than fasta34 due to its higher L1 data cache miss rate, although blastpgp has better branch prediction accuracy. This can be explained as follows. Both blastpgp and fasta34 first find exact matches (seeds) of a certain length. They later stitch and extend these matches to find longer matches. Blastpgp uses the entire seed set whereas fasta34 only uses the most promising set of seeds. As a result of this blastpgp usually maintains and inspects a larger set of candidates than fasta34 which results in larger amount of
Instruction per Cycle µops per Cycle
1.5
bl
Sequence management programs (e.g., diffseq, meagmerger and shffleseq) modify biological sequences more frequently than other programs, resulting in high percentage stores in their instruction mix. Compared with SPEC benchmarks, bioinformatics workloads contain higher percentage of loads (45% vs. 37%). The store instruction mixes (15% vs. 16%) of both benchmark suites are very similar. Bioinformatics applications show large variation in branch instruction mix. For example, on benchmark sander, branches which are used to form coarsegrained loops to perform iterative molecular dynamics simulation, account for less than 4% of total dynamic instructions. On the other hand, the gene prediction program glimmer2 heavily uses branches to distinguish and interpret the gene code segments from a large amount of possible nucleotides combinations, resulting in 26% branches in its instruction stream. On the average, compared with SPEC benchmarks, bioinformatics applications show a slightly lower branch frequency (15% vs. 19%). Bioinformatics workloads use floating point operations non-uniformly: molecular dynamic simulation programs, such as sander, ptraj and gamess perform many floating point operations, while sequence comparison tools, such as blastpgp, fasta34, clustalw and hmmsearch perform none. Protein structure comparison tools ce and dalilite perform floating point operations since they involve comparison of sequences of three dimensional coordinates represented with real numbers. Promlk uses floating point operations since it computes the substitution rates between sequences.
Figure 3. Source of the µops Figure 3 shows the proportion of µops fetched from the L2 cache, the trace cache, and the µops ROM respectively. As can be seen, a dominant fraction (97%) of µops is supplied by the trace cache. Overall, the µops ROM only contributes 3% of µops and the L2 cache contributes less than 1% of the total µops. On SPEC benchmarks, the L2 cache can supply up to 11% µops (eon). Overall, the L2 cache contributes 4% of µops on the SPEC benchmarks. This implies that compared to SPEC programs, bioinformatics applications exhibit better
trace cache performance. On both benchmark suites, the µops ROM contributes 3% of executed µops.
databases containing Giga bytes of biological sequences, their active working sets are usually small. The benchmarks (meamerger and diffseq) with the highest L1 data cache misses also have the highest L2 misses. Due to the irregular memory access patterns and poor locality, data accesses on these two benchmarks are difficult to absorb, even for the 1MB, 8-way set associative L2 cache with prefetching. Figure 2 and Figure 4 show a fairly strong correlation between the L2 misses and IPCs, indicates that the L2 miss latency is more difficult to be completely overlapped by out-of-order execution. Overall, bioinformatics applications show better L2 cache performance than SPEC benchmarks.
5.4 Cache Misses
228 73 Trace Cache Misses per Thousand Instructions L1-D Cache Misses per Thousand Instructions L2 Cache Load Misses per Thousand Instructions
60 50 40 30 20 10
pr c ed e th ato re r a ga der m e sa ss nd er pt ra j B io Sp _A ec VG Sp _AV ec G Sp _e ec on _m cf
bl a
st p fa gp st cl a3 hm us 4 m talw se gl ar im ch dn me ap r2 en pr ny om m d lk e g iff am se q sh er uf ge fle r s da eq lil it e
0
Figure 4. Cache Misses per thousand Instructions
5.5 TLB Misses
50%
8% ITLB
6%
DTLB
4% 2% 0% as t fa p g p st c a h m lu s 3 4 m ta l s w gl e a r im c h m m di er 2 e g ffs am eq sh er uf g e dn f les r ap e q en pr n y om da lk lil it e pr c ed e th a to re r ga a de m r e s a ss nd e pt r ra j Bi S p o_ A e c VG S p _A e VG S p c _e ec o n _m cf
TLB M iss R ates
The processor uses separate TLBs (Translation Lookaside Buffers) to handle translations from virtual addresses to physical addresses on instruction and data accesses. Pentium 4 has a 128-entry, fully-associative instruction TLB (ITLB) and a 64-entry, fully associative data TLB (DTLB).
bl
Figure 4 presents the counts of cache misses per 1000 instructions retired. We see that instruction cache misses are nearly fully satisfied by the trace cache. As can be seen, the average trace cache miss rate of SPEC benchmarks is higher than that of bioinformatics applications. Data cache miss rates are higher because of two main reasons. First, they process large-scale biological data, resulting in data footprints which are much larger than the instruction footprints. Second, they need to maintain very large data structures to analyze bioinformatics data. On the average, bioinformatics applications generate 14 L1 cache misses per thousand retired instructions. The L1-D cache miss rates on diffseq, megamerger and shufflesque are significantly higher than other programs. One reason for excessive amount of data cache misses is that these programs work on very large sequences. In our experiments, both diffseq and megamerger work on two large input sequences: the Homo sapiens chromosome 6p21.3, which contains 100,000 base pairs and the Homo sapiens MSH55 gene, which contains 184,666 base pairs. Diffseq and megamerger are based on similar principles. They find short matches between two sequences. They then use these matches to find differences between the sequences or to merge the sequences into a single sequence. Since the input sequences to these benchmarks are nearly identical, they produce many short matches resulting in large internal data structures. Shuffleseq uses the Mus musculus chromosomes with 366 base pairs as its input. It takes an input sequence and produces multiple shuffled versions of that sequence. It maintains and traverses multiple linked lists at run-time to store the input sequences and the shuffled sequences. Due to the poor locality, the generated memory access patterns can not fit into the L1 data cache. The L1 D-cache miss rates on diffseq and megamerger are higher than that on shuffleseq due to the larger input datasets used by these two programs. Figure 4 shows that in the worst case (mcf), SPEC benchmarks yield a cache miss rate four times higher than the worst case of bioinformatics workloads. On the average, the L1 D-cache miss rate on SPEC benchmarks is 3 times higher than that on bioinformatics workloads. We found that the L1 data cache misses on 14 out of the 17 bioinformatics applications can be nearly fully satisfied by the L2 cache. The Pentium 4 processors use automatic hardware prefetch to bring cache lines into the unified L2 cache based on prior reference patterns. Prefetching is beneficial because many accesses to the biological sequence databases are sequential, and thus, predictable. For example, both bastpgp and fasta34 build a hash table on one sequence and sequentially scan the other sequence once to find initial matches. Clusalw sequentially scans one sequence once and scans the other sequence multiple times to find pairwise alignments. With prefetching, the L2 cache can handle the working sets of most of the studied benchmarks. This indicates that although these bioinformatics tools search
Figure 5. TLB Miss Rates Figure 5 presents the ITLB and DTLB miss rates. As can be seen, the ITLB miss rates are well below 1.0% on most benchmarks. DTLB accesses on most benchmarks can also be handled very well. Nevertheless, benchmarks diffseq and meagmerger yield high (7%) DTLB miss rates due to their poor data locality. We further classify the DTLB misses on loads and stores and find that the DTLB miss rates on loads are usually higher than those on store operations. Figure 5 also present the best (eon) and the worst (mcf) cases of DTLB miss rates on SPEC benchmarks. As can be seen, compared with SPEC benchmarks, bioinformatics applications show better DTLB performance.
5.6 Branches and Branch Prediction Figure 6 presents the fraction of branches that belong to conditional branches, indirect branches, calls and returns. Conditional branches, ranging from 49% (glimmer2) to 99% (dnapenny) of the dynamic branches, dominate control flow transfers in bioinformatics applications. Indirect branches account for more than 10% of the dynamic branches on benchmarks glimmer2, diffseq, meagmerger and shuffleseq. Benchmark glimmer2 heavily uses case-switch statements (which are translated into indirect branches by the compiler) to map the encoded DNA/protein sequences to known gene segments. 80% 60% 40% 20% as tp fa g p st a h m c lus 3 4 m ta l se w g l arc im h m m d er 2 eg iff a m se s h er q uf ge d n fl es r a p eq en p r ny om d a lk li l it e pr c ed e th a to re r a ga de m r e s a ss nd e pt r ra j Bi S p o _A ec VG _A VG
0%
bl
Conditional Branches
Indirect Branches
Call
Return
Figure 6. Dynamic Branch Mix The three applications from EMBOSS suite all contain high percentage of indirect branches. A closer investigation reveals that these indirect branches come from the shared libraries. The entire EMBOSS suite contains more than 150 programs. To facilitate modular design and code reuse, the EMBOSS applications heavily use the utilities built in its core software libraries (i.e. AJAX and NUCLEUS) to handle the common scenarios, such as the pre-processing of sequences. The code reuse results in the similar control flow transfer instruction profile between applications. We believe that the amount of indirect branches is not inherent in the underlying algorithms. They are rather caused by the implementation. On the average, conditional branches, indirect branches, call, and return contribute to 82%, 8%, 5% and 5% of total
Overall
Conditional Branches
Indirect Branches
Call
Bi o_ AV Sp G ec _ Sp AV ec G Sp _tw ol ec f _v or te x
aj pt r
ce pr ed at or th re ad e ga r m es s sa nd er
st pg p fa st a3 4 cl us hm tal w m se ar ch gl im m er 2 di f m fs eg e am q er ge sh r uf fle s eq dn ap en ny pr om lk da lil ite
20% 15% 10% 5% 0%
bl a
Misprediction Rates
% of Branches
100%
dynamic branch execution. Compared with the SPEC benchmarks, bioinformatics tools show higher ratio of conditional branches (82% vs. 72%) in their control flow transfer instructions. This is mainly because the underlying bioinformatics problems involve exploring a large state space incrementally where each state depends on a number of other states. For example, sequence comparison algorithms (e.g., blastpgp, fasta34, hmmsearch, and dnapenny) start with an initial alignment and gradually grow this alignment by making local decisions to whether insert a new letter or delete or modify an existing letter. On the other hand, the SPEC benchmarks show higher frequencies of indirect branches, calls and returns in the branch instruction profile. Figure 7 shows the branch misprediction rates. Despite the advanced branch prediction schemes, the overall branch misprediction rates exceed 10% on 4 out of the 17 benchmarks. Benchmarks glimmer2 and dnapenny also yield high indirect branch misprediction rates. Indirect branches affect the overall branch prediction on benchmark glimmer2, where indirect branches constitute 26% of total executed branches. Calls and returns can be predicted accurately by the 16 entries return address stack. The overall branch prediction performance largely depends on the accuracy of conditional branch prediction. Sequence analysis workloads (e.g., blastpgp, fasta34, and hmmsearch) yield high misprediction rates on conditional branches. These tools typically compare many combinations at each step to find a good alignment. Usually only one of these combinations yields the desired solution. Their algorithms use dynamic programming as an efficient recursive method to score all possible alignments according to the PAM or BLOSUM scoring matrices [7]. The control flow transfers on these programs highly depend on the contents of input sequences and the specified scoring matrices, making accurate branch prediction difficult. Figure 7 shows that bioinformatics tools can yield branch misprediction rates higher than the worst case (twolf) in SPEC benchmarks. Overall, bioinformatics applications show slightly higher misprediction rate than SPEC benchmarks.
Return
Figure 7. Branch Misprediction Rates
6. Conclusions Although bioinformatics applications represent a rapidly growing computing market, workload characteristics of the representative applications from this application domain are still largely unknown. This paper proposes a bioinformatics benchmark suite and examines the execution characteristics
of popular bioinformatics tools used for sequence alignments, phylogeny analysis, protein fold prediction, structure comparison and molecular dynamics. The major observations from our study are: (1) Memory reference instructions account for more than 60% of dynamic instructions. The frequency of memory accesses in bioinformatics workloads is higher than that in SPEC 2000
integer benchmarks. (2) Bioinformatics applications typically have small instruction footprints which can fit into the instruction cache. As a result, the trace cache spends high percentage of time in the trace deliver mode. (3) Compared with the SPEC benchmarks, bioinformatics workloads yield a better IPC rate. Nevertheless, tools which manage large and complex biological sequences show very poor IPC due to the excessive L2 cache misses. (4) Although bioinformatics tools search large-scale databases to find useful information, the active working sets of these workloads are small. As a result, prefetching and L2 cache can efficiently handle the working sets of the 14 out of 17 studied workloads. Compared with the SPEC benchmarks, bioinformatics workloads show better performance in terms of data cache and TLB miss rates. (5) Bioinformatics applications show large variation in dynamic branch instruction frequency and mix. Programs such as gene prediction tools heavily use case-switch statements to map the encoded DNA/protein sequences to known gene segments, resulting in high indirect branch mix. Despite the highly advanced branch prediction schemes, branch misprediction rates exceed 10% on the majority of sequence analysis workloads. We believe that the study in this paper will help in understanding the bottlenecks of bioinformatics software from an architectural point of view. For example, sequence analysis tools suffer from excessive amount of mispredicted conditional branches. This implies that the performance of these applications can be improved by avoiding such branches. One source of such conditional branches is the recursive calls of the dynamic programming computation commonly used in sequence analysis tools. The size of the problem space for dynamic programming can usually be reduced by precomputing relationships among data, and clustering and indexing of the database [28]. Indexing and clustering methods enable pruning of large portions of the database without going through complex comparison methods. In future work, we will explore integrated software/hardware techniques to optimize the performance of bioinformatics applications. We will also characterize the proposed bioinformatics workloads on different architectures. The proposed bioinformatics benchmark suite as well as the input datasets can be downloaded from the following website: http://www.ideal.ece.ufl.edu/BioInfoMark.
References
5.
T. K. Yap, O. Frieder and R. L. Martino, Parallel Computation in Biological Sequence Analysis, IEEE Transactions on Parallel and Distributed Systems, vol. 9, no. 3, page 283-294, 1998.
6.
K. Albayraktaroglu et al., BioBench: A Benchmark Suite of Bioinformatics Applications, International Symposium on Performance Analysis of Software and Systems, 2005.
7.
S. Altschul, W. Gish, W. Miller, E. W. Meyers and D. J. Lipman, Basic Local Alignment Search Tool, Journal of Molecular Biology, vol. 215, no. 3, pages 403-410, 1990.
8.
D. J. Lipman and W. R. Pearson, Rapid and Sensitive Protein Similarity Searches, Science, vol. 227, no. 4693, pages 1435-1441, 1985.
9.
J. D. Thompson et al., Clustal W: Improving the Sensitivity of Progressive Multiple Sequence Alignment through Sequence Weighting, Positions-specific Gap Penalties and Weight Matrix Choice, Nucleic Acids Research, vol. 22, no. 22, pages 4673-4680, 1994.
10. S. R. Eddy, Profile Hidden Markov Models, Bioinformatics Review, vol. 14, no. 9, page 755-763, 1998. 11. S. Salzberg, A. Delcher, S. Kasif, and O. White, Microbial Gene Identification using Interpolated Markov Models, Nucleic Acids Research, vol. 26, no. 2, page 544-548, 1998. 12. P. Rice, I. Longden, and A. Bleasby, EMBOSS: The European Molecular Biology Open Software Suite, Trends in Genetics, vol. 16, no 6, page 276-277, 2000. 13. J. Felsenstein, PHYLIP - Phylogeny Inference Package (version 3.2), Cladistics, 5: 164-166, 1989. 14. L. Holm and J. Park, DaliLite Workbench for Protein Structure, Bioinformatics Applications Note, vol. 16, no.6, pages 566- 567, 2000. 15. The RCSB Protein Data Bank, http://www.rcsb.org/pdb/ 16. I. N. Shindyalov, and P. E. Bourne, Protein Structure Alignment by Incremental Combinatorial Extension (CE) of the Optimal Path, Protein Engineering, vol. 11, no. 99, page 739-747, 1998. 17. D. Frishman, and P. Argos, 75% Accuracy in Protein Secondary Structure Prediction, Proteins, vol. 27, page 329-335, 1997. 18. D. T. Jones, W. R. Taylor, and J. M. Thornton, A New Approach to Protein Fold Recognition, Nature, vol. 358, page 86-89, 1992. 19. M. W. Schmidt et al., General Atomic and Molecular Electronic Structure System, Journal of Comput. Chem., vol. 14, page 13471363, 1993. 20. The Amber Molecular Dynamics Package, http://amber.scripps.edu/ 21. http://www.ncbi.nlm.nih.gov/Genbank/ 22. European Molecular heidelberg.de
Biology
Laboratory,
http://www.embl-
23. The UniProt/Swiss-Prot Database, http://www.ebi.ac.uk/swissprot/
1.
Bioinformation Market Study for Washington Technology Center, Alta Biomedical Group LLC, www.altabiomedical.com, June 2003.
24. G. Hinton, D. Sager, M. Upton, D. Boggs, D. Carmean, A. Kyker, and P. Roussel, The Microarchitecture of the Pentium 4 Processor, Intel Technology Journal, 1st quarter 2001.
2.
A. Das, J. Lu, H. Chen, J. Kim, P. Yew, W. Hsu and D. Chen, Performance of Runtime Optimization on BLAST, International Symposium on Code Generation and Optimization, 2005.
25. B. Sprunt, The Basics of Performance Monitoring Hardware, IEEE Micro, July-August, page 64-71, 2002.
3.
R. Radhakrishnan et al., Performance Characterization of BLAST on Intel Xeon and Itanium2 Processors, in proceedings of the IEEE 7th Annual Workshop on Workload Characterization, 2004.
4.
M. Taufer et al., Performance Characterization of a Molecular Dynamics Code on PC Clusters, Is there any Easy Parallelism in CHARMM?, International Parallel and Distributed Processing Symposium, 2002.
26. Intel Pentium 4 Processor Optimization, Reference Manual, Intel Corporation, 2001. 27. SPEC CPU 2000 Benchmarks, http://www.spec.org/osg/cpu2000/ 28. T. Kahveci and Ambuj K. Singh, Optimizing Similarity Search for Arbitrary Length Time Series Queries, IEEE Transactions on Knowledge and Data Engineering, vol. 16, no. 4, page 418-433, 2004.