WSRec: A Collaborative Filtering Based Web Service Recommender System. Zibin Zheng, Hao Ma, Michael R. Lyu, and Irwin King. Department of Computer ...
2009 IEEE International Conference on Web Services
WSRec: A Collaborative Filtering Based Web Service Recommender System Zibin Zheng, Hao Ma, Michael R. Lyu, and Irwin King Department of Computer Science and Engineering The Chinese University of Hong Kong Shatin, N.T., Hong Kong, China {zbzheng, hma, lyu, king}@cse.cuhk.edu.hk Abstract
Web services fit the functional and non-functional requirements [16, 17, 21]. However, evaluation from the service user’s perspective has the following drawbacks: 1) Firstly, it requires service invocations and imposes costs for the service users. At the same time, it consumes resources of the service providers. 2) Secondly, there may be too many service candidates to be evaluated and some suitable Web services may not be discovered by the service users. 3) Finally, most of the service users are not experts on the Web service evaluation, and the common time-to-market constraints limits an in-depth evaluation of the target Web services. To overcome the drawbacks described above, we propose WSRec, which employs an effective and novel hybrid collaborative filtering algorithm, for Web service selection and recommendation. Collaborative filtering methods can automatically predict the QoS performance of a Web service for an active user by employing historical QoS information from other similar service users, who have similar historical QoS experience on the same set of commonly-invoked Web services. By our hybrid collaborative filtering method, we can predict the QoS performance of Web services for active service users without requiring the service users to conduct Web service evaluation and to find out a list of service candidates themselves. There are several challenges to be addressed when applying collaborative filtering methods to the Web service recommendation: 1) How to collect the QoS information of Web services from different service users? 2) How to refine the traditional collaborative filtering methods to suit for Web service recommendation? 3) How to verify the recommendation results? In traditional movie recommendation research, there are open datasets, such as the MovieLens1 and the Netfix2 , that can be employed for studying the recommendation results. However, in the filed of service computing, large service selection datasets are difficult to obtain, making verification of the Web service recommendation results a big challenge.
As the abundance of Web services on the World Wide Web increase, designing effective approaches for Web service selection and recommendation has become more and more important. In this paper, we present WSRec, a Web service recommender system, to attack this crucial problem. WSRec includes a user-contribution mechanism for Web service QoS information collection and an effective and novel hybrid collaborative filtering algorithm for Web service QoS value prediction. WSRec is implemented by Java language and deployed to the real-world environment. To study the prediction performance, A total of 21,197 public Web services are obtained from the Internet and a largescale real-world experiment is conducted, where more than 1.5 millions test results are collected from 150 service users in different countries on 100 publicly available Web services located all over the world. The comprehensive experimental analysis shows that WSRec achieves better prediction accuracy than other approaches.
1. Introduction Web services are loosely-coupled software systems designed to support interoperable machine-to-machine interaction over a network. The increasing presence and adoption of Web services call for effective approaches for Web service selection and recommendation, which is a key issue in the field of service computing [18]. In the presence of multiple Web services with identical or similar functionalities, Quality of Service (QoS) provides non-functional Web service characteristics for the optimal Web service selection. Since the service providers may not deliver the QoS it declared, and some QoS properties (e.g., network latency, invocation failure-rate, etc.) are highly related to the locations and network conditions of the service users, Web service evaluation by the service users can obtain more accurate results on whether the demanded 978-0-7695-3709-2/09 $25.00 © 2009 IEEE DOI 10.1109/ICWS.2009.30
1 http://www.cs.umn.edu/Research/GroupLens/. 2 http://www.netflix.com/
437
WSRec
This paper aims at advancing the current state-of-the-art in Web service recommendation by addressing the above challenges. The contribution of this paper is three-fold: 1) Firstly, we propose a systematic user-contribution mechanism for collecting QoS information of Web services. 2) Then we design an effective and novel hybrid collaborative filtering algorithm for Web service recommendation, which significantly improves the recommendation quality comparing with other well-known traditional collaborative filtering methods . 3) Finally, we conduct a large-scale real-world experimental analysis for verifying our recommendation algorithm. To the best of our knowledge, the scale of our experiment is the largest among the published work for Web service recommendation. In this paper, a total of 21,197 public Web services are obtained from the Internet, where 100 Web services are randomly selected and invoked by 150 service users in more than 20 countries. We have conducted over 1.5 million Web service invocations with detailed experimental results. The rest of this paper is organized as follows. Section 2 introduces the WSRec architecture. Section 3 proposes our hybrid collaborative filtering algorithm. Section 4 shows the system implementation, experiments and results. Section 5 presents related work and Section 6 concludes the paper.
Input Handler
Distributed Computers
W
Find Similar Users Service User
UDDI Registry
Test Case Genrator
Training Data
Predict Missing Data
Test Result Handler
Recomm ender
e b S e r v ic e M o n it o r M a n a g e r
Web Services Web Service 1 Web Service 2 Web Service n
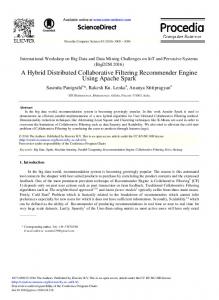
Figure 1. Architecture of the WSRec the above set-up, we are able to obtain sufficient Web service QoS information for recommendation in our WSRec system. Figure 1 shows the system architecture of WSRec, which includes the following procedures: 1) An active service user provides the individually obtained Web service QoS information to the WSRec; 2) The Input Handler in the WSRec processes the input data; 3) The Find Similar Users finds similar users from the training data of WSRec; 4) The Predict Missing Data predicts the missing QoS values for the active user using our hybrid collaborative filtering algorithm and saves the predicted values; 5) The Recommender employs the predicted QoS values to recommend optimal Web services to the active user.
2. System Architecture In the movie recommendation research, an underlying assumption is that the movie ratings issued by different users can be obtained from a commercial or experimental Web system like Amazon and MovieLens. However, in the field of service computing, it is difficult to obtain Web service QoS information observed by different service users due to: 1) Web services are distributed over the Internet and are owned by different organizations; 2) service users are usually isolated from each other; and 3) the current Web service architecture does not provide any mechanism for the Web service QoS information sharing. However, obtaining sufficient Web service QoS information from different service users is crucial for making accurate Web service recommendations. To attack this challenge, we introduce the key concept of Web 2.0, user-contribution, for the Web service QoS information collecting. The idea is that by contributing the individually observed Web service QoS information to WSRec, the service users can obtain accurate Web service recommendation service. Apart from the usercontribution mechanism, WSRec also controls a number of distributed computers for monitoring the publicly available Web services. In this paper, we use the Planet-lab [4], which is a distributed test-bed made up of about 1,000 computers distributed all over the world, for monitoring the real-world Web services and collecting their QoS performance. With
3. Recommendation Algorithm 3.1. Similarity Computation Given a recommender system consisting of M service users and N Web service items, the relationship between service users and Web service items is denoted by an M ×N matrix, called the user-item matrix. Every entry in this matrix rm,n represents the a vector of QoS values (e.g., response-time, failure-rate, etc.), that is observed by the service user m on the Web service item n. If user m did not invoke the Web service item n before, then rm,n = 0. Pearson Correlation Coefficient (PCC) was introduced in a number of recommender systems for similarity computation, since it can be easily implemented and can achieve high accuracy. In user-based collaborative filtering for Web services, PCC is employed to define the similarity between two service users a and u based on the Web service items they commonly employed using the following equation: � (ra,i − ra )(ru,i − ru ) i∈I
Sim(a, u) = �� i∈I
438
(ra,i − ra )2
�� i∈I
, (1) (ru,i − ru )2
where I = Ia ∩ Iu is the subset of Web service items which user a and user u commonly invoked, ra,i is the vector of QoS values of Web service item i observed by service user a, and ra represents the vector of average QoS values of the service user a. From this definition, the service user similarity, Sim(a, u), is in the interval of [-1,1] with a larger value indicating that users a and u are more similar. Item-based collaborative filtering methods using PCC, such as [5, 13], are similar to the user-based methods. The difference is that item-based methods employ the similarity between the Web service items instead of the service users. The similarity computation of two items i and j can be described as: � (ru,i − ri )(ru,j − rj ) u∈U
Sim(i, j) = � �
(ru,i − ri )2
u∈U
��
bors selection is a very important step for making accurate recommendation, since dissimilar neighbors will lead to inaccurate missing value prediction for the active user. In practice, some users have limited similar users or even do not have any similar users. Traditional Top-K algorithms ignore this problem and still choose the top k most similar neighbors to predict the missing value. This will greatly influence prediction accuracy. In this paper, a similar neighbor will be removed from the set of the TopK similar neighbors if its similarity is equal to or smaller than 0. To predict a missing value ru,i in the item-user matrix, a set of similar users S(u) can be found by the following equation: S(u) = {ua |ua ∈ T (u), Sim� (ua , u) > 0, ua �= u}, (5) and a set of similar items S(i) of the Web service item i can be found by the following equation:
, (2) (ru,j − rj )2
u∈U
S(i) = {ik |ik ∈ T (i), Sim� (ik , i) > 0, ik �= i},
where U = Ui ∩Uj is the subset of service users who invoke both Web service item i and Web service item j, and ri represents the vector of average QoS values of the Web service item i observed by different service users. Sim(i, j) is also ranging from [−1, 1]. PCC often overestimates the similarities of service users who are actually not similar but happen to have similar QoS experience on a few co-invoked Web services [11]. To address this problem, we employ a similarity weight to reduce the influence of a small number of similar co-invoked items. An enhanced PCC for the similarity computation of different users is defined as: 2 × |Ia ∩ Iu | Sim(a, u), Sim (a, u) = |Ia | + |Iu | �
where T (u) is a set of the TopK similar users to the user u, T (i) is a set of the TopK similar items to the item i.
3.3. Missing Value Prediction User-based collaborative filtering methods use similar users to predict the missing value (QoS values) for the active users by employing the following equation: � Sim� (ua , u)(rua ,i − ua ) P (ru,i ) = u +
2 × |Ui ∩ Uj | Sim(i, j), |Ui | + |Uj |
ua ∈S(u)
(3)
�
,
Sim� (ua , u)
(7)
ua ∈S(u)
where |Ia ∩ Iu | is the number of Web service items that are employed by both the two users, and |Ia | and |Iu | are the number of Web services employed by user a and user u, respectively. When |Ia ∩ Iu | is small, the similarity weight 2×|Ia ∩Iu | |Ia |+|Iu | will devalue the similarity estimation between the service users. Just like the user-based methods, an enhanced PCC for the similarity computation of different Web service items is defined as: Sim� (i, j) =
(6)
where u is the vector of average QoS values different Web services observed by the active user u, and ua is the vector of average QoS value of different Web services observed by the similar service user ua . Item-based collaborative filtering methods use similar Web service items to predict the missing value by employing the following equation: � Sim� (ik , i)(ru,ik − ik ) P (ru,i ) = i +
(4)
ik ∈S(i)
�
Sim� (ik , i)
.
(8)
ik ∈S(i)
where |Ui ∩ Uj | is the number of service users who invoke both Web service item i and item j. The experimental results in Section 4.4 show that the similarity weight can enhance the QoS value prediction accuracy of Web services.
However, due to the sparsity of the user-item matrix, predicting missing value only using user-based methods or item-based methods will potentially ignore valuable information that will make the prediction more accurate. In order to predict the missing value as accurate as possible, we propose a hybrid collaborative filtering algorithm, which systematically combines user-based and item-based methods to fully utilize the information of the user-item matrix. When
3.2. Similar Neighbors Selection After calculating the similarities between different users, a set of similar neighbors can be identified. Similar neigh439
where ra (UMEAN) is the vector of average QoS values of different Web services observed by the service user a and ri (IMEAN) is the vector of average QoS values of Web service item i invoked by different service users. In this case, the confidence of the predicted value is con = 0, indicating that we have no confidence on the predicted values. By the above design, the confidence weights (conu and coni ) determine how much our hybrid method relies on the user-based prediction and the item-based prediction automatically. The parameter λ enhances the feasibility of our hybrid method to different environments. These mechanisms are different from all other existing prediction methods and the experimental results in Section 4 show that this new approach can significantly enhance the QoS value prediction accuracy for Web services.
a missing value does not have similar users, we use the information of similar items to predict the missing value, and vice versa. When S(u) �= ∅ ∧ S(i) �= ∅, we employ both the user-based and item-based methods to predict the missing QoS values. Since these two predicted values may have different prediction accuracy, we employ two confidence weights, conu and coni , to balance these two predicted values. conu is defined as: conu =
�
Sim� (ua , u) × Sim� (ua , u), � (u , u) Sim a ua ∈S(u)
�
ua ∈S(u)
(9) and coni is defined as: coni =
�
�
ik ∈S(i)
Sim� (ik , i) × Sim� (ik , i), (10) � ik ∈S(i) Sim (ik , i)
3.4. Web Service Recommendation
where a higher value indicates a higher accuracy of the predicted value P (ru,i ). Since different datasets may have their own data distribution natures, a parameter λ (0 ≤ λ ≤ 1) is employed to determine how our QoS value prediction relies on the user-based method or the item-based method. When S(u) �= ∅ ∧ S(i) �= ∅, our hybrid collaborative filtering method predicts the missing QoS value ru,i by employing the following equation: � � Sim (ua , u)(rua ,i − ua )
P (ru,i ) = wu × (u +
ua ∈S(u)
�
Sim� (ua , u)
)+
ua ∈S(u)
�
wi × (i +
Sim� (ik , i)(ru,ik − ik )
ik ∈S(i)
�
Sim� (ik , i)
), (11)
The predicted QoS values can be employed for the Web service recommendation and selection by the following ways: 1) For functionally equivalent Web services, the one with best predicted QoS performance can be recommended to the active user. 2) WSRec can recommend the top k bestperforming Web services, which may not have equivalent functionality, to the service users to help them discover the potential Web services. 3) WSRec can also recommend the top k active service users, who have good predicted QoS values on a certain Web service, to the service provider to help the provider find its potential customers. Different from all other existing prediction methods, WSRec not only provides the predicted QoS values for the active users, but also provides the confidences (con) of the predicted values, which can be employed by the service users for better Web service selection.
ik ∈S(i)
where wu + wi = 1, wu = coni ×(1−λ) conu ×λ+coni ×(1−λ) .
conu ×λ conu ×λ+coni ×(1−λ)
4. Implementation and Experiments
and wi =
The confidence of the predicted value P (ru,i ) by Eq. (11) can be calculated by equation: con = wu × conu + wi × coni .
4.1. Implementation and Data Collection WSRec is implemented and deployed with JDK6.0, Eclipse3.3, Axis [1], and Tomcat6.0. We obtain a list of 21,197 publicly available Web services from Internet by crawling Web service information from: 1) well-known companies (e.g., Google, Yahoo, Amazon, ect.); 2) portal Websites that list publicly available Web services (e.g., xmethods.net, webservicex.net, etc.); and 3) Web service searching engines (e.g., seekda.com, esynaps.com, etc.). We successfully generate client stub classes for 18,102 Web services using the WSDL2Java tool from the Axis package [1]. A total of 343,917 Java Classes are generated. The Web services which fail during the client stub generation are mainly due to network connection problems (e.g., connection timeout, HTTP 400, 401, 403, 500, 502 and 503),
(12)
When S(u) �= ∅ ∧ S(i) = ∅, since there are no similar items, the missing value prediction degrades to the user-based approach by employing Eq. (7), and the confidence of the predicted value is con = conu . When S(u) = ∅ ∧ S(i) �= ∅, the missing value prediction relies only on the similar items by employing Eq. (8), and the confidence of the predicted value is con = coni . When S(u) = ∅ ∧ S(i) = ∅, since there are no similar users or items for the missing value ru,i , we predict the missing value using the following equation: P (ra,i ) = wu × ra + wi × ri ,
(13) 440
FileNotFoundException (the WSDL file cannot be found) and InvalidWSDLFiles (the WSDL file cannot be parsed). Since it is difficult to monitor all the Web services at the same time, we randomly select 100 Web services, which are located in more than 20 countries. Some of the initially selected Web services had to be replaced due to: 1) authentication required; 2) permanent invocation failure (e.g., the Web service is shutdown); and 3) too long processing duration. 150 computer nodes from Planet-Lab [4], which are distributed in more than 20 countries, are employed to monitor and collect QoS data on the selected Web services. More than 1.5 millions Web service invocations are executed and the test results are collected. Due to space restrictions, this paper only reports the comprehensive analysis of the experimental results. By processing the experimental results, we obtain a 150 × 100 user-item matrix, where each entry in the matrix is a vector including two QoS values: (RTT and failurerate). RTT (round-trip time) presents the time duration between the client sending a request and receiving a response, and failure-rate presents the probability that a request is correctly responded within the maximum expected time, which is 20 seconds, the default setting of Axis [1].
user-based algorithm using PCC (UPCC) [2], and itembased algorithm using PCC (IPCC) [12]. UMEAN employs the average QoS value of the service users on other Web services to predict the missing value, while IMEAN employs the average QoS value of the Web service item observed by other users to predict the missing value for the active users. Eq. (1) and Eq. (2) are employed for the calculation of UPCC and IPCC, respectively. We divide the 150 service users into two parts, one as the training users and the other as the active (test) users. For the active users, we vary the number of QoS values provided by the active users as 5, 10 and 20 by randomly removing item values, and name them Given 5, Given 10, and Given 20, respectively. The removed QoS values will be used as the expected values to study the prediction performance. For the training matrix, we randomly remove entries to make the matrix sparser with density 10% and 20%, respectively. We set λ = 0.1 and T opK = 10. Each experiment is looping 50 times and the average value is reported. Table 1 and Table 2 show the prediction performance of different methods employing the 10% and 20% density training matrix, respectively. In both tables, we observe that our method (WSRec) obtains smaller NMAE values, which means better recommendation quality. Table 1 shows that the NMAE value of WSRec becomes smaller with the increase of the given number (from 5 to 20), indicating that the recommendation accuracy of WSRec is improved by giving more Web service QoS data. With the increase of the training user number from 100 to 140, the recommendation accuracy also shows significant enhancement, indicating that the recommendation accuracy can be enhanced by collecting more training data. As shown in Table 2, the recommendation accuracy is enhanced by increasing the density of the training matrix from 10% to 20%. In both tables, the prediction performance of the failure-rate is worse than the RTT, since the training matrix of failure-rate contains a lot of zero values (all invocations are success). Under all the different experimental settings, WSRec consistently outperforms other methods.
4.2. Metrics Mean Absolute Error (MAE) metric is widely employed to measure the prediction quality of collaborative filtering methods, which is defined as: � �i,j | i,j |ri,j − r , (14) M AE = N where ri,j denotes the expected QoS value of Web service item j observed by service user i, r�i,j denotes the predicted QoS value, and N denotes the number of predicted values. Since different QoS properties of Web services have different value ranges, similar to [10], we use the Normalized Mean Absolute Error (NMAE) metric to measure the prediction quality of our hybrid collaborative filtering method. We define our NMAE to be the standard MAE normalized by the mean of the expected QoS values as follows: N M AE = �
M AE , i,j ri,j /N
4.4. Impact of the Significance Weight Significance weight makes the similarity computation more reasonable in practice and devalues the similarities which look similar but are actually not. To study the impact of the significance weight, we implement two versions of WSRec, one version employs PCC with significance weight (Eq. (3) and Eq. (4)) for the similarity computation, while the other version employs the PCC without significance weight (Eq. (1) and Eq. (2)). In the experiment, we set Given = 5, λ = 0.1, and training users = 140. We vary the density of the training matrix from 0.1 to 1 with a step value of 0.1. We do not study the density value of 0, since
(15)
where smaller NMAE value means higher prediction quality.
4.3. Performance Comparison In order to study the prediction performance, we compare our method(WSRec) with other well-known prediction methods: user-mean (UMEAN), item-mean (IMEAN), 441
QoS Given UMEAN IMEAN UPCC IPCC WSRec
Table 1. NMAE Performance Comparison (Training Matrix Density = 10%) Training Users = 140 Training Users = 100 RTT Failure-rate RTT Failure-rate 5 10 20 5 10 20 5 10 20 5 10 20 1.212 1.131 1.109 2.244 2.210 2.186 1.168 1.066 1.043 2.801 2.267 2.407 0.477 0.474 0.479 0.631 0.649 0.663 0.514 0.515 0.521 0.787 0.790 0.831 1.061 0.855 0.731 2.264 1.700 1.348 1.134 0.931 0.797 1.887 1.682 1.394 0.538 0.532 0.505 0.947 0.968 0.957 0.443 0.411 0.384 0.769 0.759 0.783 0.383 0.353 0.327 0.576 0.567 0.563 0.472 0.452 0.422 0.732 0.714 0.694
QoS Given UMEAN IMEAN UPCC IPCC WSRec
Table 2. NMAE Performance Comparison (Training Matrix Density = 20%) Training Users = 100 Training Users = 140 RTT Failure-rate RTT Failure-rate 5 10 20 5 10 20 5 10 20 5 10 20 1.228 1.138 1.111 2.253 2.354 2.528 1.136 1.117 1.059 2.354 2.340 1.810 0.494 0.495 0.500 0.765 0.788 0.860 0.456 0.462 0.463 0.613 0.634 0.584 0.981 0.707 0.555 1.893 1.686 1.399 0.858 0.655 0.526 1.931 1.569 0.893 0.440 0.387 0.372 0.858 0.833 0.873 0.323 0.297 0.286 0.636 0.616 0.564 0.394 0.352 0.333 0.666 0.655 0.651 0.296 0.280 0.268 0.494 0.492 0.410
Top−K = 5
Top−K = 5
bors for the missing value prediction. Since the number of similar neighbors will increase in a denser training matrix, the devalued neighbors will be therefore replaced by more similar neighbors, making the accuracy improvement more significant. Figure 2 also shows that performance of the WSRec without significance weight is not steady, since it may include dissimilar neighbors, which will greatly influence the prediction performance.
0.4 WSRec With Significant Weight WSRec Without Significant Weight
WSRec With Significant Weight WSRec Without Significant Weight
0.65
0.35
NMAE
NMAE
0.6 0.3
0.55 0.5
0.25
0.45
0.2 0.1
0.2
0.3
0.4
0.5
0.6
0.7
0.8
0.9
0.1
1
0.2
0.3
0.4
0.5
0.6
0.7
0.8
0.9
1
Density of the Failure−rate Training Matrix (b)
Density of the RTT Training Matrix (a)
Top−K = 10
Top−K = 10 0.4 WSRec With Significant Weight WSRec Without Significant Weight
WSRec With Significant Weight WSRec Without Significant Weight
0.6
0.35
4.5. Impact of the Confidence Weight
NMAE
NMAE
0.55 0.3
0.25
0.5
0.45
0.2 0.1
0.2
0.3
0.4
0.5
0.6
0.7
0.8
0.9
Density of the RTT Training Matrix (c)
1
0.4 0.1
0.2
0.3
0.4
0.5
0.6
0.7
0.8
0.9
Confidence weight also plays an important role in our hybrid collaborative filtering method. As discussed in Section 3.4, the confidence weight determines how to make use of the predict values from the user-based method and the itembased method to achieve higher prediction accuracy automatically. To study the impact of the confidence weight, we also implement two versions of WSRec, one version employs confidence weight, while the other version does not. In the experiment, we set Given = 5, λ = 0.1, and training users = 140. We also vary the density of the training matrix from 0.1 to 1. The experimental results are shown in Fig. 3. As shown in Fig. 3, in both Top-K = 5 and Top-K = 10, WSRec with confidence weight outperforms WSRec without confidence weight for both the RTT and failure-rate. Figure 3 also shows that the NMAE values become smaller with the increase of training matrix density. This is because denser training matrix provides more information, which makes the missing value prediction more accurate.
1
Density of the Failure−rate Training Matrix (d)
Figure 2. Impact of the Significance Weight in that case the training matrix contains no information and cannot be employed for the QoS value prediction. Figure 2(a) and 2(b) employ the top 5 similar neighbors for the missing value prediction, while Fig. 2(c) and 2 (d) employ the top 10 similar neighbors for the prediction. Figure 2 shows that WSRec with significance weight obtains better prediction accuracy (smaller NMAE) consistently and the accuracy improvement becomes more noteworthy with the increase of the training matrix density. This is because when the training matrix is sparse, the number of similar neighbors is limited and usually the devaluedneighbors will still be included as the TopK similar neigh442
Top−K = 5
Top−K = 5
0.55
0.7
0.5
0.6 0.55
NMAE
NMAE
NMAE
NMAE
Given 10 Given 20 Given 30
0.45
0.45 0.4
0.4
0.3 0.5
0.35
0.35 0.45
0.25 0.1
Density = 10% Density = 20% Density = 30%
0.5
0.65 0.35
0.55
0.6 WSRec With Confidence Weight WSRec Without Confidence Weight
0.75
0.4
Given 20, Top−K =10
Density 20%, Top−K =10
0.8 WSRec With Confidence Weight WSRec Without Confidence Weight
0.45
0.2
0.3
0.4
0.5
0.6
0.7
0.8
0.9
0.4 0.1
1
0.2
0.3
0.4
0.5
0.6
0.7
0.8
0.9
0.3 0
1
0.2
0.3
0.4
0.5
0.6
0.7
0.8
0.9
1
0.3 0
0.1
0.2
0.3
0.4
0.5
0.6
0.7
0.8
0.9
1
Lambda of the RTT (b)
Top−K = 10
Top−K = 10 0.75 WSRec With Confidence Weight WSRec Without Confidence Weight
0.4
0.1
Lambda of the RTT (a)
Density of the Failure−rate Training Matrix (b)
Density of the RTT Training Matrix (a)
Figure 4. Impact of λ
WSRec With Confidence Weight WSRec Without Confidence Weight
0.7 0.65
NMAE
NMAE
0.35
0.3
0.6
the similar users become more important when more QoS values are available from the active users. This observation is also confirmed by the experimental results reported in Table 1 and Table 2, where the IPCC outperforms the UPCC for all the Given5, Given10 and Given20. This is reasonable, since with limited user-given QoS values, the UMEAN prediction method, which employ the mean of the user-given QoS values to predict the QoS values of other Web services for this user, has higher probability to be inaccurate. This will influence the prediction performance of UPCC, which is based on the value predicted by UMEAN for the missing value prediction as shown in Eq. (7). As shown in Fig. 4(b), with the given number of 20, all the three curves (Density 10, 20 and 30) obtain the best prediction performance at λ = 0.2, indicating that the optimal value of λ is not influenced by the training matrix density.
0.55 0.5 0.45
0.25 0.1
0.2
0.3
0.4
0.5
0.6
0.7
0.8
0.9
Density of the RTT Training Matrix (c)
1
0.4 0.1
0.2
0.3
0.4
0.5
0.6
0.7
0.8
0.9
1
Density of the Failure−rate Training Matrix (d)
Figure 3. Impact of the Confidence Weight
4.6. Impact of λ Different datasets may have different data correlation characteristics (e.g., some may provide better prediction results by employing user-based methods, while others may provide better prediction results by employing item-based methods). Parameter λ makes our prediction method more feasible and adaptable to different environments. If λ = 1, we only extract information from the Web service users, and if λ = 0, we only consider valuable information from the items. In other cases, we fuse information from both users and items based on the value of λ to predict the missing value for the active users. To study the impact of the parameter λ on our hybrid collaborative filtering method, we set Top-K = 10 and training users = 100. We vary the value of λ from 0 to 1 with a step value of 0.1. Figure 4(a) shows the results of Given 10, Given 20 and Given 30 with 20% density training table of RTT, and Fig. 4(b) shows the results of Density 10%, Density 20% and Density 30% with Given = 20 of RTT. The experimental results of failure-rate follow the same trend of RTT and are not reported in this paper due to space restriction. Observing from Fig. 4, we draw the conclusion that the value of λ impacts the recommendation results significantly, and suitable λ values, which enable properly combination of the user-based method and the item-based method, will provide better prediction accuracy. Another interesting observation is that, with the given number increased from 10 to 30, the optimal value of λ, which obtains the minimal NMAE values of the curves in Fig. 4(a), shifts from 0.1 to 0.3. This indicates that the optimal λ value is influenced by the given number. The similar items are more important than similar users when limited Web service QoS values are given by the active users ,while
5. Related Work and Discussion QoS based approaches for Web services selection have been discussed in a number of recent literature [3, 6, 19, 20], which enables optimal Web services to be identified from a set of candidates according to the QoS performance of the candidates and the preference of the service users. Our work is quite different from these approaches since we employ the information of similar service users as well as similar Web service items to predict the QoS performance of Web services. Our method requires no Web service invocation, which will save a lot of resource and time. Collaborative filtering methods are widely adopted in commercial recommender systems [9, 12]. The most analyzed examples of memory-based collaborative filtering include user-based approaches [2, 7] and item-based approaches [5, 13]. Our work provides a comprehensive study of how to provide accurate Web service QoS value prediction by systematically combining the user-based method and the item-based method. There is limited work in the literature employs collaborative filtering methods for Web service recommendation, since there is no large-scale Web service QoS datasets available for studying the QoS value prediction results. Without convincing and sufficient real-world Web service 443
QoS data, the characteristics of Web service QoS information cannot be fully mined and the proposed recommendation algorithms will become merely a redevelopment of the traditional movie recommendation algorithms, which may not be applicable to the Web service recommendation. Work [8, 15] mentions the idea of applying collaborative filtering methods to Web service recommendation and employs the MovieLens dataset for experimental studies, which is not convincing enough. Work [14] proposes a user-based PCC method for the Web service QoS value prediction, however, as shown in Section 4.3, the performance of UPCC is not good when the given number is small. In order to alleviate the data sparsity problem and take advantages of both user-based and item-based collaborative filtering methods, in this paper, we propose an effective and novel hybrid recommendation method. Moreover, a system (WSRec) is designed and implemented for collecting QoS information and conducting comprehensive large-scale real-world experiments which were never explored before. Comprehensive experimental analysis is performed for discovering characteristics of the Web service QoS information. We include Significance weighting, confidence weighting, and the parameter λ in our approach to make full use of the characteristics of the Web service QoS information to achieve more accurate Web service QoS value prediction.
[2] J. S. Breese, D. Heckerman, and C. Kadie. Empirical analysis of predictive algorithms for collaborative filtering. In UAI, 1998. [3] V. Cardellini, E. Casalicchio, V. Grassi, and F. L. Presti. Flow-based service selection forweb service composition supporting multiple qos classes. In ICWS, pages 743–750, 2007. [4] B. Chun, D. Culler, T. Roscoe, A. Bavier, L. Peterson, M. Wawrzoniak, and M. Bowman. Planetlab: An overlay testbed for broad-coverage services. ACM SIGCOMM Computer Communication Review, 33(3):3–12, July 2003. [5] M. Deshpande and G. Karypis. Item-based top-n recommendation. ACM Trans. Inf. Syst., 22(1):143–177, 2004. [6] J. E. Haddad, M. Manouvrier, G. Ramirez, and M. Rukoz. Qos-driven selection of web services for transactional composition. In ICWS, pages 653–660, 2008. [7] R. Jin, J. Y. Chai, and L. Si. An automatic weighting scheme for collaborative filtering. In SIGIR, 2004. [8] K. Karta. An investigation on personalized collaborative filtering for web service selection. Honours Programme thesis, University of Western Australia, Brisbane, 2005. [9] H. Ma, I. King, and M. R. Lyu. Effective missing data prediction for collaborative filtering. In SIGIR, pages 39–46. ACM, 2007. [10] B. Marlin. Modeling user rating profiles for collaborative filtering. In NIPS. MIT Press, 2003. [11] M. R. McLaughlin and J. L. Herlocker. A collaborative filtering algorithm and evaluation metric that accurately model the user experience. In SIGIR, 2004. [12] P. Resnick, N. Iacovou, M. Suchak, P. Bergstrom, and J. Riedl. Grouplens: An open architecture for collaborative filtering of netnews. In Proc. of ACM Conference on Computer Supported Cooperative Work, 1994. [13] B. Sarwar, G. Karypis, J. Konstan, and J. Riedl. Itembased collaborative filtering recommendation algorithms. In WWW, 2001. [14] L. Shao, J. Zhang, Y. Wei, J. Zhao, B. Xie, and H. Mei. Personalized qos prediction forweb services via collaborative filtering. In ICWS, pages 439–446, 2007. [15] R. M. Sreenath and M. P. Singh. Agent-based service selection. Journal on Web Semantics, pages 261–279, 2003. [16] G. Wu, J. Wei, X. Qiao, and L. Li. A bayesian network based qos assessment model for web services. In SCC, 2007. [17] L. Zeng, B. Benatallah, A. H. Ngu, M. Dumas, J. Kalagnanam, and H. Chang. Qos-aware middleware for web services composition. IEEE Trans. Softw. Eng., 30(5):311–327, 2004. [18] L.-J. Zhang, J. Zhang, and H. Cai. Services computing. In Springer and Tsinghua University Press, 2007. [19] Z. Zheng and M. R. Lyu. A distributed replication strategy evaluation and selection framework for fault tolerant web services. In ICWS, pages 145–152, 2008. [20] Z. Zheng and M. R. Lyu. A qos-aware middleware for fault tolerant web services. In ISSRE, pages 97–106, Seattle, USA, November 2008. [21] Z. Zheng and M. R. Lyu. Ws-dream: A distributed reliability assessment mechanism for web services. In DSN, pages 392–397, Anchorage, Alaska, USA, June 2008.
6. Conclusion We propose WSRec, which employs an effective and novel hybrid collaborative filtering method, for Web service recommendation. A systematic QoS information collection mechanism is designed and real-world experiments are conducted. The comprehensive experimental analysis shows the effectiveness and feasibility of WSRec. In our future work, more real-world Web services will be monitored and more QoS properties of Web services will be investigated. The utilization of the predicted QoS values and the combination of different QoS properties will be further explored.
Acknowledgement The work described in this paper was fully supported by grants from the Research Grants Council of the Hong Kong Special Administrative Region, China (Project No. CUHK4158/08E, CUHK4128/08E), and a grant from the Research Committee of The Chinese University of Hong Kong (Project No. CUHK3/06C-SF).
References [1] Apache. Axis2. In http://ws.apache.org/axis2, 2008. 444