Jul 24, 2003 - 50 % ArâC2H6 to 60â40 % HeâC3H8. Energy loss (dE/dx) ... region, corresponding to the polar angle of a track's momen- tum vector with ...
Physics
Physics Research Publications Purdue University
Year
Search for B ->(p)over-bare-(nu)over-bar(e) X decay using a partial reconstruction method N. E. Adam, J. P. Alexander, K. Berkelman, V. Boisvert, D. G. Cassel, P. S. Drell, J. E. Duboscq, K. M. Ecklund, R. Ehrlich, R. S. Galik, L. Gibbons, B. Gittelman, S. W. Gray, D. L. Hartill, B. K. Heltsley, L. Hsu, C. D. Jones, J. Kandaswamy, D. L. Kreinick, A. Magerkurth, H. Mahlke-Kruger, T. O. Meyer, N. B. Mistry, J. R. Patterson, D. Peterson, J. Pivarski, S. J. Richichi, D. Riley, A. J. Sadoff, H. Schwarthoff, M. R. Shepherd, J. G. Thayer, D. Urner, T. Wilksen, A. Warburton, M. Weinberger, S. B. Athar, P. Avery, L. Breva-Newell, V. Potlia, H. Stoeck, J. Yelton, K. Benslama, B. I. Eisenstein, G. D. Gollin, I. Karliner, N. Lowrey, C. Plager, C. Sedlack, M. Selen, J. J. Thaler, J. Williams, K. W. Edwards, A. Bean, D. Besson, X. Zhao, S. Anderson, V. V. Frolov, D. T. Gong, Y. Kubota, S. Z. Li, R. Poling, A. Smith, C. J. Stepaniak, J. Urheim, Z. Metreveli, K. K. Seth, A. Tomaradze, P. Zweber, S. Ahmed, M. S. Alam, J. Ernst, L. Jian, M. Saleem, F. Wappler, K. Arms, E. Eckhart, K. K. Gan, C. Gwon, K. Honscheid, D. Hufnagel, H. Kagan, R. Kass, T. K. Pedlar, E. von Toerne, M. M. Zoeller, H. Severini, P. Skubic, S. A. Dytman, J. A. Mueller, S. Nam, V. Savinov, J. W. Hinson, J. Lee, D. H. Miller, V. Pavlunin, B. Sanghi, E. I. Shibata, I. P. J. Shipsey, D. Cronin-Hennessy, A. L. Lyon, C. S. Park, W. Park, J. B. Thayer, E. H. Thorndike, T. E. Coan, Y. S. Gao, F. Liu, Y. Maravin, R. Stroynowski, M. Artuso, C. Boulahouache, S. Blusk, K. Bukin, E. Dambasuren, R. Mountain, H. Muramatsu, R. Nandakumar, T. Skwarnicki, S. Stone, J. C. Wang, A. H. Mahmood, S. E. Csorna, I. Danko, G. Bonvicini, D. Cinabro, M. Dubrovin, S. McGee, A. Bornheim, E. Lipeles, S. P. Pappas, A. Shapiro, W. M. Sun, A. J. Weinstein, R. A. Briere, G. P. Chen, T. Ferguson, G. Tatishvili, and H. Vogel
This paper is posted at Purdue e-Pubs. http://docs.lib.purdue.edu/physics articles/509
PHYSICAL REVIEW D 68, 012004 共2003兲
¯ e À¯ e X decay using a partial reconstruction method Search for B\p N. E. Adam, J. P. Alexander, K. Berkelman, V. Boisvert, D. G. Cassel, P. S. Drell, J. E. Duboscq, K. M. Ecklund, R. Ehrlich, R. S. Galik, L. Gibbons, B. Gittelman, S. W. Gray, D. L. Hartill, B. K. Heltsley, L. Hsu, C. D. Jones, J. Kandaswamy, D. L. Kreinick, A. Magerkurth, H. Mahlke-Kru¨ger, T. O. Meyer, N. B. Mistry, J. R. Patterson, D. Peterson, J. Pivarski, S. J. Richichi, D. Riley, A. J. Sadoff, H. Schwarthoff, M. R. Shepherd, J. G. Thayer, D. Urner, T. Wilksen, A. Warburton, and M. Weinberger Cornell University, Ithaca, New York 14853, USA
S. B. Athar, P. Avery, L. Breva-Newell, V. Potlia, H. Stoeck, and J. Yelton University of Florida, Gainesville, Florida 32611, USA
K. Benslama, B. I. Eisenstein, G. D. Gollin, I. Karliner, N. Lowrey, C. Plager, C. Sedlack, M. Selen, J. J. Thaler, and J. Williams University of Illinois, Urbana-Champaign, Illinois 61801, USA
K. W. Edwards Carleton University, Ottawa, Ontario, Canada K1S 5B6 and the Institute of Particle Physics, Canada M5S 1A7
A. Bean, D. Besson, and X. Zhao University of Kansas, Lawrence, Kansas 66045, USA
S. Anderson, V. V. Frolov, D. T. Gong, Y. Kubota, S. Z. Li, R. Poling, A. Smith, C. J. Stepaniak, and J. Urheim University of Minnesota, Minneapolis, Minnesota 55455, USA
Z. Metreveli, K. K. Seth, A. Tomaradze, and P. Zweber Northwestern University, Evanston, Illinois 60208, USA
S. Ahmed, M. S. Alam, J. Ernst, L. Jian, M. Saleem, and F. Wappler State University of New York at Albany, Albany, New York 12222, USA
K. Arms, E. Eckhart, K. K. Gan, C. Gwon, K. Honscheid, D. Hufnagel, H. Kagan, R. Kass, T. K. Pedlar, E. von Toerne, and M. M. Zoeller Ohio State University, Columbus, Ohio 43210, USA
H. Severini and P. Skubic University of Oklahoma, Norman, Oklahoma 73019, USA
S. A. Dytman, J. A. Mueller, S. Nam, and V. Savinov University of Pittsburgh, Pittsburgh, Pennsylvania 15260, USA
J. W. Hinson, J. Lee, D. H. Miller, V. Pavlunin, B. Sanghi, E. I. Shibata, and I. P. J. Shipsey Purdue University, West Lafayette, Indiana 47907, USA
D. Cronin-Hennessy, A. L. Lyon, C. S. Park, W. Park, J. B. Thayer, and E. H. Thorndike University of Rochester, Rochester, New York 14627, USA
T. E. Coan, Y. S. Gao, F. Liu, Y. Maravin, and R. Stroynowski Southern Methodist University, Dallas, Texas 75275, USA
M. Artuso, C. Boulahouache, S. Blusk, K. Bukin, E. Dambasuren, R. Mountain, H. Muramatsu, R. Nandakumar, T. Skwarnicki, S. Stone, and J. C. Wang Syracuse University, Syracuse, New York 13244, USA
A. H. Mahmood University of Texas–Pan American, Edinburg, Texas 78539, USA
0556-2821/2003/68共1兲/012004共9兲/$20.00
68 012004-1
©2003 The American Physical Society
PHYSICAL REVIEW D 68, 012004 共2003兲
ADAM et al.
S. E. Csorna and I. Danko Vanderbilt University, Nashville, Tennessee 37235, USA
G. Bonvicini, D. Cinabro, M. Dubrovin, and S. McGee Wayne State University, Detroit, Michigan 48202, USA
A. Bornheim, E. Lipeles, S. P. Pappas, A. Shapiro, W. M. Sun, and A. J. Weinstein California Institute of Technology, Pasadena, California 91125, USA
R. A. Briere, G. P. Chen, T. Ferguson, G. Tatishvili, and H. Vogel Carnegie Mellon University, Pittsburgh, Pennsylvania 15213, USA
共CLEO Collaboration兲
共Received 8 April 2003; published 24 July 2003兲 Using data collected on the ⌼(4S) resonance and the nearby continuum by the CLEO detector at the Cornell ¯ inclusive final states. Electron Storage Ring, we have searched for the semileptonic decay of B mesons to ep ⫺¯ ⫺4 ¯ We obtain an upper limit for b→c decays of B(B→p e e X)⬍5.9⫻10 . For the b→u decay, we find an ¯ e ⫺¯ e )⬍1.2⫻10⫺3 based on a V⫺A model, while a phase space model gives an upper limit of B(B ⫺ →pp ⫺ ¯ upper limit of B(B →pp e ⫺¯ e )⬍5.2⫻10⫺3 . All upper limits are measured at the 90% confidence level. DOI: 10.1103/PhysRevD.68.012004
PACS number共s兲: 13.20.He
I. INTRODUCTION
Semileptonic decays play a prominent role in B physics, because they are simple to understand theoretically and have been used to find B 0 ¯B 0 mixing 关1兴 and the values of the Cabibbo-Kobayashi-Maskawa 共CKM兲 matrix elements: V cb 关2兴 and V ub 关3兴. For many years there have been some mysteries in the B meson semileptonic decays. For example, the measured semileptonic branching fraction of B mesons 关4,5兴 is about 2% lower absolute 共20% relative兲 than theoretical predictions 关6兴. Recently, there has been some progress made on both the experimental and theoretical fronts 关7–10兴, which gives values in better agreement with each other. More measurements are needed to improve the existing results as well as to precisely test the new theoretical calculations. The majority of semileptonic B decays appear to proceed with single mesons accompanying the lepton-antineutrino pair. There is no experimental evidence for baryons in semileptonic B decay. Therefore, in this paper, we will focus on the search for these decay modes. Baryon production in B meson semileptonic decays requires the ‘‘popping’’ of two quark-antiquark pairs from the vacuum. For instance, in a B ⫺ decay, the quark content of the baryons will be (cud)(uud) when b→c, or (uud)(uud) when b→u. The decay mode with the lightest mass b→c final state including ¯ ⫺¯ a proton would be B ⫺ →⌳ ⫹ c p e e . Other higher mass hadronic resonances could also contribute to semileptonic baryon decays with a final state having an electron and an antiproton. There is little guidance for the probable mix of states that might be available so we choose a model with a mixture of modes to study b→c decays. For b→u decays, the lightest mass final state would be either B ⫺ →p ¯p e ⫺¯ e or ¯B 0 →pn ¯ e ⫺¯ e . There is a large group of higher resonances possible. One theoretical paper suggests that the charmless semileptonic B decays to baryons could appear due to baryon
pair production in association with ⬘ 关11兴. We choose to study only the B ⫺ →p ¯p e ⫺¯ e state in our b→u studies. A previous CLEO II measurement of the decay B ⫺ ¯ ⫺¯ →⌳ ⫹ employed full reconstruction for ⌳ ⫹ c pe e c ⫺ ⫹ →pK 关12兴. That analysis yielded an upper limit of ¯ ⫺¯ B共 B ⫺ →⌳ ⫹ c pe e兲 ⬍0.04 ¯ B共 ¯B →⌳ ⫹ c pX兲
共 C.L.⫽90% 兲 .
⫺3 ¯ ⫺¯ This implies B(B ⫺ →⌳ ⫹ (C.L.⫽90%) c p e e )⬍1.7⫻10 ¯ using the Particle Data Group 共PDG兲 value for ¯B →⌳ ⫹ c pX 关7兴. There is also an upper limit on the inclusive rate of ¯ e ⫺ e X)⬍1.6⫻10⫺3 (C.L.⫽90%) 关13兴 from ARB(B→p ¯ e ⫺¯ e deGUS. There are no measurements of the B ⫺ →pp cay. We perform partial reconstruction of the decay B ¯ →p e ⫺ e X, by identifying events with an e ⫺ and ¯p emerging promptly from the B mesons and examining the distribution of the opening angle between the electron and antiproton.1 Muons are not used in this analysis because they are only well identified above 1.4 GeV/c momentum. Few signal leptons are expected at such momenta. In Sec. II we describe the data sample and event selection. The event selection criteria are tailored to search for the de¯ ⫺¯ cay B ⫺ →⌳ ⫹ c p e e . We discuss the angular distribution of the signal and main sources of backgrounds in Sec. III. Section IV describes how we fit the data distribution for the b →c modes. In Sec. V we discuss the analysis for B ⫺ →p ¯p e ⫺¯ e . Section VI summarizes our results.
1
012004-2
Throughout this paper, charge conjugate states are implied.
¯ e ⫺¯ e X DECAY USING A PARTIAL . . . SEARCH FOR B→p
PHYSICAL REVIEW D 68, 012004 共2003兲
II. DATA SAMPLE AND EVENT SELECTION
The analysis described here is based on the data recorded with the CLEO detector at the Cornell Electron Storage Ring 共CESR兲. The CLEO detector 关14兴 is a general purpose detector that provides charged particle tracking, precision electromagnetic calorimetry, charged particle identification and muon detection. Charged particle detection over 95% of the solid angle is achieved by tracking devices in two different configurations. In the first configuration 共CLEO II兲, tracking is provided by three concentric wire chambers while in the second configuration 共CLEO II.V兲, the innermost wire chamber is replaced by a precision three-layer silicon vertex detector 关15兴 and the drift chamber gas was changed from 50– 50 % Ar–C2 H6 to 60– 40 % He–C3 H8 . Energy loss (dE/dx) in the outer drift chamber and hits in the time of flight system just beyond it provide information on particle identification. Photon and electron showers are detected over 98% of 4 steradians in an array of 7800 CsI scintillation counters. The electromagnetic energy resolution is found to be ␦ E/E ⫽0.0035/E 0.75⫹0.019⫺0.001E (E in GeV兲 in the central region, corresponding to the polar angle of a track’s momentum vector with respect to the z axis 共beam line兲, 450 ⬍ dip ⬍1350 . A magnetic field of 1.5 T is provided by a superconducting coil which surrounds the calorimeter and tracking chambers. A total integrated luminosity of 9.1 fb⫺1 was collected by the CLEO II and CLEO II.V configurations at the center-ofmass energy corresponding to the ⌼(4S), corresponding to ¯ pairs. An additional integrated luminos(9.7⫾0.2)⫻106 BB ⫺1 ¯ ity of 4.6 fb taken at energies 60 MeV below the BB threshold provides an estimate of the continuum background ¯ , where q⫽u,d,s,c. events due to e ⫹ e ⫺ →qq All events considered pass the standard CLEO hadronic event criteria, which require at least three well-reconstructed charged tracks, a total visible energy of at least 15% of the center of mass energy and an event vertex consistent with the known e ⫹ e ⫺ interaction point. In order to remove e ⫹ e ⫺ ¯ continuum contributions, the ratio of the second to →qq zeroth Fox-Wolfram moments 关16兴 is required to be less than 0.35. Charged electron and antiproton candidates are selected from tracks that are well-reconstructed, and not identified as a muon. We accept only those charged tracks that are observed in the barrel region of the detector, which corresponds to 兩 cos(dip)兩⬍0.7071. Electrons with momenta between 0.6 GeV/c and 1.5 GeV/c are identified by requiring that the ratio of their energy deposited in the CsI calorimeter and their momentum measured in the tracking system be close to unity and that the ionization energy loss measured by the tracking system be consistent with the electron hypothesis. The ratio of the log of the likelihood for the electron hypothesis to that for a hadron is required to be greater than 3. Electrons within the fiducial volume in this momentum range are identified with an efficiency of ⬃94%. Electrons from ␥ conversion, 0 Dalitz decays, and J/ decays are explicitly vetoed by cuts on the appropriate invariant mass distribution. Antiprotons with momentum between 0.2 GeV/c and
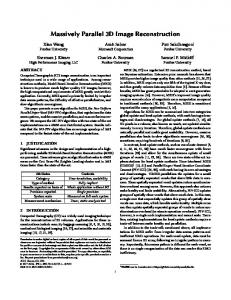
FIG. 1. Distribution of the cosine of the angle between same ¯ signal sign electrons and antiprotons (cos ). Plot 共a兲 shows e/p ⫹¯ ⫺¯ ⫺ combinations from B →⌳ c p e e decay; plot 共b兲 shows uncorrelated background; plot 共c兲 shows correlated background. Plots 共a兲, ¯ Monte Carlo genera共b兲, and 共c兲 are obtained using the CLEO BB tor. Plot 共d兲 shows continuum backgrounds obtained from data.
1.5 GeV/c are identified using the combined information from dE/dx and TOF measurements. Antiproton candidates must lie within 3 standard deviations ( ) of the antiproton hypothesis and outside of 2 for each of the kaon and pion hypotheses. We perform a primary vertex (e ⫹ e ⫺ interaction point兲 constrained fit to the combinations of the electron and antiproton. The fit is required to have a 2 per degree of freedom less than 10. This helps to suppress correlated background where the electron and antiproton come from the same B meson decay. III. PARTIAL RECONSTRUCTION TECHNIQUE
We study the angular correlations between the prompt electron and antiproton. If we define as the angle between the electron and the antiproton, the corresponding cos() distribution is peaked at cos()⫽⫺1 共back-to-back兲 for signal events. Figure 1 shows the cos() distributions for B ⫺ ¯ ⫺¯ →⌳⫹ c pe e signal events and various backgrounds. We will use the difference between the signal and background shapes in this distribution to fit for the amount of signal in our sample. There are four main sources of backgrounds as follows: ¯ com共i兲 Uncorrelated background: This includes the e/p binations where the electron and antiproton are from opposite B meson decays 关see Fig. 1共b兲兴. The cos() distribution of this background would be flat, except a fiducial acceptance correction causes some peaking as seen from the Monte Carlo. ¯ 共ii兲 Correlated background: This includes non-prompt e/p combinations, which are from the same B meson but not
012004-3
PHYSICAL REVIEW D 68, 012004 共2003兲
ADAM et al.
TABLE I. Yields of events from the CLEO II and CLEO II.V data samples, integrated over the entire angular distribution. The last row shows the yield after subtracting the continuum and fake backgrounds. Event type
CLEO II
CLEO II.V
¯ events BB ¯ combinations Overall e/p
3,328,000⫾67,000
6,372,000⫾127,000
10193⫾101
16829⫾130
Continuum background 共scaled兲 Fake e background Fake p background
3656⫾84 212⫾40 1872⫾159
6471⫾114 308⫾58 2859⫾243
Background subtracted distribution
4453⫾210
7191⫾304
from a signal event, such as in the decay chain: B ⫹ ⫺ ¯ ⫺ ¯ ¯ →⌳ ⫺ c X, ⌳ c →⌳ e X, ⌳ →p X 关see Fig. 1共c兲兴. The cos() distribution of this background as found from Monte Carlo is also peaked near cos()⯝⫺1, but less sharply than signal. In the Monte Carlo, the correlated to uncorrelated background fraction is 5– 8 %. 共iii兲 Continuum background: This is the background due ¯ sources, i.e. e ⫹ e ⫺ →qq ¯ , where q⫽u,d,s,c 关see to non-BB Fig. 1共d兲兴 found using data collected at energies below the ⌼(4S). ¯ background: This is due to particles misi共iv兲 Fake e/p dentified as electrons or antiprotons and is found using data. ¯ angular distributions, i.e. cos() We obtain the overall e/p distributions between electrons and antiprotons, for each of the CLEO II and CLEO II.V datasets separately and then ¯ angular distribution found from the combine them. The e/p off-resonance data sample is scaled by luminosity and the energy dependent four-flavor cross section and then subtracted 共the scale factor is approximately 2兲 for each dataset. We subtract the fake electron and antiproton backgrounds using data distributions as described below. After these subtractions, the angular distribution is composed of uncorrelated background, correlated background, and possibly signal. For each bin in the angular distribution, the statistical errors from each subtraction are added in quadrature. Since the continuum background is scaled up, statistical fluctuations can affect the final distribution bin-by-bin by more than just the statistical error on the total number of events. Using Monte Carlo generated shapes for each of these contributions, we fit to a sum of these three components to determine the yield of the signal events. Table I gives the overall yields for the two data samples. The subtractions of the misidentified electron and misidentified antiproton backgrounds follow similar procedures, described here for the fake electrons. The fake electron angular distribution is found using the following equation: 1.5
f bkgd 共 兲 ⫽
兺 兺i
p⫽0.6
f dist 关 cos共 兲 , p 兴 ⫻misid i,p .
Here cos() is the angle between the antiproton and fake electron, p is the momentum of the fake electron 共in GeV/c), i⫽ ,K,p, ; fbkgd is the cos() distribution of e/ ¯p combinations that contain a fake electron, i.e. the fake electron
background; fdist is the angular distribution of non-electrons in each momentum range 共obtained by processing data with an electron anti-identification cut兲; and misid i,p is the electron misidentification probability as a function of momentum, which is calculated by multiplying the abundance of each particle species 共found in Monte Carlo simulations兲 by its corresponding electron misidentification rate 共obtained from data兲 in each momentum range. The electron and positron misidentification probabilities are less than 0.3% per track so there is very little background from this source and are found from the CLEO II dataset. The proton and antiproton misidentification probabilities range from 0.2% per track at lower momenta to 3% per track at higher momenta. These misidentification efficiencies are determined from the CLEO II and CLEO II.V datasets separately and multiplied separately by the angular distributions found from each dataset. The statistical error associated with particle abundance and misidentification rates is determined by the data and Monte Carlo sample sizes, and included in the statistical error from ¯ angular distribution. The negligible the fit to the final e/p amount of Dalitz decay and photon conversion electrons in our sample are included in the correlated and uncorrelated background Monte Carlo samples and not treated as fake electrons. ¯ Monte Carlo generator to obtain We use the CLEO BB the uncorrelated and correlated background angular distribution shapes. For the signal, the angular distribution shapes as well as the efficiency of our event selection are found using the standard CLEO Monte Carlo event generator as well as a phase space generator. The CLEO Monte Carlo generator 共hereafter referred to as ‘‘V-A model’’兲 generates a decay ¯ ⫺¯ such as B ⫺ →⌳ ⫹ c p e e in two steps. The first step is the semileptonic decay of b→cW,W→ᐉ¯ ᐉ , preserving the V-A structure of the weak decay. This step involves a three-body decay, with three initial particles produced: e ⫺ ,¯ e and a (⌳ c¯p ) pseudo-particle. At the second step, the pseudoparticle decays into two particles: ⌳ c and ¯p , ignoring any possible spin correlation. The same mechanism is used to generate the other decay modes, the only difference being that the intermediate state pseudo-particle in the V-A model is varied. The phase space model used is simply a four-body B decay, with all the final state particles generated at one step. The subsequent CLEO detector simulation is GEANT based 关17兴.
012004-4
¯ e ⫺¯ e X DECAY USING A PARTIAL . . . SEARCH FOR B→p
PHYSICAL REVIEW D 68, 012004 共2003兲
FIG. 2. Comparison of signal Monte Carlo models for B ⫺ ¯ ⫺¯ ¯B 0 →⌳ ⫹ and c pe e ⫹⫹ ¯ ⫺ ⫺¯ →⌺ c ⌬ e e . Plot 共a兲 displays the invariant mass of pseudo¯⫺ particle (⌳ c¯p /⌺ ⫹⫹ c ⌬ ). Plot 共b兲 displays the cos() distributions of ¯ combinations. The black trie/p angles show the expectations for ¯ ⫺¯ the B ⫺ →⌳ ⫹ c p e e decay and the histogram with error bars shows ¯ ⫺ ⫺¯ the ¯B 0 →⌺ ⫹⫹ decay c ⌬ e e mode. For the sake of comparison, the distributions have been normalized to unit area.
In the V-A model, the mass of the pseudo-particle could affect the angular distribution between e and ¯p and the electron and antiproton momentum distributions. In the standard CLEO Monte Carlo event generator, the mass spectrum of the pseudo-particle (⌳ c¯p ) is generated as a phase space modified Breit-Wigner distribution, with a central mass of 3.35 GeV/c 2 , and a width of 0.50 GeV/c 2 , as shown in Fig. 2共a兲. This pseudo-particle (⌳ c¯p ) mass spectrum reproduces the measured inclusive B→⌳ c X and B→pX momentum spectra 关18兴. In order to allow the possibility of a lower efficiency, we examine two-body decays into the baryon/ ¯ . We have analyzed the cos() distriantibaryon system X c N ¯ ⫺¯ butions from the following decay modes: B ⫺ →⌳ ⫹ c pe e , ⫹¯ ⫺¯ ⫹⫹ ⫹⫹ ⫺ 0 ⫺ ⫺ ⫺⫺ ¯ e ⫺¯ e , B →⌺ c p e e , ¯B →⌺ c ¯p e ¯ e , B →⌺ c ⌬ 0 ¯ 0 ⫺¯ ⫹ ¯ ⫺ ⫺¯ ⫺ ⫺ ¯B 0 →⌺ ⫹⫹ ¯ ⫺ ⫺¯ c ⌬ e e , B →⌺ c ⌬ e e , B →⌺ c ⌬ e e ⫹ ⫹⫹ 0 0 ⫺ 0 ¯ e ¯ e . The decay mode ¯B →⌺ c ⌬ ¯ ⫺ e ⫺¯ e and ¯B →⌺ c ⌬ provides the softest lepton momentum spectrum and therefore the smallest efficiency for this analysis (13.5⫾0.2)%. The efficiency is calculated for modes with a ¯p in the final ¯ ⫺¯ state. The efficiency from the decay mode B ⫺ →⌳ ⫹ c p e e is the highest at (20.7⫾0.1)%. For comparison, the pseudo-
¯⫺ particle (⌺ ⫹⫹ c ⌬ ) mass spectrum which was generated with a central mass of 3.85 GeV/c 2 , a width of 0.50 GeV/c 2 , and a threshold mass of 3.68 GeV/c 2 , is also shown in Fig. 2共a兲. ¯ Figure 2共b兲 shows the angular distribution of signal e/p combinations for the two modes. For the signal model, we combine these two modes in equal ratios and bracket the model dependence by choosing a model with 100% of either of the two decay modes. Figure 3 compares the V-A and phase space models for the B ⫺ →p ¯p e ⫺¯ e decay mode. It shows that the two Monte Carlo models give significantly different angular distribu¯ combinations in this decay. We choose the tions for the e/p phase space model to bracket the possible efficiencies and angular distributions of various models. IV. SEARCH FOR b\c DECAYS
The cos() distributions for e/ ¯p combinations after subtracting the continuum, fake electron, and fake antiproton backgrounds are shown in Fig. 4 along with the results of the fit. In the fit, we use the shapes obtained from Monte Carlo 关Figs. 1共a兲–1共c兲 and Fig. 2共b兲兴 and allow each of the normal-
FIG. 3. Comparison of two signal Monte Carlo models for ¯ e ⫺¯ e decay. Plot 共a兲 disB ⫺ →pp plays the invariant mass of ¯ ). Plot 共b兲 dispseudo-particle (pp plays the cos() distributions of ¯ combinations for the two e/p models considered. The black triangles show the expectations from the V-A model, while the histogram shows the expected distribution for the phase space model. For the sake of comparison, the distributions have been normalized to unit area.
012004-5
PHYSICAL REVIEW D 68, 012004 共2003兲
ADAM et al.
TABLE III. Systematic errors for the measurement of B ¯ e ⫺¯ e X. These are the contributions to the systematic error →p listed on the first line of Table II.
FIG. 4. The cos() distributions found in data after subtracting the continuum, fake electron, and fake antiproton backgrounds. The plot shows the fit to the combined CLEO II and CLEO II.V datasets using Monte Carlo distributions for the b→c signal 共as discussed in the text兲, correlated background and uncorrelated background. The confidence level of the fit is 29%.
izations of the three components to float independently. Table II gives the results from the fit. There is no evidence for a signal so we calculate an upper limit. From the fit we find ¯ e ⫺¯ e X)⫽(2.5⫾1.9⫾1.1⫾1.4)⫻10⫺4 , correspondB(B→p ¯ e ⫺¯ e X)⬍5.9 ing to a 90% C.L. upper limit of B(B→p ⫺4 ⫻10 . The last error is the model dependence error found from varying the composition of light-mass states with higher resonance states. Table III summarizes the systematic errors. The systematic errors include those associated with each of the backgrounds: correlated, uncorrelated, fake proton and fake electron, as described in more detail below. The two largest errors come from the fake proton subtraction and variations allowed in the uncorrelated background. The correlated background 关Fig. 1共c兲兴 has a similar shape to that of the signal. To calculate a conservative systematic error from this source, we refit the data assuming no corre-
Systematic error
Events
Correlated background Uncorrelated background Fake proton background subtraction Fake electron background subtraction Proton identification efficiency Electron identification efficiency Vertex constrained fit efficiency Signal Monte Carlo sample statistics
⫾98 ⫾183 ⫾299 ⫾29 ⫾75 ⫾25 ⫾63 ⫾33
Total
⫾380
lated background exists and take the difference between the central value in this fit and the original. The uncorrelated background systematic error is found from a combination of normalization and shape errors. The normalization error is added in to form a conservative error in case there is some problem with our Monte Carlo decay model in addition to the errors on the shape discussed below. The Monte Carlo model has not been tuned for the baryon decay modes. If we assume there is no signal or correlated background, we can scale the Monte Carlo normalization by the number of events and compare it with the data. There are a total of 16% fewer data events than in the scaled Monte Carlo; we use this difference to account for the normalization error. The angular distribution of the uncorrelated background is expected to be flat in the absence of acceptance effects. However, as we only accept tracks in the barrel re¯ combinagion of the detector, i.e. 兩 cos(dip)兩⬍0.71, the e/p tions passing the cuts have slightly higher probability to come from the two opposite barrel regions. Therefore, the Monte Carlo angular distribution of this background is peaked towards cos()⯝⫾1 关see Fig. 1共b兲兴. Because of finite spatial segmentation effects, two tracks very close together have a slightly lower efficiency than those that are more
¯ e ⫺¯ e X analysis using a 50%-50% mix of two decay modes: TABLE II. Results from the fits for the B→p ⫹¯ ⫺¯ ⫹⫹ ¯ ⫺ ⫺¯ 0 ¯ B →⌳ c p e e and B →⌺ c ⌬ e e . The first row shows the number of signal events found, with the statistical error determined from the fit and systematic errors determined as discussed in the text. The second and third rows show correlated and uncorrelated backgrounds from the fit, respectively. The result is presented with the statistical, systematic, and model dependence errors in the sixth row. These errors are combined in quadrature to obtain the upper limit listed in the last row. ⫺
Event type
Events
Signal events 共fit兲 Correlated background 共fit兲 Uncorrelated background 共fit兲 Avg. efficiency from Monte Carlo Efficiency corrected signal
834⫾634⫾380 ⫺331⫾1729 11141⫾1303 (17.1⫾0.1)% 4877⫾3708⫾2224
¯ e ⫺¯ e X) B(B→p Upper limit of B 共90% C.L.兲
(2.5⫾1.9⫾1.1⫾1.4)⫻10⫺4 5.9⫻10⫺4
012004-6
¯ e ⫺¯ e X DECAY USING A PARTIAL . . . SEARCH FOR B→p
PHYSICAL REVIEW D 68, 012004 共2003兲
ជ ¯p 兩 ⫹ 兩 P ជ e 兩 distribution. Plot 共a兲 shows the total momentum sum of the electron and antiproton tracks, FIG. 5. CLEO II Data/Monte Carlo 兩 P from different data and Monte Carlo components. The components include: 共1兲 fake proton background from data 共black diamonds兲; 共2兲 fake electron background from data 共open circles兲; 共3兲 uncorrelated background from Monte Carlo 共solid line兲, and 共4兲 correlated background from Monte Carlo 共dashed line兲. The outermost empty triangles represent the sum of all the above backgrounds. The filled black triangles show the overall data distribution, with the continuum background subtracted. Plot 共b兲 is the fit to the final data distribution 共continuum and uncorrelated background subtracted兲 using the fake proton background distribution in the region above 2.5 GeV/c.
back-to-back diminishing the peak near cos()⫽1. We change the shape in the uncorrelated background to a symmetric distribution and fit again; the difference in the fitted central values is 30%. We take half of this ‘‘shape’’ difference 共15%兲 and combine it in quadrature with the normalization difference to find an overall systematic error for the uncorrelated background of 22%. We study additional systematic errors from the fake proជ ¯p 兩 ⫹ 兩 P ជ e 兩 diston background subtraction by comparing the 兩 P tribution in the data and Monte Carlo simulations. Figure 5 ជ ¯p 兩 ⫹ 兩 P ជ e 兩 region above 2.5 GeV/c, the shows that in the 兩 P backgrounds remaining are limited to the fake proton and the uncorrelated background. A Monte Carlo study shows that ¯ ⫺¯ there are no B ⫺ →⌳ ⫹ c p e e signal events in this region in any scenario. The fake electron background is very small compared to the fake proton background as seen in Fig. 5共a兲. Therefore, in the region above (2.5⫺3.0) GeV/c, if we use the scaled Monte Carlo to subtract the uncorrelated backជ ¯p 兩 ⫹ 兩 P ជ e 兩 data distribution should be ground, the remaining 兩 P saturated by the predicted fake proton background 关as shown in Fig. 5共b兲兴. We estimate the systematic error from the fake proton background subtraction from the deviation from complete saturation. The fit gives a difference in normalization of ⬃15% between the amount of predicted fake proton background and that obtained for the best fit to the data, which implies that the fake proton background may be systematically wrong by ⬃15%. We then shift the fake antiproton background normalization by ⫾15% and redo the fit to the final e/ ¯p angular distribution. The difference between the central values obtained from the new fit vs the original fit is
taken as the systematic error for the fake antiproton background subtraction. For the systematic error from misidentified electrons, studies using real pions and kaons in data have been done which determine the errors on the fake probabilities. These fake probability errors and the error associated with using an antielectron identification cut for counting tracks in the data are folded together to combine for an estimate of ⫾20% from this source. This technique is confirmed using a Monte Carlo test which verifies that the number of misidentified particles calculated is consistent with the number generated, and that a 20% error is a conservative estimate. The errors associated with the misidentified electron are also larger than those deduced from the misidentified proton background to account for differences in CLEO II and CLEO II.V misidentification efficiencies and possible remaining real electrons from conversions and Dalitz decays. To calculate the effect on our data sample, we shift the fake electron background normalization by ⫾20%, redo the fits and take the difference between the new fit and the original fit as the systematic error from this source. In addition, errors are added to account for uncertainties in the antiproton and electron identification efficiency differences between Monte Carlo and data. The antiproton identification efficiency is found using an antiproton data sample ¯ →p ¯ in continuum data, as a function of momenfrom ⌳ tum. The momentum spectrum for protons in our Monte Carlo signal sample is used to weight these efficiencies. The overall error from this source is estimated to be 9%. Similarly, for electrons, a CLEO study using radiative Bhabha events in the data itself has determined an overall error of 3%.
012004-7
PHYSICAL REVIEW D 68, 012004 共2003兲
ADAM et al.
¯ e ⫺¯ e analysis TABLE IV. Results from the fits for the B ⫺ →pp using the V-A model. The first row shows the number of signal events found with the statistical error determined from the fit and systematic errors determined as discussed in the text. The second and third rows show correlated and uncorrelated backgrounds from the fit, respectively. ‘‘Efficiency corrected data’’ are results found using the V-A signal Monte Carlo generator model. The statistical and systematic errors are combined in quadrature for the final result.
FIG. 6. The cos() distributions found in data after subtracting the continuum, fake electron, and fake antiproton backgrounds. The ¯ e ⫺¯ e ). The plot shows the fit using a b→u signal model (B ⫺ →pp confidence level for the fit is 34.5%. Note that the only difference between this figure and Fig. 4 is the simulated signal shape.
The error from the continuum background subtraction is statistical, determined by the size of the data sample, and is directly incorporated into the final statistical error, as is the statistical error due to the limited Monte Carlo sample size. There is also an error due to the systematics associated with the constrained vertex fit. This is taken to be half of the inefficiency found from the signal Monte Carlo sample with and without the cut 共7.5%兲. ¯ e À¯ e V. SEARCH FOR THE b\u DECAY B À \pp
¯ angular distribution to the b→u We can also fit the e/p ⫺ ¯ e ⫺¯ e . Figure 3 shows that the signal decay channel B →pp two Monte Carlo generator models give quite different signal ¯ angular distributions for this decay mode. Figure 6 e/p shows the fits to the CLEO II and CLEO II.V cos() distributions, assuming signal events are entirely from B ⫺ ¯ e ⫺¯ e decay, where the signal Monte Carlo events are →pp obtained using the V-A model generator. We see no evidence for a b→u signal from this decay mode. Table IV gives the results based on the V-A model. Systematic errors are calculated using the same procedures described above, for the b →c analysis. We obtain the branching ratio B(B ⫺ ¯ e ⫺¯ e )⫽(5.8⫾3.7⫾3.6)⫻10⫺4 , corresponding to a →pp ¯ e ⫺¯ e )⬍1.2⫻10⫺3 . For 90% C.L. upper limit of B(B ⫺ →pp the phase space model, combining the CLEO II and CLEO II.V datasets, we obtain a branching ratio of B(B ⫺ ¯ e ⫺¯ e )⫽(2.6⫾1.1⫾1.6)⫻10⫺3 , corresponding to an →pp ¯ e ⫺¯ e )⬍5.2⫻10⫺3 共90% C.L.兲. upper limit of B(B ⫺ →pp VI. CONCLUSION
The angular distribution between electrons and antiprotons has been studied to search for semileptonic baryon decays from B mesons. The analysis was optimized to search
Event type
CLEO II and CLEO II.V datasets
Signal events 共fit兲 Correlated background 共fit兲 Uncorrelated background 共fit兲 Efficiency from Monte Carlo Efficiency corrected signal
1685⫾1068⫾1032 ⫺2665⫾2937 12624⫾1991 (14.9⫾0.2)% 11309⫾7169⫾6930
¯ e ⫺¯ e ) B(B ⫺ →pp Upper limit of B 共90% C.L.兲
(5.8⫾3.7⫾3.6)⫻10⫺4 1.2⫻10⫺3
¯ ⫺¯ for the b→c decay B ⫺ →⌳ ⫹ c p e e . For the b→c modes, ¯ ⫺¯ ¯0 we use a 共50%-50%兲 mixture of B ⫺ →⌳ ⫹ c p e e and B ⫹⫹ ¯ ⫺ ⫺ →⌺ C ⌬ e e signal modes and perform a fit to the angular distribution. We see no evidence for a signal and measure an upper limit at 90% C.L., combining the CLEO II and CLEO II.V data samples together, of ¯ e ⫺¯ e X 兲 ⬍5.9⫻10⫺4 B共 B→p
共 V-A model兲 .
These results are an improvement upon the previous limits 关12,13兴, in support of their conclusion that the semileptonic decay of B mesons into baryons is not large enough to cover the discrepancy in the B meson semileptonic branching ratio between theoretical prediction and experimental measurements 关4,6兴. In particular, these results show that charmed baryon production in semileptonic B decay is less than 1.2% of all semileptonic B decays, as compared with ⌳ C production in generic B decays at (6.4⫾1.1)% 关7兴. The results also suggest that the dominant mechanism for baryon production in generic B decays is not external W emission. ¯ e ⫺¯ e . We We also searched for the b→u decay B ⫺ →pp obtain the following upper limits at 90% C.L. for each of the models: B共 B ⫺ →p ¯p e ⫺¯ e 兲 ⬍1.2⫻10⫺3 ⬍5.2⫻10⫺3
共 V-A 兲 共 phase space兲 .
These limits do not constrain any theories at this time. ACKNOWLEDGMENTS
We gratefully acknowledge the effort of the CESR staff in providing us with excellent luminosity and running conditions. M. Selen thanks the Research Corporation, and A. H. Mahmood thanks the Texas Advanced Research Program. This work was supported by the National Science Foundation and the U.S. Department of Energy.
012004-8
¯ e ⫺¯ e X DECAY USING A PARTIAL . . . SEARCH FOR B→p
PHYSICAL REVIEW D 68, 012004 共2003兲
关1兴 H. Albrecht et al., Phys. Lett. B 192, 245 共1987兲. 关2兴 B. Barish et al., Phys. Rev. D 51, 1014 共1995兲; R.A. Briere et al., Phys. Rev. Lett. 89, 081803 共2002兲. 关3兴 R. Fulton et al., Phys. Rev. Lett. 64, 16 共1990兲; H. Albrecht et al., Phys. Lett. B 255, 297 共1991兲. 关4兴 H. Albrecht et al., Phys. Lett. B 318, 397 共1993兲. 关5兴 M. Artuso et al., Phys. Lett. B 399, 321 共1997兲. 关6兴 I. Bigi, B. Blok, M. Shifman, and A. Vainshtein, Phys. Lett. B 323, 408 共1994兲. 关7兴 Particle Data Group, D.E. Groom et al., Eur. Phys. J. C 15, 1 共2000兲, p. 584. 关8兴 T.E. Coan et al., Phys. Rev. Lett. 80, 1150 共1998兲.
关9兴 U. Langenegger et al., hep-ex/0204001; P. Abreu et al., CERN-EP/1999-174; CERN-EP/2001-057. 关10兴 M. Neubert and C.T. Sachrajda, Nucl. Phys. B483, 339 共1997兲. 关11兴 Wei-Shu Hou and A. Soni, Phys. Rev. Lett. 86, 4247 共2001兲. 关12兴 G. Bonvicini et al., Phys. Rev. D 57, 6604 共1998兲. 关13兴 H. Albrecht et al., Phys. Lett. B 249, 359 共1990兲. 关14兴 Y. Kubota et al., Nucl. Instrum. Methods Phys. Res. A 320, 66 共1992兲. 关15兴 T. Hill, Nucl. Instrum. Methods Phys. Res. A 418, 32 共1998兲. 关16兴 G.C. Fox and S. Wolfram, Phys. Rev. Lett. 41, 1581 共1978兲. 关17兴 R. Brun et al., GEANT 3.15, CERN Report DD/EE/84-1, 1987. 关18兴 G. Crawford et al., Phys. Rev. D 45, 752 共1992兲.
012004-9