Fang et al. Genome Medicine (2016) 8:129 DOI 10.1186/s13073-016-0384-y
SOFTWARE
Open Access
XGR software for enhanced interpretation of genomic summary data, illustrated by application to immunological traits Hai Fang, Bogdan Knezevic, Katie L. Burnham and Julian C. Knight*
Abstract Background: Biological interpretation of genomic summary data such as those resulting from genome-wide association studies (GWAS) and expression quantitative trait loci (eQTL) studies is one of the major bottlenecks in medical genomics research, calling for efficient and integrative tools to resolve this problem. Results: We introduce eXploring Genomic Relations (XGR), an open source tool designed for enhanced interpretation of genomic summary data enabling downstream knowledge discovery. Targeting users of varying computational skills, XGR utilises prior biological knowledge and relationships in a highly integrated but easily accessible way to make user-input genomic summary datasets more interpretable. We show how by incorporating ontology, annotation, and systems biology network-driven approaches, XGR generates more informative results than conventional analyses. We apply XGR to GWAS and eQTL summary data to explore the genomic landscape of the activated innate immune response and common immunological diseases. We provide genomic evidence for a disease taxonomy supporting the concept of a disease spectrum from autoimmune to autoinflammatory disorders. We also show how XGR can define SNP-modulated gene networks and pathways that are shared and distinct between diseases, how it achieves functional, phenotypic and epigenomic annotations of genes and variants, and how it enables exploring annotation-based relationships between genetic variants. Conclusions: XGR provides a single integrated solution to enhance interpretation of genomic summary data for downstream biological discovery. XGR is released as both an R package and a web-app, freely available at http://galahad.well.ox.ac.uk/XGR. Keywords: Software, eXploring Genomic Relations, Genomic summary data, Enhanced interpretation, Network analysis, Enrichment analysis, Similarity analysis, Annotation analysis
Background One of the defining characteristics of medical genomics research is the large volume of genomic data available but the comparatively limited amount of biological knowledge revealed. This ‘big-data-limited-knowledge’ discrepancy stems from the heterogeneous forms and handling of raw data (usually unstructured), but is also attributed to imprecision in downstream interpretation [1, 2]. Data ready for downstream interpretation can be conveniently expressed as ‘genomic summary data’; that is, a list of genes or SNPs (or, more generally, genomic * Correspondence:
[email protected] Wellcome Trust Centre for Human Genetics, University of Oxford, Oxford OX3 7BN, UK
regions) along with summary statistics regarding the significance level (e.g. p values). Using genomic summary data as a starting point for knowledge discovery is appealing. Cases in point are genome-wide association studies (GWAS) producing summary data on disease-associated genetic variants (GWAS SNPs) and expression quantitative trait loci (eQTL) mapping producing summary data on expressionassociated genetic variants (eQTL SNPs). Firstly, it simplifies raw data (usually complex) and captures the essential information content. Secondly, GWAS and eQTL summary data are publicly available and well curated in relational databases, such as the GWAS Catalog [3], ImmunoBase [4], GTEx Portal [5], and Blood eQTL browser [6]. By comparison, the limited availability of
© The Author(s). 2016 Open Access This article is distributed under the terms of the Creative Commons Attribution 4.0 International License (http://creativecommons.org/licenses/by/4.0/), which permits unrestricted use, distribution, and reproduction in any medium, provided you give appropriate credit to the original author(s) and the source, provide a link to the Creative Commons license, and indicate if changes were made. The Creative Commons Public Domain Dedication waiver (http://creativecommons.org/publicdomain/zero/1.0/) applies to the data made available in this article, unless otherwise stated.
Fang et al. Genome Medicine (2016) 8:129
genotyping data makes it prohibitively hard for ordinary users to conduct cross-disease and cross-study analyses, particularly those involving multiple data providers. Thirdly, cross-disease GWAS summary data hold great promise in understanding the genetic basis of disease comorbidity [7], whilst eQTL summary data could be useful in identifying genetic targets for drug development [8, 9]. Despite the availability and potential utility of this summary data, precise knowledge discovery itself is not trivial. It raises two critical issues: first, how to more systematically use widely distributed knowledge about genes and SNPs, much of which is unfortunately recorded in natural language; and second, how to achieve insights at the gene network level, which is desirable considering the interdependent and often synergistic nature of biological systems involving multiple players to complete the same task. Knowledge use and access via ontologies provides an effective and efficient solution to the first issue. Using ontologies to annotate genes and gene products dates back to the beginning of this century when the Gene Ontology (GO) consortium initiated efforts to digitise gene functions [10]. Since then, a number of ontologies have been created to describe genes from the perspective of other knowledge domains (e.g. diseases [11] and phenotypes [12, 13]) and to describe protein domains [14]. Recent years have seen the shift in focus from the gene level to the SNP level (and generally to the genomic region level), accelerated by efforts to understand regulatory variants that most commonly underlie GWAS [15], resulting in the generation of increasing amounts of functional genomic data [16]. Compared to coding genes, which are well annotated by ontologies, noncoding genomic regions are lacking such annotations. Their interpretation relies heavily on either extrapolation from nearby genes or functional genomic data generated experimentally by large consortia such as ENCODE [17], FANTOM5 [18], BLUEPRINT Epigenome [19], TCGA [20], and Roadmap Epigenomics [21]. To address the second issue, gene interaction data should ideally be generated experimentally for every tissue, in both normal and diseased conditions given the fact that gene interactions are highly context-specific. In reality, an achievable alternative to this is to assimilate available context-specific interactions into a less contextspecific, so-called ‘ground-truth gene network’ representing unified interaction knowledge. This strategy can be seen in databases such as STRING [22] and Pathway Commons [23]. Acting as a ‘scaffold’, the ground-truth gene network can then be integrated with context-specific summary data to identify the subset of the gene network, or ‘gene subnetwork’, that best explains that data. The above issues identify an emerging need for ‘enhanced interpretation’ (effectiveness, efficiency, and transparency),
Page 2 of 20
particularly at the SNP and genomic region level. To meet this need, and also within our vision of its general use in eXploring Genomic Relations, we develop the open-source software ‘XGR’ for enhancing knowledge discovery from genomic summary data. In addition to its comprehensive use of ontology and network information, we also show the uniqueness of XGR in 1) ontology tree-aware enrichment and similarity analysis and 2) cross-disease network and annotation analysis. Using real datasets [4, 24], we showcase its analytic power in uncovering the genetic landscape of immunological disorders based on GWAS summary data, and also demonstrate its added value in interpreting eQTL summary data of an immune-activated system. In short, XGR is software designed for enhanced interpretation necessary for doing big data science in genomics.
Implementation Overview
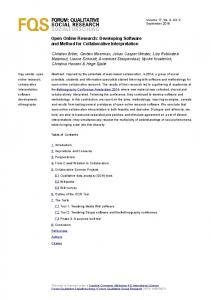
Figure 1 gives an overview of what XGR is and what the user can expect from it. XGR has two ends, the backend (an R package) [25] and the frontend (a web-app) [26]. Metaphorically, it works as a knowledge-driven ‘megabus’, carrying the passengers (users of varying computational skills) from the departure (a user-input list of genes, SNPs, or genomic regions) to the destination (outputs in a user-friendly format including ontology enrichments and network relationships). The petrol used by this megabus is the ontology and network knowledge (see next section), and the engine is its analytical capability, currently supporting enrichment, similarity, network, and annotation analysis (summarised in Table 1; see below for details). Put simply, XGR is designed to interpret genomic summary data resulting from modern genetic studies (differential expression, GWAS, and eQTL mappings), not targeting the upstream generation of summary data but instead enhancing its downstream biological discovery. Source data and uniform representations
As a central part of the knowledge-driven interpretations, we have assembled currently available knowledge at the gene, SNP, and genomic region level (detailed below). All source data are represented uniformly as well-documented RData-formatted files, taking advantage of the R software open-development environment and its infrastructure packages such as igraph [27] and GenomicRanges [28]. The primary source data are maintained as part of in-house relational databases, from which Perl scripts are used to create RData files. Following an established pipeline, they are subject to regular updates and are also regularly supplemented to keep pace with the explosive nature of big data in genomics.
Fang et al. Genome Medicine (2016) 8:129
Page 3 of 20
Web-App Package
INPUT Genomic Summary Data
Web-App
Built-in Data
interactive tables downloadable files barplots/heatmaps network visuals
Genes 1. Ontologies
3. Gene/SNP Annotations
2. Gene Networks
4. Genomic Annotations
SNPs
R-Package
Regions
Analytical Landscape
significance levels (p-values)
Enrichment Analysis
Network Analysis
Similarity Analysis
Annotation Analysis
enrichments (bar/DAG plots) (Fig. 2, 7, 8) cross-disease information (Fig. 3) network relations (Fig. 4) annotations (Fig. 5, 6) similarity (circos/DAG plots) (Fig. 9)
Fig. 1 Schematic workflow of XGR: achieving enhanced interpretation of genomic summary data. This flowchart illustrates the basic concepts behind XGR. The user provides an input list of either genes, SNPs, or genomic regions, along with their significance levels (collectively referred to as genomic summary data). XGR, available as both an R package and a web-app, is then able to run enrichment, network, similarity, and annotation analyses based on this input. The analyses themselves are run using a combination of ontologies, gene networks, gene/SNP annotations, and genomic annotation data (built-in data). The output comes in various forms, including bar plots, directed acyclic graphs (DAG), circos plots, and network relationships. Furthermore, the web-app version provides interactive tables, downloadable files, and other visuals (e.g. heatmaps)
Table 1 A summary of XGR characteristics for tasks achieved and runtime required Tasks achieved
Runtimea
xEnricher
A template for enrichment analysis
~40
xEnricherGenes
Gene-based enrichment analysis using a wide variety of ontologiesb
~40
xEnricherSNPs
SNP-based enrichment analysis using Experimental Factor Ontology on GWAS traits
~70
xEnricherYours
Custom-based enrichment analysis using user-defined ontologies
~5
xEnrichConciser
Removing redundant ones from enrichment outputs
~15
xEnrichBarplot
Barplot of enrichment outputs