Y-MEANS: A CLUSTERING METHOD FOR INTRUSION DETECTION Nabil Belacel Institute for Information Technology Saint John, NB, E2L 2Z6 National Research Council
[email protected]
Yu Guan and Ali A. Ghorbani Faculty of Computer Science University of New Brunswick Fredericton, NB, E3B 5A3 guan.yu,
[email protected] Abstract
As the Internet spreads to each corner of the world, computers are exposed to miscellaneous intrusions from the World Wide Web. We need effective intrusion detection systems to protect our computers from these unauthorized or malicious actions. Traditional instance-based learning methods for Intrusion Detection can only detect known intrusions since these methods classify instances based on what they have learned. They rarely detect the intrusions that they have not learned before. In this paper, we present a clustering heuristic for intrusion detection, called Y-means. This proposed heuristic is based on the K-means algorithm and other related clustering algorithms. It overcomes two shortcomings of K-means: number of clusters dependency and degeneracy. The result of simulations run on the KDD-99 data set shows that Y-means is an effective method for partitioning large data space. A detection rate of 89.89% and a false alarm rate of 1.00% are achieved with Y-means. 1 Keywords: outlier.
Clustering; intrusion detection; K-means;
The basic task of intrusion detection is to audit the log data of a computer, which includes network-based data and host-based data. The signatures of intrusion data are probably different from those of normal data; thus, they can be distinguished by comparing their signatures. Clustering is the method of grouping objects into meaningful subclasses so that the members from the same cluster are quite similar, and the members from different clusters are quite different from each other. Therefore, clustering methods can be useful for classifying log data and detecting intrusions. In an information system, the amount of normal connection data is usually overwhelmingly larger than the number of intrusions. Thus, the population of a normal cluster should be much larger than that of an intrusion cluster, and we may classify these clusters as ‘normal’ or ‘intrusion’ according to their population. K-means [5] is a typical clustering algorithm. It partitions a set of data into k clusters through the following steps. Step 1 (Initialization): Randomly choose k instances from the data set and make them initial cluster centers of the clustering space.
1. INTRODUCTION
Step 2 (Assignment): Assign each instance to its closest center.
Intrusion is defined as “the act of wrongfully entering upon, seizing, or taking possession of the property of another” by the Webster’s Third New International Dictionary. In Information Technology (IT), intrusion is defined as an unauthorized access to or a malicious activity on a computer or an information system. Along with the development of computer networking especially the development of Internet, networked computers are playing very important roles in our daily life as well as in our business. As nodes of the vast network, the networked computers are more vulnerable than ever before. They are exposed not only to the hostbased intrusions, but also to miscellaneous network-based intrusions, such as Bandwidth Theft and Denial of Service (DoS).
Step 3 (Updating): Replace each center with the mean of its members.
1 CCECE 2003 CCGEI 2003, Montr´ eal, May/mai 2003 c 0-7803-7781-8/03/$17.00 2003 IEEE
Step 4 (Iteration): Repeat Steps 2 and 3 until there is no more updating. K-means has been used for clustering data for decades. However, It has two shortcomings in clustering large data sets: number of clusters dependency and degeneracy. Number of clusters dependency is that the value of k is very critical to the clustering result. Obtaining the optimal k for a given data set is an NP-hard problem [4]. Degeneracy means that the clustering may end with some empty clusters. This is not what we expect since the classes of the empty clusters are meaningless for the classification. The H-means+ algorithm [4] can overcome the degeneracy by replacing the empty cluster with a newly created
- 001 -
cluster. The center of the new cluster is the global furthest point of the data set. The global furthest point is the local furthest point with the greatest distance from its local center; and the local furthest point of a cluster is the remotest point from the cluster center. When an empty cluster is found in step 2 of K-means, the global furthest point will be removed from its cluster and be designated as a new cluster center to replace the empty cluster center. After that, steps 2 to 4 of K-means will be carried out again. This iteration will go on until no empty cluster exists. In [6] Leonid Portnoy presented an algorithm for automatically detecting both known and new intrusions. He used a single-linkage clustering to separate intrusion instances from the normal instances. At the beginning of his algorithm, a number of empty clusters are created. For each new instance retrieved from the normalized data set, his algorithm checks the distance to the centers of the clusters. The cluster with the shortest distance is selected, and if the shortest distance is less than predefined constant W (cluster width), then the instance is assigned to that cluster. Otherwise, a new cluster is created with the instance as the center [6]. Afterwards, each cluster center is updated to the mean of the cluster members. And then all the instances will be re-assigned to the updated cluster centers. This cycle of update and re-assignment will iterate until each center has no more updating. Portnoy’s algorithm overcomes the shortcoming of number of clusters dependency, but it requires the values of W to be decided manually for each given data set. An ad hoc value of W cannot always guarantee an optimal clustering for arbitrarily distributed data. Moreover, with an improper W, his algorithm might label some intrusions as ‘normal,’ and some normal ones as ‘intrusion’. Our aim is to develop a clustering algorithm for intrusion detection, which is able to overcome the shortcomings of K-means and at the same time does not need to define a fixed cluster width, which is required by Leonid Portnoy’s algorithm.
2. METHODOLOGY Y-means is our proposed clustering algorithm for intrusion detection. It is expected to automatically partition a data set into a reasonable number of clusters so as to classify the instances into ‘normal’ clusters and ‘abnormal’ clusters. It also overcomes the shortcomings of the K-means algorithm.
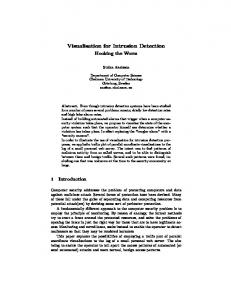
2.1. Y-means Algorithm Figure 1 illustrates the Y-means algorithm. Similar to Kmeans, it partitions the normalized data into k clusters. The number of clusters , k, can be a given integer between 1 and n exclusively, where n is the total number of instances. The next step is to find whether there are any empty clusters. If there are, new clusters will be created to replace these
empty clusters; and then instances will be re-assigned to existing centers. This iteration will continue until there is no empty cluster. Subsequently, the outliers of clusters will be removed to form new clusters, in which instances are more similar to each other; and overlapped adjacent clusters will merge into a new cluster. In this way, the value of k will be determined automatically by splitting or merging clusters. The last step is to label the clusters according to their populations; that is, if the population ratio of one cluster is above a given threshold, all the instances in the cluster will be classified as normal; otherwise, they are labeled intrusive.
Normalizing data
Assigning instances into k clusters (1 < k < n)
There is empty cluster
No
Yes Replacing empty clusters
Adjusting k by creating or merging clusters
Labeling instances according to their population
Figure 1. Y-means algorithm
2.2
Splitting Clusters
An outlier is a point that is quite different from the majority of the points in a cluster. When Euclidean distance is used to evaluate the difference between two points, an outlier is the point that is remote from the majority of points. Since the cluster center is the mean vector of all the points in the cluster, and all points are assumed having equal weights, one can find outliers using the radius of points; that is, if the radius of a point is over the threshold, it is considered as an outlier. The idea of detecting outliers comes from the theory of robust regression and outlier detection [7]. From the “Cumulative Standardized Normal Distribution Function” table in [2], we found that 99% of the instances of the cluster stay within the circle with a radius of 2.32σ, where σ is the standard deviation of the data. Therefore, we choose the threshold t = 2.32σ. The area within the circle is called the Confident Area of the cluster. Thus, in the cluster any point that stays out of the Confident Area will be deemed an outlier, and the remotest outlier will be removed first to form a new cluster. Then, this new cluster may snatch some points from its neighbor clusters. In the Y-means algorithm, the splitting will iterate until no outlier exits. The splitting procedure turns clusters into finer grains; and makes the instances in the same cluster more similar to each other, while it increases the number of clusters. However, it may partition the data set into too small clusters, i.e.,
- 002 -
over-splitting. In order to avoid the over-splitting, we can merge the overlapped adjacent clusters.
2.3. Merging Clusters
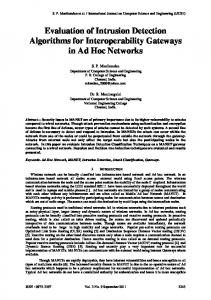
when the data are taken from the network log file. Usually, as the value of k increases, the Sum of Square Error (SSE) of the whole clustering space will decrease [3].
When two adjacent clusters have an overlap, we can merge them into a larger cluster. We set the merging threshold to 2.32σ as well; that is, whenever there are some points in a cluster’s Confident Area also fall in another cluster’s Confident Area, the two clusters can be merged. The center of the new cluster can be obtained simply by calculating the mean vector of the two previous centers.
3. EVALUATION As an approach to intrusion detection, Y-means is tested with a subset of KDD-99 data [1]. KDD-99 is the abbreviation of “International Conference on Knowledge Discovery and Data Mining 1999.” KDD-99 data includes a wide variety of intrusions simulated in a network environment.
3.1. Performance Measures To evaluate the accuracy of a system, we use two indicators, which were used in [6]: Detection Rate (DR) and False Alarm Rate (FAR). DR equals the number of intrusions divided by the total number of intrusions in the data set; FAR equals the number of normal instances divided by the number of normal instances in the data set. The value of DR is expected to be as large as possible, while the value of FAR is expected to be as small as possible.
Figure 2. The number of clusters vs. Sum of Square Error
3.2. Results H-means+ is a clustering algorithm that partitions a set of points into k clusters. A fixed value of k cannot always guarantee a reasonable clustering of an arbitrary-sized data set with an unknown distribution. This is especially true
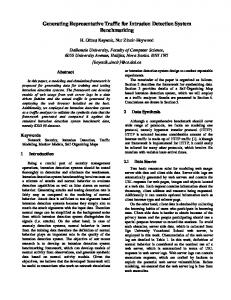
Figure 3. H-mean+ with different number of clusters
We partitioned 2,456 instances of KDD-99 data using the H-means+ algorithm with different initial values of k. The results are shown in Figures 2 and 3. Figure 2 shows that the decline of SSE is fast when the value of k is very small, since the instances in the same cluster may be quite different from each other. Splitting clusters can significantly decrease the value of SSE. After k reaches the turning point, the decline of SSE will become slow. At this point, the data set may have been well partitioned; that is, the instances in the same cluster are similar to each other; but the clusters are not too close to each other. As k increases further, the data set will be partitioned into smaller clusters, which are closer to each other. Thus, the increment of k after the turning point will not decrease the value of SSE greatly. When k reaches the total number of the instances, each cluster contains only one point. Whereas, when k equals one, all instances are grouped into one cluster. In either case, the clustering does not make sense. There is a trade off between the similarity of clusters in the clustering space (sc) and similarity of points (sp) in each cluster. We intend to find the optimal number of clusters to make the sc as small as possible and the sp as large as possible. In Figure 2, the optimal k is found to be 20. Figure 3 shows that both DR and FAR increase as k increases. At the turning point, k = 20, DR = 79% and FAR = 1%. With the H-means+ algorithm, we have to try different ks in order to find the optimal one (i.e., the turning point of SSE). This method is suitable for a small static data set. But, a suitable unsupervised clustering technique for intrusion detection should be able to automatically obtain the optimal k. Y-means is such an algorithm. Y-means partitioned the same data set into 16 to 22 clusters as shown by the approximately horizontal line in Figure 4, when the initial number of clusters varied from 1 to 96. On average, the final number of clusters is about 20. This is exactly the value of the optimal k in H-means+. On average,
- 003 -
sions as well as unknown intrusions. Our experimental results show that Y-means is a promising clustering method for intrusion detection without supervision.
Acknowledgements The first author and Dr. Nabil Belacel acknowledge the funding provided by NRC, Fredericton, in support of this work. Dr. Ghorbani also gratefully acknowledges the support from NSERC through grant RGPIN2277441-00.
References Figure 4. Initial number vs. final number of clusters
[1] KDD Cup 1999 Data. University of California, Irvine, http://kdd.ics.uci.edu/databases/kddcup99/kddcup99.html, 1999. [2] K. Brownlee. Statistical Theory and Methodology. John Wiley and Sons, Inc., New York, 1967. [3] R. O. Duda, P. Hart, and D. Stork. Pattern Classification. John Wiley and Sons, Inc., New York, 2001. [4] P. Hansen and N. Mladenovic. J-means: a new local search heuristic for minimum sum-of-squares clustering. Pattern Recognition, 34(2):405–413, 2002. [5] J. MacQueen. Some methods for classification and analysis of multivariate observations. Proceedings of Fifth Berkeley Symposium on Mathematical Statistics and Probability, 2:28– 297, 1967. [6] L. Portnoy. Intrusion detection with unlabeled data using clustering. Columbia University, 2000. [7] P. Rousseeuw and A. Leroy. Robust Regression and Outlier Detection. Wiley Series in Probability and Mathematical Statistics. Applied probability and statistics, New York, 1987.
Figure 5. Y-means with different initial number of clusters
the Y-means algorithm detected 86.63% of intrusions with a 1.53% of false alarm rate, as shown in Figure 5. The best performance was obtained when DR = 89.89% and FAR = 1.00%. After Y-means was trained with another 12,000 unlabeled instances from KDD-99 data set. we tested the trained system with 10,000 labeled instances, which were randomly chosen from the KDD-99 data set. An 82.32% detection rate and a 2.5% false alarm rate were attained.
4. CONCLUSION In this paper, we proposed a K-means based clustering algorithm, named Y-means, for intrusion detection. Y-means overcomes two shortcomings of K-means: number of clusters dependency and degeneracy. The initial number of clusters is no longer critical to the clustering results in the Ymeans algorithm. A data set can be partitioned into an appropriate number of clusters automatically. This is one of the advantages of the Y-means algorithm for intrusion detection. Another advantage is that the raw log data of information systems can directly be used as training data without being manually labeled. This feature may provide the Y-means algorithm with the ability to detect known intru- 004 -