Published online 8 June 2010
Nucleic Acids Research, 2010, Vol. 38, Web Server issue W743–W748 doi:10.1093/nar/gkq538
ZOOM Lite: next-generation sequencing data mapping and visualization software Zefeng Zhang1, Hao Lin2 and Bin Ma2,* 1
Bioinformatics Solutions Inc., Waterloo, ON N2L 6J2 and 2David R. Cheriton School of Computer Science, University of Waterloo, Waterloo, ON N2L 3G1, Canada
Received March 1, 2010; Revised May 27, 2010; Accepted May 28, 2010
ABSTRACT High-throughput next-generation sequencing technologies pose increasing demands on the efficiency, accuracy and usability of data analysis software. In this article, we present ZOOM Lite, a software for efficient reads mapping and result visualization. With a kernel capable of mapping tens of millions of Illumina or AB SOLiD sequencing reads efficiently and accurately, and an intuitive graphical user interface, ZOOM Lite integrates reads mapping and result visualization into a easy to use pipeline on desktop PC. The software handles both single-end and paired-end reads, and can output both the unique mapping result or the top N mapping results for each read. Additionally, the software takes a variety of input file formats and outputs to several commonly used result formats. The software is freely available at http://bioinfor .com/zoom/lite/. INTRODUCTION With the increasing use of the next-generation DNA sequencing technology, more and more sequencing data is becoming available to help biological research in a variety of fields (1–7). Illumina Genome Analyzer and Applied Biosystems SOLiD systems generate gigabases of data in a single instrument run within days. Such high volumes of sequencing data brings about many computational challenges, including mapping a vast amount of short reads back to reference sequences and visualizing the mapping results. In the last two years, many reads mapping software tools have been developed. These include SOAP (8), RMAP (9), ZOOM (10), MAQ (11), SHRiMP (12), Bowtie (13) and others. Subsequently, many graphical viewers, such as EagleView (14), MapView (15), NGSView (16) and Tablet (17), have
also been created to visualize mapping results produced by next-generation sequencing instruments. However, most of the mapping software packages are running in a Linux command-line environment. It would be more convenient for users if there was an integrated solution for both mapping and visualization. One possible solution to this hurdle is to use web services, such as Galaxy (18). However, transferring huge amount of data via Internet is a burden as well as the data security issues would need to be addressed. Along with the growing throughput and the dropping cost of next-generation sequencing technology, short reads analysis is expected to become a routine work for laboratories around the world, which raises the urgent need for biologist-friendly software to easily handle large volumes of sequencing data efficiently and visualize the analysis results with intuitive and straightforward operations on desktop computers. To address a broader market in next-generation sequencing, we present ZOOM Lite, a software tool for the desktop computer, which enables users to map and visualize sequenced reads. ZOOM Lite integrates efficient and flexible short reads mapping on both Illumina reads and SOLiD color space reads with informative mapping results visualization in a well-designed and easy-to-use graphic user interface (GUI). With simple operations in the GUI windows, biologists can load sequencing data files, choose running parameters, run mapping tasks in parallel using up to four CPU cores, and monitor and control the mapping tasks. The mapping results can be visualized in high quality at various scales from the read depth graph over an entire chromosome to the detailed sequence alignments between reads and tens of base pairs of the reference sequence. ZOOM Lite also provides several ways to navigate to any regions of interest. A range of file formats are accepted as the input and mapping results can be exported to multiple file formats including ZOOM format, SAM, BED and GFF.
*To whom correspondence should be addressed. Tel: +1 519 8884567 (Ext 32747); Fax: +1 519 8851208; Email:
[email protected] The authors wish it to be know that, in ther opinion, the first two authors should be regarded as joint First Authors. ß The Author(s) 2010. Published by Oxford University Press. This is an Open Access article distributed under the terms of the Creative Commons Attribution Non-Commercial License (http://creativecommons.org/licenses/ by-nc/2.5), which permits unrestricted non-commercial use, distribution, and reproduction in any medium, provided the original work is properly cited.
W744 Nucleic Acids Research, 2010, Vol. 38, Web Server issue
The mapping kernel of ZOOM Lite is based on the multiple spaced seeds framework we designed in Ref. (10), which guarantees a maximized rate of true-positive detection with high speed and a dynamic programming algorithm to map SOLiD color space reads to nucleotide reference sequence with automatic error correction. Both single-end and paired-end reads of various lengths from 15 to 240 bp can be mapped to the reference sequence, allowing any number of mismatches and one insertion/ deletion of various lengths per read. Either the uniquely mapped results or the best (top N) results for each read can be reported. Quality scores can be utilized to enhance mapping accuracy either during the mapping process or in the final ranking step of the mapping results. ZOOM Lite is freely distributed as a binary installation package for both Linux and Windows, with an elaborate manual to help users get the most out of ZOOM Lite to help their researches. METHODS To handle the large volume of next-generation sequencing data effectively, both reads mapping with high efficiency and sensitivity, and quick visualization and navigation inside the extensive mapping results are important. Efficient and accurate mapping kernel ZOOM Lite adopts the method of first indexing reads in RAM, scanning the reference sequence to find all possible mapping positions for each read and then verifying all these candidate positions to return the best or top N mapping results for each read. Multiple optimal-spaced seeds and efficient verifying algorithm are two reasons for the speed and accuracy of the mapping kernel. No heuristic is used to compromise the mapping accuracy.
other is the mutation between the reference sequence and the sample sequence. We use a verifying algorithm for color space reads similar to the algorithm in Ref. (19) to correct sequencing errors and decode color space bases into nucleotide bases during the process of mapping. Since one sequence mutation can produce at most two adjacent errors in color space, to get those candidate positions with at most k mutations with the read, we can safely discard those positions having more than 2k errors between the read and the reference sequences in color space. This lossless filter step is added before the verification of mapping candidates. Also for modern CPUs, SSE (Streaming SIMD Extensions) instructions are used to accelerate the dynamic programming of verifying algorithm. Flexible and memory efficient result display When visualizing mapping results, users can view the detailed alignments for a given area on the reference sequence. When the width of this area is zoomed above a threshold, the coverage overview is displayed instead. In order to support both viewing modes with limited amount of memory, ZOOM Lite records coverage information in a compressed format and loads detailed reads and alignments information only when necessary. To support random access of the results, these alignments are sorted and indexed according to their leftmost reference sequence positions. When the user is navigating along the reference sequence, two buffering caches for the detailed information near the current viewing location are maintained in memory and refreshed whenever necessary. This increases the performance, especially when the area to be displayed is near the cached window boundary. ZOOM LITE
Multiple optimal spaced seeds. We found that the number of indexes for each read largely influences speed and memory usage during mapping. In Ref. (10), we designed a novel framework to achieve 100% sensitivity with the least number of indexes for each read via coordinating multiple spaced seeds. Here, 100% sensitivity means all position candidates are guaranteed to be found if there are at most k mismatches between the candidate and the read of length m. In this way, 100% mapping sensitivity can be guaranteed with a significant speed advantage over former hashing methods. Furthermore, by using different sets of multiple spaced seeds, we can trade between higher speed and better sensitivity as users prefer.
Input and output
Color space reads verifying algorithm. Color space reads are quite different from the reads coded in nucleotide bases. Any two adjacent bases are encoded by one of four colors. If a color space read is directly decoded into the nucleotide space, any sequencing error in the color space will be propagated to all the bases after. There are two sources of errors between the read and its target region on the reference sequence. One is the sequencing error on the color space read itself, while the
Data loading and mapping parameters selecting
ZOOM Lite requires two inputs from the user: reads and reference sequences, both of which can be a single or multiple files or directories containing these files. A range of file formats of Illumina reads and SOLiD color space reads are accepted, including FASTA file, FASTQ file, *_seq.txt and *_qual.txt specifically for Illumina reads and *.csfasta, *_QV.qual, *.csfastq files for SOLiD reads. ZOOM Lite can export the mapping results in ZOOM format output and SAM format for post-analysis, or BED and GFF file for further surveying with UCSC browser track information. Both uniquely mapped reads and the top N mapping result can be exported.
Reads files and reference sequences files are loaded by selecting multiple files or directories containing these files. Quality score files can be mated with sequence files automatically according to the prefix or suffix of file names. Likewise, two mated paired-end reads files can also be automatically paired. Various read lengths are allowed in reads data. Parameters are organized in five groups (Table 1) in an intuitive GUI window.
Nucleic Acids Research, 2010, Vol. 38, Web Server issue W745
Table 1. Parameter list of ZOOM Lite Parameter option
Description
Organism
. Determine whether the mapped reads are assembled as a diploid or not
Paired-end settings
. Set the minimum and the maximum distance between the two read mates
Read quality
. Whether or not to ignore low-quality bases when mapping
Mapping criteria
. Set the number or ratio of mismatches or indels allowed between reads and the reference sequence . Whether to achieve high sensitivity
Collecting results
. Whether to include top N mapping results for each read . Utilize quality score to rank mapping positions of each read before returning mapping results
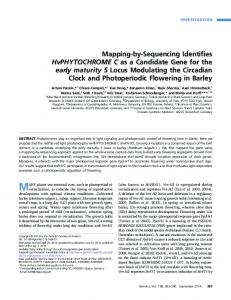
Job partitioning and mapping task scheduling When the amount of reads of a job is large, ZOOM Lite will automatically partition the reads into several smaller parts and create a task for each of them. These tasks are automatically scheduled among multiple CPU cores. Upon completion of all tasks, all mapping results are merged and organized for future visualization. The data size of each task can be revised by the user according to the memory size of their computer. Up to four CPU cores are supported upon user’s configuration. The default configuration utilizes one CPU core under Windows or two CPU cores under Linux. Mapping result visualization The main interface of ZOOM Lite is divided into four windows, labeled by A, B, C and D in Figure 1. The left part of main window (Figure 1) space is used to manage the jobs and control the progress of reads mapping. Figure 1C is the ‘Mapping Illustration Window’ showing the mapping results along the reference sequence and Figure 1D is the ‘Detailed Information Window’ to show more specific mapping information. Running tasks, finished tasks and newly created tasks to be scheduled are all organized in a job tree (Figure 1A). A large job can be split into many smaller tasks. Different icons on the nodes of the job tree denote the different states of the mapping tasks and the progress of each task is shown by a progress bar (Figure 1B). Users can also cancel a running task and restart it later. After mapping tasks are finished, a result node appears under the job node. Users can choose the node and let the software assemble the mapped reads. A read depth graph in Figure 1C provides an overview of all mapping results along the whole reference sequence. The users also have the choice to switch reference sequences, navigate to regions of interest or zoom in to see alignment details. Zoom-in and zoom-out buttons can help users to get either detailed or overview information of mapping results. Clicking any region in the window, such as an irregular peak, will illustrate the sequence-level alignments between mapped reads and the reference sequence together with the assembled consensus sequence (Figure 2A). Red color spotlights the differences between reads and the reference sequence or the difference between the consensus sequence and the reference sequence. Gapped alignments are supported as well. The
consensus sequence is distinguished from the reference sequence with a light green background. For SOLiD color space data, the display mode can be switched between the decoded reads in nucleotide space and the reads in color space (Figure 2). If several jobs have the same reference sequences, their mapping results can be shown together along the reference sequence. Read information and alignment Clicking on a read of interest on the ‘Map Results Illustration’ window will highlight the read by a red rectangle. The detailed mapping information and the sequence alignment between the read and its target sequence on the reference sequence will be shown in the panel below. Mapping information includes read name, mapping position on the reference sequence, differences between the read and its target segment on the reference sequence, and the mapping direction. The differences in the alignment are highlighted by red color. The quality score of each base on the read is illustrated with a black bar under it helping users assess potential sources of sequencing errors. A lower bar denotes lower sequencing quality score on this base. For SOLiD data, both the color space read and the decoded read in nucleotide space are displayed. Flexible navigation ZOOM Lite provides a few ways to navigate to any interesting regions. Users can: (i) click and drag a rectangle on the read depth graph (such as a region with unusually high or low coverage) to zoom the region in the rectangle into the entire ‘Map Results Illustration’ window; (ii) click any interesting point or provide the coordinate (such as a SNP position) to see the sequence alignments around this position; (iii) drag the horizontal scrolling bar to the region they would like to view; and (iv) enter the offset range (such as an exon region) and jump to the region. User can also record multiple regions as browsing history and switch between them quickly. Other features Paired-end reads and read depth. The mate of a paired-end read will be displayed by clicking a button after selecting the read in the ‘Map Results Illustration window’. If users hang the mouse over a position in the ‘Mapping Result
W746 Nucleic Acids Research, 2010, Vol. 38, Web Server issue
Figure 1. The main window of ZOOM Lite. (A) ‘Jobs Tree’ to organize projects user created. Each job node has two nodes. One is ‘Scheduling’ showing the mapping tasks launched for this job. The other is ‘Results’ appearing after the job is finished. (B) ‘Monitor window’ to monitor the mapping progress of jobs. (C) Overview of the read depth graph along the whole reference sequence. Multiple navigation modes are supported in this window. (D) ‘Detailed Information Window’ to show the alignment between a specific read and the reference sequence as in this figure or mapping results summary.
Figure 2. The sequence alignment view of mapping results. The reference sequence and the assembled consensus sequence (with green background) are at the bottom of the ‘Mapping Result Illustration Window’. The mapped reads are piled along the reference sequence. Red color spotlights the differences. (A) This is an example of SOLiD data in decoded nucleotide reads mode. (B) This is the color space reads mode of the same data as in (A).
Nucleic Acids Research, 2010, Vol. 38, Web Server issue W747
Table 2. Performance of ZOOM Lite Data type
Data size
Reference
Loading time
Mapping time (h:min)
Illumina Illumina SOLiD
58 432 508 24 279 572 57 824 126
Arabidopsis Human(hg18) E. coli
9 5 10
00:36 05:30 00:12
Illustration Window’, the read depth at the offset of the reference sequence will appear. Job properties and mapping summary. The ‘Job Properties’ button lets users check the data files and parameters used in the selected job. Also a note of short memorandum description by the users when creating the job is shown. ZOOM Lite can also report the mapping results summary, which includes total number of reads, the number of uniquely mapped reads or ambiguously mapped positions, the length of the reference sequences and the amount and ratio of mapped reads with different number of mismatches or indels. Sample data and documentation. ZOOM Lite provides sample single-end and paired-end reads data of both Illumina and SOLiD in the installation directory. The ‘Help’ menu of ZOOM Lite provides an elaborate manual including a step-by-step tutorial and the more advanced usage and parameter descriptions.
Currently, the Windows version of ZOOM Lite is 32-bits, which can use no more than 2G RAM. The Linux version of ZOOM Lite has a better performance due to the utilization of more RAM and CPU cores. We suggest users to use Linux version on very high volume of data especially when mapping to mammal reference sequences. ACKNOWLEDGEMENTS We are grateful to the anonymous reviewers whose comments helped us a lot to improve the manuscript. We also want to thank Wes Farquharson for the effort to polish the English writing. FUNDING China 863 National High-tech R&D Program (2008AA02Z313 to H.L. and B.M., in part); NSERC (Natural Sciences and Engineering Research Council of Canada) (RGPIN 238748-2006 to H.L. and B.M., in part); NSERC Collaborative grant (to H.L. and B.M., in part); Bioinformatics Solutions Inc (to Z.Z.). Funding for open access charge: NSERC (RGPIN 238748-2006). Conflict of interest statement. None declared. REFERENCES
PERFORMANCE We have tested ZOOM Lite on several Illumina and SOLiD data sets with data size ranging from 10 to 50 million reads. Table 2 shows the time consumed on reads loading and reads mapping for three instances. The first data set is 58 million 40 bp Arabidopsis thaliana Illumina reads—‘SRR013328.fastq’ from SRX000702 of NCBI SRA (20). The second one is 24 million 51 bp human Illumina reads from European Read Archive (AC:ERR000589) (19) and the third data set is Escherichia coli DH10B Mate Pair Data from Software Community of the SOLiD Inc with over 57 million color space reads of length 50 bp. All reads are mapped allowing four mismatches, using two CPU cores on a 2.4 Hz Q6600 Linux machine with 4G RAM. DISCUSSION ZOOM Lite is an efficient, accurate and easy-to-use GUI software for the next-generation sequencing reads mapping and visualization. Tens of millions of reads can be mapped and visualized with high quality on a desktop computer with minimal user intervention. Reads mapping is an essential step of many next-generation sequencing reads analysis. ZOOM Lite will be helpful for applications such as targeted resequencing, whole-genome resequencing and CHIPSeq. It is also a start to other analysis. We are also open to users’ feedback to continue to improve ZOOM Lite.
1. Bentley,D.R. (2006) Whole-genome re-sequencing. Curr. Opin. Genet. Dev., 16, 545–552. 2. Barski,A., Cuddapah,S., Cui,K., Roh,T.Y., Schones,D.E., Wang,Z., Wei,G., Chepelev,I. and Zhao,K. (2007) High-resolution profiling of histone methylations in the human genome. Cell, 129, 823–837. 3. Hafner,M., Landgraf,P., Ludwig,J., Rice,A., Ojo,T., Lin,C., Holoch,D., Lim,C. and Tuschl,T. (2008) Identification of microRNAs and other small regulatory RNAs using cDNA library sequencing. Methods, 44, 3–12. 4. Gilad,Y., Pritchard,J.K. and Thornton,K. (2009) Characterizing natural variation using next-generation sequencing technologies. Trends Genet., 25, 463–471. 5. Wang,Z., Gerstein,M. and Snyder,M. (2009) RNA-seq: a revolutionary tool for transcriptomics. Nat. Rev. Genet., 10, 57–63. 6. Park,P.J. (2009) ChIP-seq: advantages and challenges of a maturing technology. Nat. Rev. Genet., 10, 669–680. 7. Lister,R. and Ecker,J.R. (2009) Finding the fifth base: genome-wide sequencing of cytosine methylation. Genome Res., 19, 959–966. 8. Li,R., Li,Y., Kristiansen,K. and Wang,J. (2008) SOAP: short oligonucleotide alignment program. Bioinformatics, 24, 713–714. 9. Smith,A.D., Xuan,Z. and Zhang,M.Q. (2008) Using quality scores and longer reads improves accuracy of solexa read mapping. BMC Bioinformatics, 9, 128–128. 10. Lin,H., Zhang,Z., Zhang,M.Q., Ma,B. and Li,M. (2008) ZOOM! Zillions of oligos mapped. Bioinformatics, 24, 2431–2437. 11. Li,H., Ruan,J. and Durbin,R. (2008) Mapping short DNA sequencing reads and calling variants using mapping quality scores. Genome Res., 18, 1851–1858. 12. Rumble,S.M., Lacroute,P., Dalca,A.V., Fiume,M., Sidow,A. and Brudno,M. (2009) SHRiMP: accurate mapping of short color-space reads. PLoS Comput. Biol., 5, e1000386. 13. Langmead,B., Trapnell,C., Pop,M. and Salzberg,S.L. (2009) Ultrafast and memory-efficient alignment of short DNA sequences to the human genome. Genome Biol., 10, R25.
W748 Nucleic Acids Research, 2010, Vol. 38, Web Server issue
14. Huang,W. and Marth,G. (2008) EagleView: a genome assembly viewer for next-generation sequencing technologies. Genome Res., 18, 1538–1543. 15. Bao,H., Guo,H., Wang,J., Zhou,R., Lu,X. and Shi,S. (2009) MapView: visualization of short reads alignment on a desktop computer. Bioinformatics, 25, 1554–1555. 16. Arner,E., Hayashizaki,Y. and Daub,C.O. (2010) NGSView: an extensible open source editor for next-generation sequencing data. Bioinformatics, 26, 125–126. 17. Milne,I., Bayer,M., Cardle,L., Shaw,P., Stephen,G., Wright,F. and Marshall,D. (2010) Tablet–next generation sequence assembly visualization. Bioinformatics, 26, 401–402.
18. Giardine,B., Riemer,C., Hardison,R.C., Burhans,R., Elnitski,L., Shah,P., Zhang,Y., Blankenberg,D., Albert,I., Taylor,J. et al. (2005) Galaxy: a platform for interactive large-scale genome analysis. Genome Res., 15, 1451–1455. 19. Li,H. and Durbin,R. (2009) Fast and accurate short read alignment with Burrows-Wheeler transform. Bioinformatics, 25, 1754–1760. 20. Ossowski,S., Schneeberger,K., Clark,R.M., Lanz,C., Warthmann,N. and Weigel,D. (2008) Sequencing of natural strains of Arabidopsis thaliana with short reads. Genome Res., 18, 2024–2033.