for monitoring advanced agile military aircraft due to the variations in missions ..... WRBM response produced a bi-linear ratio between the positive and negative ...
A UNIFIED APPROACH TO FATIGUE USAGE MONITORING OF FIGHTER AIRCRAFT BASED ON F/A-18 EXPERIENCE L. Molent Defence Science and Technology Organisation Aeronautical and Maritime Research Laboratory P.O. Box 4331, Melbourne Australia 3001 ICAS98 Melbourne Australia 13-18 Sept 1998
this requirement is mandated by the appropriate design regulations (eg.):
Abstract. In the current environment of decreasing budgets, the need for an accurate and reliable fatigue usage monitoring system is of ever increasing importance to ensure the safe and economical utilisation of aircraft which are expected to last longer than ever before. Strain based in-flight data recorders are perceived to provide an increase in accuracy over the traditional fatigue g meter, and have thus been implemented by many military fleet operators worldwide particularly for agile aircraft. Although this may be the case, these new generation recorders and the systems required for fatigue damage interpretation are complex, and many problems are associated with their use.
Def Stan 00-970, “…each aeroplane should be fitted with a compact, robust and reliable recording instrument which monitors the usage of the major structural components. This may record an indirect parameter such as normal acceleration, or a direct parameter such as strain for each component to be monitored. Each parameter should be chosen so that the most damaging loading actions on the component can be determined”(1). MIL-A-87221, “….An airborne data acquisition system is required that collects and stores flight data which can be used to determine maintenance and inspection intervals….. The data acquisition system shall be capable of recording operational usage data and shall be compatible with the airframe and all air vehicle systems when installed and used. The system shall interface with the air vehicle systems and record the required data within required accuracies”(2).
Military design requirements mandate the incorporation of fatigue monitoring data recorders, however the specifications allow much scope in the implementation of the system and interpretation of the data. Therefore, there exist numerous and varied philosophies for the usage monitoring of aircraft worldwide. This paper proposes a unified approach for fatigue usage monitoring of modern fighter aircraft and is based on experience primarily with the F/A-18, and discusses the requirements for future fatigue monitoring systems based on strain and flight parameter measurements. Areas covered include the choice of gauge locations, need for flight parameters, data collection rates, calibration of damage models to durability tests, reliability of strain sensors, data integrity, and the in-flight calibration of strain sensors. The review also addresses the significance of each step in the fatigue damage calculation procedure.
Both these typical requirements specify the need for a data recording system, albeit with differing emphasis, but they allow much scope for the implementation of the systems and interpretation of the data. A limited review of open literature has found many examples(eg. 3,4,5,6) of the implementation of usage monitoring hardware, but there is an obvious lack of reporting on the details of the philosophy intended for selection of the hardware requirements and the utilisation of the collected data. It is therefore not surprising that numerous and varying philosophies are used by various operators to monitor accumulation of fatigue damage for individual aircraft types.
Introduction With the increasing complexity, structural optimisation, utilisation and cost of advanced performance military aircraft, coupled with ever decreasing budgets, the effectiveness and reliability of systems used to ensure the structural integrity or airworthiness of the weapon systems are more important than ever.
In light of the above contentions, this paper is intended to propose a unified philosophy and highlight problems to be overcome in achieving a reliable monitoring system for primary load carrying (safety of flight) members. The author has drawn from his experience, primarily with the Royal Australian Air Force’s (RAAF) F/A-18 and F-111 operational monitoring systems, and
As has been the convention for some time, military aircraft will continue to be procured with incorporated in-service (or fatigue) usage monitoring systems. In fact
1
elaborates on some preliminary thoughts on this subject(7).
Table 1: Monitoring Techniques Advantages Disadvantages 1. Flight Hours • Assumes each aircraft • No equipment flies identical spectrum needed • Manual time recording • Cheap 2. Landing/Flight Counts • Simple/Cheap • As above • Only applicable to landing and pressurised structure 3. Counting Accelerometers (Nz Based) • Only components • Simple/Cheap affected by Nz can be • Robust monitored • Nz normally recorded at a nominal CG location • Asymmetrical loads not considered • Fixed Nz “trigger” levels • Time history lost • Weight and PITS must be assumed (conservative) • Transfer function between Nz and stress at critical location required • Manual extraction of data 4. Range Pair Counters (Strain based) • Time history lost • Relatively cheap • PITS must be assumed • Directly monitors principal • Difficult to validate data component • Reliability of sensors • Some data • Sensor calibration processing difficult conducted on-board 5. Multi-Channel Recorders (Parametric Systems) • Expensive and normally • Can monitor flight production fitted parameters as well as strain (very • Software and processing accurate) intensive • Time history • Sensors require retained calibration • Can be used for • Reliability of sensors other investigations • Data validation needed (incidents, overstressing) 6. Optical Fibre Strain Monitoring(5) • Developmental • Insensitive to electro- magnetic interference • Replaces strain gauges - improved reliability • High strain resolution
In Service Monitoring Objectives The minimum objectives of a service usage monitoring system are considered to be to: 1. enable the safe fatigue life or inspection intervals to be determined for individual aircraft by: a) accumulating fleet and Squadron usage statistics, in terms of mission type severity, Point In The Sky (PITS - velocity, normal acceleration and altitude) utilisation, stores utilisation and sensor status; b) tracking individual aircraft damage accumulation against design loads, or more importantly against fatigue substantiation tests; 2. accumulate operational statistics to assist in the design or acquisition of new assets, or defining variation to operational roles to decrease fatigue damage; 3. determine when maintenance action is required for individual aircraft; 4. account for increases in operational weight during the life of the airframe; and 5. provide feedback to the operators on a timely basis. It is also possible to reproduce in-flight loading from usage monitoring systems for the conduct of fatigue tests, as has been done for F/A-18(8). The role of a fatigue monitoring system should be to minimise the impact of usage variations on the operational readiness of the fleet, flight safety and through life cycle costs. Its implementation should ensure a system which enables the estimation of fatigue accumulation on a scientifically robust basis so as to be as accurate as possible. The methodology should be applicable to a sample of fleet aircraft (“operational loads monitoring”) or to each aircraft in the fleet, dependant upon fleet size and operator requirements. Fatigue Usage Monitoring Tools Current fatigue usage monitoring techniques are summarised in Table 1, along with their perceived advantages and disadvantages. Flight hour and flight cycle counting are inappropriate for monitoring advanced agile military aircraft due to the variations in missions performed and configurations between aircraft.
2
can also provide an alternative monitoring capability. The resulting systems required for accurate fatigue damage interpretation are complex. Many problems can arise with their use, and some of these are addressed in this paper. The first issue to consider is that of gauge placement.
Strain based in-flight data recorders are perceived to provide an increase in accuracy over the conventional fatigue Nz or g (normal acceleration) meter, and have thus been implemented worldwide by many military fleet operators, for high performance aircraft. This increased accuracy is principally achieved because judicious placement of the strain gauges can automatically account for both aircraft weight and stores effects, and the variation of principal loads, such as Wing Root Bending Moment (WRBM), at various PITS constituting the flight envelope. For example, a comparison of (WRBM) strain and Nz fatigue damage, using the same damage model, was conducted for a fleet of F/A-18 aircraft(9). The transfer function relating Nz to the critical location was chosen to represent average PITS. This investigation revealed that the damage calculated from Nz data was conservative, in general by a factor of approximately two. Although this does not imply which data set produces the most accurate estimate of fatigue damage, it does indicate the level of difference achieved in analysing the two data sets.
Loads or “Hot Spot” Via Strain Monitoring. Before deciding on the locations of strain gauges, the philosophy to be used to meaningfully relate the strain recordings to fatigue accumulation must be established. The choice of gauge locations are determined from the following considerations: Loads Monitoring. Judicious placement of the strain gauges can account for aircraft weight and stores effects, and the variation of principal loads, such as WRBM, at various PITS constituting the flight envelope. Thus the location of the strain gauge must be such that its response is predominantly influenced by the principal loading inducing the fatigue damage at the critical locations considered. An example of such a philosophy is the F/A-18 (7, 9, 12).
Further, for agile aircraft with significant fuselage lift contributions, the maximum WRBM may not correspond to the maximum Nz(9). It was shown for the F/A-18 that the two maxima can lag one other by as much as 2 seconds. Systems in modern military high performance aircraft that rely solely on Nz would experience a similar discrepancy. Counting accelerometer data is normally augmented by pilot sheets containing mission and stores data which are assumed to apply for an entire flight. Although this represents an increase in accuracy, considerable processing is required to arrive at a damage estimate.
To achieve this benefit the location of the gauges must be carefully chosen. In particular, care must be taken to ensure that the location of the sensor: • can be calibrated to the damage inducing load; • is dominated by the principal load (e.g. WRBM) and insensitive to other loading actions; • is in an area of low stress gradient; • can be directly related† to the stress at critical structural locations; • is not prone to gauge “drift” (varying response to a nominal load over time‡, discussed later); • is accessible for ready sensors replacement; • is positioned as close as practicable to a backup sensor in the advent that the primary sensors fails; • is replicated on the fatigue test article so that direct comparisons can be made(1); and • is protected from the environment and service wear.
Strain range pair data counters have the advantage of a limited capability of on-board data processing, thus lessening the amount of data storage and processing required once the data is extracted from the aircraft. These systems were introduced in times when data storage limitations and data processing time were significant considerations. However, modern computers have alleviated these considerations to a large extent. Further, difficulties with validating data in a tabular range pair format, with the absence of associated flight parameters(10), and determining strain gauge calibration factors(11) (described later) are considered to outweigh the potential advantages of range pair counters. Therefore these are not considered further in this paper.
Hot Spot Monitoring. The alternative philosophy is intended to place strain gauges such that they directly monitor the strain at the critical location. An example of such a philosophy is the RAAF’s F-111(13,14). Several problems can arise from this philosophy, namely: • the sensor may not be dominated by the principal damage inducing load. A particular problem here is
As optical fibre strain monitoring is currently only developmental, its use is not considered in this paper. For the above reasons strain peak and valley based systems are addressed in this paper. However it will be shown that parametric based techniques have a significant role to play in a strain based system and these
†
Preferably by a linear relationship for both positive and negative loads. ‡ F/A-18 WR lugs are an example of this.
3
fleet monitoring is being calibrated. The unified approach proposed in this paper uses the strain based approach as the major fatigue tracking system complimented by parametric flight data measurements to aid in data verification. The following sections provide details of an optimised strain based system and indicates areas where parametric data are used.
that it may be difficult to calibrate the sensor response; • the hot spot may have a high stress gradient. Due to the fixed active length of a strain gauge and positioning errors, there is no guarantee that the maximum strain is actually monitored; • if a new hot spot arises, and the gauge does not respond predominantly to the load affecting this new location, then there will be no data available for assessment. Even if the option of placing an additional gauge exists, the problem of “filling-in” for past damage still exists; and • the hot spot may not be readily accessible and thus the sensors are not readily replaceable.
Components of a Strain Based Fatigue Tracking System Once the type of in-flight recorder§, the position of strain gauges, and the flight parameters to be recorded have been determined and installed for a given aircraft type, there is still much processing to be conducted before the in-flight data can be used to assess the fatigue usage of an aircraft. After data retrieval a fatigue tracking system requires the following capabilities:
For these reasons direct hot spot monitoring will not be further pursued in this paper.
1. Pre-Processing of Collected Data:
Parameter Based Monitoring.
Generally, a code is required to format aircraft unique data so that it can be processed. It should provide the capability to identify the aircraft (tail number) and active sensors, missing sensor initialisation and determine data hours (generally from landing and take off codes). It should also provide an option to deal with data recorded out of order.
An alternative philosophy to the strain gauge methods is the use of flight parameters to estimate the dominant load affecting each critical component, and the subsequent use of transfer functions to relate this to stresses at critical locations. This approach has similar advantages to the strain monitoring philosophy, and further: • as there are no strain gauges, the logistical burden of replacing unserviceable gauges is not a issue. The RAAF have experienced significant numbers of gauge changes on their F/A-18 fleet(15). The time lag between when a sensor becomes unserviceable and when remedial action is taken, contributes to reductions in the over-all data recovery rates; • there is no requirement to calibrate sensors or loads on the fleet aircraft, as the calculated load is normally derived from a calibrated flight test aircraft which demonstrates the “baseline” response for fleet analysis.
2. Data Checking Module, which should provide, as a minimum, the following functions: • Extract strain, flight parameter and Nz data; • Validate data and replace bad data by using flight parameters relationships; • Compensate for missing data; • Perform sensor calibration; • Determine inoperative sensors (by comparing recorded against parametric based strain) and create a sensor log; • Calculate CG and weight of aircraft accounting for stores configuration and fuel usage; • Normalise weight (to test article basic configuration); • Initialise other flight parameter variables (e.g. angle of attack - α); • Tabulate VGH exceedance data; and • Identify mission types.
However, comprehensive flights trials are required to obtain sufficient loads data to cover all aircraft operations PITS if the aircraft is monitored solely on parameters. Analyses conducted using multiple parametric equations(16) and Velocity-normal acceleration (G)Height (VGH) techniques(9) produced conservative results within 5% and 1% for these respectively when compared to the results based on (WRBM induced) strain for one particular usage spectrum.
3. Sequence Counting Module: The module may be required to build a Rain Flow Counted** (RFC) strain spectrum. Depending on
This suggests that reasonable accuracy can be achieved using parameters only. However, the major advantage of a strain based system over parameter based systems is that the strain can be related directly to strain measurements on the fatigue test article against which the
§
With the capability to record the recommended flight parameters and strains at the required rates. ** Otherwise known as range-pair or hysteresis loop counting.
4
• Strain and flight parameter data on the DRS should be down loaded periodically from the aircraft, and appended with data from the pilot data sheets. The DRS should record mission time (or “weight off wheels” (WOW) time), however when reporting to the fleet, pilot flight time is more appropriate. It is normal for WOW time to differ from pilot flight time(9), as pilots will account for some pre- and postflight time. • The strain data from each strain sensor should be initialised at the beginning of each flight by first removing any strain offset, so that each sensor ostensibly reads zero when wing flight loads are zero. This process should take into account possible different configurations of wing stores (weights) at take off. • Because the response sensitivity of strain sensors varies between aircraft (discussed later), the strain data should then be calibrated so that the same wing load reference condition on each aircraft produces the same strain sensor value. This calibration can be performed using parametric data from the DRS. This takes account of varying sensor sensitivities and any drift in gauge response which may have occurred with time. • The strain data should be checked by comparing the measured strains with strain predicted from other sources, such as parametric equations relating strain to Nz and other flight parameters. Flight parameters should also be checked against reasonable aircraft performance limitations. Any data deemed to exceed set error limits, or any missing data, are replaced using data “fill-in” techniques. • The strain data are then normalised with respect to the relevant fatigue test measurements by dividing (or normalising) by the reference strain value which is obtained from applying the reference WRBM loading condition to the appropriate fatigue test structure being used as the data reference. This effectively converts recorded strain into a nondimensional WRBM sequence. • The resulting normalised non-dimensional sequence is then sorted into a sequential peak valley form, before it is RFC (to form cycles of maximum peaks and valleys for fatigue analysis), and possibly discretised into pre-defined levels and stored for further processing. The latter may be done in order to reduce the processing time, however inaccuracies may be introduced due to the use of limited fixed range levels. • The normalised cycle-counted data are then multiplied by a reference stress related to the reference load which converts the data into stresses at the critical location at which fatigue damage is to be calculated. This reference stress value has been chosen using the fatigue life/crack growth prediction routine, such that at the chosen reference stress level,
computing capability it may also discretise and block the sequence to optimise processing time. 4. Fatigue Damage Module, which; Calculates damage and fatigue indices for each critical location, based on crack initiation or growth algorithms calibrated against the appropriate durability test. It should also update the cumulative “all time” damage database for each aircraft, and check if the accumulated damage equals target values, and warn if the damage rate exceeds a predefined design rate. 5. Post-Processor Module, which; Updates the database file for each aircraft processed, and the documentation file of the current software run. Produces a summary report, which includes all detected data anomalies and usage statistics. 6. Reporting to Fleet The results must be interpreted and provided to the operator in a timely fashion. This is essential for proactive fleet fatigue management. Each of these nominated steps are critical to the fatigue monitoring of the fleet. It should be stressed that the through life cost of maintaining the above ground based system far exceeds the cost of the on-board data recorder(17), and thus should be given appropriate consideration before the particular hardware and integrated processing system is chosen. Some of the more important issues identified above are discussed in detail in the following sections. Interpreting and Processing Measured Strain The following is a proposed procedure for utilising recorded strain to monitor a critical location, based on developments to the F/A-18 monitoring philosophy(9), using WRBM induced strain as an example. Here a gauge has been placed close to the Wing Root (WR) structure and has been demonstrated to respond predominantly to WRBM. • The aircraft’s on board Data Recording System (DRS) should record WR strain when a peak or valley of WR strain is identified by the DRS. This is done to minimise data storage, yet assures that maximum/minimum WR loads are retained. Recording at a peak or valley is referred to as “triggering” and when a sensor is “triggered”, the DRS should records its strain, plus all other sensor strains and the required flight parameters (time synchronised).
5
•
gauge/amplifier sensitivity. Multiple load paths in redundant structure may also cause varying gauge response, where differences between aircraft may be “built-in” before delivery. The latter requires specific attention.
this program will predict the demonstrated test life using the fatigue test spectrum (referred to as model calibration). This reference stress should also be confirmed for representativeness from stress measurements taken from the fatigue test article. The data are finally processed through a fatigue damage prediction model, to calculate the damage or crack growth which has accumulated over the data processing period for each aircraft. The result is a Fatigue Index (FI) which can be related to the amount of damage accumulated by each aircraft to the damage accumulated during certification testing of the full scale fatigue test article (ie Fatigue life Expended Index (FLEI), discussed later).
Great care must be taken when relating the loading from strain measurements from these different airframes. Differences will also arise due to differences in zero strain setting, i.e. 1g level flight or pre-take off ground condition, or due to sensor drift or sensor non-linear response. As it is often impractical to physically ground calibrate every sensor in the fleet, it is normal to rely on in-flight recorded data to relate gauge response between aircraft to the loads on calibrated aircraft. To do this, data recorded at unique PITS which give reproducible values of the principal loading actions are required. For some sensors, namely for gauges on the wing, this is a relatively simple procedure(9).
It should be noted that the above technique alleviates the need to calculate transfer functions between the WR strain gauge location and the critical location. This is because the WR strain has effectively been translated into WRBM, which should have a linear relationship with the critical location. The sequence is then scaled to a stress sequence using the reference stress level for a defined load case.
In other instances, for example vertical and horizontal tails, the calibration process requires more parameters in order to define unique PITS(18, 1920). Thus a monitoring system which records parameters other than strain is essential to enable scaling factors to be determined. In order to obtain robust solutions for these structures on the F/A-18, an order of magnitude increase in the number of data points over that for the wing was required. These parameters should be recorded simultaneously with the strain record. PITS close to symmetrical conditions are required to provide the data, and these are more difficult to define for the tails than for the wing. The task of identifying these data points would be assisted if parameters such as rudder and horizontal tail (HT) deflection, were recorded simultaneously with the sensor strains. This requirement would involve an increase in data storage demands, but the benefits are significant.
As the calculated FI compares an aircraft’s spectrum to a full-scale fatigue test spectrum, and as the aircraft’s spectrum is variable, a constant reference stress is used to relate the two. To compare the damage associated with two strain spectra, a reference load condition must produce the same strain value in both spectra, otherwise any differences in damage calculated between the two spectra may purely be a result of different strain sensor response sensitivities and not due to differences in aircraft usage. Because the location of the WR strain sensor was chosen so that the sensor responds predominantly to WRBM, the reference loading condition specified should be a design WRBM condition. The reference strain value corresponding to this WRBM is obtained by applying the load to the fatigue test article.
Ideally any analytical calibration techniques such as those discussed above should be validated by conducting aircraft ground calibrations on a sample of aircraft prior to routine use(15).
Sensor Calibration The fatigue usage of a military aircraft is normally monitored against the damage accumulated on a fatigue test article. Before the strain sensors can be used to assess an aircraft’s usage, they must be calibrated such that loading derived from these can be related directly to the equivalent load on the fatigue test article. To verify the fatigue test loading the test article gauges may also have been calibrated against the response of a loads development aircraft. Two gauges placed at nominally identical locations, but on different airframes, may produce varying responses to nominally identical loading, due to slight differences in airframe build quality, slight gauge alignment differences, adhesive thickness differences and variations in gauge factors or
Sensor Drift. Compounding the problem of sensor calibration, is the phenomena experienced by some sensors, whose response to specific loads varies over time. This situation is particularly relevant when sensors are placed on lugs (e.g. F/A-18(9)), and is likely to occur in conventional mechanically fastened aircraft structures where gauge response can be affected by local stiffness decrease over time as a function of fastener fretting and hole elongation. For the F/A-18 WR sensor it was noted when comparing the response of the WR sensor at a “reference” WRBM
6
between strain and Nz will not suffice for modern combat aircraft, as loading varies considerably with PITS and configuration, and may not be linear.
over different periods of flying for a given aircraft, that it gave different strain values. It was further noted that the response increased over a period of time until a plateau was reached after which point the response remained constant. This became known as WR “drift”. This behaviour was subsequently confirmed to be a “fleet” problem. It is believed that the phenomenon is a local effect (the WRBM and its distribution have not changed but the sensor is responding differently) and is due to migration and wear of the bushing within the lug (changes in the lug hole bearing stress). This effectively invalidated the calibration values calculated from initial flight data. In turn, the “fatigue life expended” calculated from the WR sensor response was compromised, in many cases conservatively so. Analytical technique were developed to adjust “drifted” strain back to the baseline response(9). Thus the WR strain data must be drift corrected before further processing.
Therefore, alternative techniques such as parametric equations and load trend look-up tables are required. Multiple parameter least squares multiple order equations were developed†† for the F/A-18 sensors(16). The aim of these equations was to predict the strain response of the sensors for a target aircraft to an accuracy of ±5% for all fatigue damaging PITS. It was found that estimated WR strain and thus WRBM achieved this target with relatively few flight parameters, however empennage load estimates could only achieve the required level of accuracy by using many additional parameters‡‡ including (port and starboard): • • • • • •
Sensor Response Bi-linearity. The sensor location should be chosen such that the sensor provides a good representation of the principal loading affecting the fatigue life of the structural components of interest. Subsequently this gauge can be used to monitor specific locations which are affected by the same loading action. However, it must be ascertained that the response relationship between the gauge and the critical locations, influenced by the principle load, is also linear. This may not always be the case as was found for the F/A-18. In investigating the relationship between the WR sensor, which is located on a lug, and a critical bulkhead locations(9), it was determined that the WR strain to WRBM response produced a bi-linear ratio between the positive and negative strain ranges and this was reflected in the relationship between the WR strain and the strain at the critical location on the centre fuselage bulkheads.
As previously mentioned these same parameters are required to calibrate the sensors using in-flight data. Similar levels of accuracy for WRBM can be achieved using VGH and weight loads trend data(9). Again, empennage loads trend data cannot easily be tabulated due to the large number of parameters required. It should be stressed that both these later techniques are only viable if a substantial amount of flight test data is available, covering the full operational PITS and configuration variations of the aircraft. The flight trials results should include all the required synchronous flight parameters§§, strains and primary loads as recorded by in-flight load bridges. Further ground calibration of the sensors to known loads is also required. If this data were not collected during aircraft certification testing, its subsequent production will be at a substantial cost. However, recorded data validity must be assured and therefore developing data checking processes must be given due consideration.
When assessing particular locations this bi-linearity must be accounted for, especially when dealing with spectra which contain a significant number of negative load cycles. Data checking. There are numerous data checks that should be conducted before recorded fleet data can be used with confidence. Examples include: • • • • • •
stabilator deflection, rudder deflection, trailing edge flap deflection, yaw rate, pitch rate, aileron deflection
Sensor health or serviceability Strain spiking Strain initialisation errors Out of range data Missing data Strain data validity
††
MDA also developed a series of equations, and have produced load trend “look up tables” for the WR(12). ‡‡ Many of which are not available on the current DRS at appropriate frequencies. §§ Care must be taken to ensure that the definitions of the parameters are compatible between the flight test and DRS(23).
In general, when validating strain data, the recorded strain is compared to a predicted value that relies on the PITS flight parameters associated with that strain. In general, simple linear relationships, such as those
7
These same data checking processes can also be used to “fill-in” for recorded peaks and valleys that are found to be spurious. When entire flights are missing or the data is spurious, an alternative technique would be to use previously recorded data or calculated damage for the same mission type.
intended for the fleet. Care should also be taken to account for potentially different gauge initialisation conditions between the test article and fleet aircraft (test articles are normally initialised at a zero bending moment condition, whereas fleet aircraft may be initialised at a 1 g on ground condition).
If, as implied, the data checking process can achieve reasonable accuracies in comparison to the recorded strain, as has been demonstrated for WRBM, this begs the question, are strain gauges really required or are parameter only based monitoring systems sufficient?
As one sensor can potentially monitor several critical locations, the model must be able to account for potentially different materials at these locations. This is particularly important for models that account for residual stresses, crack growth retardation or material hysteresis***, since hysteresis is material dependant. It has been demonstrates that hysteresis effects are more marked for titanium than aluminium(9). The choice of material may also produce conflicting predictions of the severity between spectra(7).
Recall, that strain gauges are required on the fatigue test article, at the same location as fleet monitoring gauges to directly calculate the FLEI. Thus fleet strain gauges are considered essential for the monitoring system, in addition to relevant flight parameters. The additional cost of including strain gauges is insignificant in relation to the overall system, and cost savings should be achieved due to the increase in accuracy and system validation. The later can be achieved as, in-addition to providing strain checking, the parametric approach could provide an independent check of the damage calculated from the strain based data(7). Discrepancies between the two calculated damages should be indicative of anomalies in the monitoring system.
Fatigue Index. The final product of any monitoring system should be a number that indicates the fatigue accumulation status or inspection threshold for the airframe. This number is normally††† referred to as the FI. The fatigue life monitoring program implemented for the aircraft should compare the usage of an individual aircraft to that of a representative fatigue test article. As an aircraft is designed and certified to a safe life or damage tolerant philosophy, when the damage accumulated on a particular aircraft matches that calculated to have been imparted to the test article at the completion of testing, with appropriate scatter factors applied, the aircraft is said to have consumed its safe life or reached an inspection threshold. The duration of all fatigue tests incorporate an appropriate scatter factor on design life which depends on the design specifications.
Point in the Sky Variability. As already noted, significant PITS load variability(7,9) can be expected for highly agile aircraft, and this is further affected by adaptive control systems. In the proposed methodology discussed earlier, the recorded strain is normalised by a reference strain effectively converting it to bending moment. One possible source of inaccuracy here, is the use of one reference strain for all data PITS recorded. As it is considered impractical to normalise each strain peak and valley by the appropriate PITS specific reference strain, the effect of this simplification should be assessed before implementing the system. A reference load condition representative of the most common fleet operational PITS should be investigated.
The test substantiated fatigue life is therefore the FI. At full test life the total damage = FI =1.0.
damage accrued on fatigue FI = ∑ = 1.0 test article at demonstrated life
Damage Model Calibration. The model used to estimate fatigue damage accumulation should be calibrated against the appropriate fatigue test. It should be demonstrated that the model can accurately predict detected cracks and their growth. Further, it is essential to demonstrate that the model can scale accurately between spectra of varying severity (as per the usage spread throughout the fleet). This may require a coupon fatigue test program(9).
Therefore a FLEI is defined as:
***
Material hysteresis models can also be used for RFC systems, as long as the data is collected on a flight by flight basis, as sequence effects within a flight are not considered significant. ††† Several countries use this terminology (regardless of individual monitoring philosophy) as indicated in the (many) Minutes of International Committee on Aeronautical Fatigue (ICAF) Conferences.
As strain data is used to assess the fleet, the model should be calibrated using the strain data recorded from the fatigue test article. As processing variations can have a significant effect on the models accuracy(7, 9), the model should be calibrated using the same processing steps
8
calculated damage accrued on aircraft FLEI = ∑ x SF at current life ( flight hours )
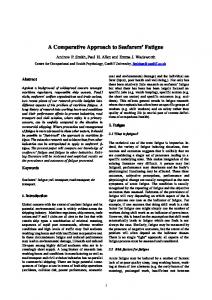
fatigue monitoring a strain gauge was positioned on one stub frame per side as indicated in Figure 1. A ground calibration of the usage monitoring strain gauges was recently completed for several RAAF F/A-18s(15). Here the response of the sensors were recorded against applied component bending moment. A sample of the results (for the gauge locations indicated in Figure 1) are presented in Table 2.
where: SF Σ
scatter factor applied by the fleet operator cumulative sum (using same damage algorithm)
When the FLEI = FI the demonstrated life has been expended and action must be taken. The FI rate should also be calculated to allow the fleet manager to project forward to anticipate maintenance action or to take steps (modify operational usage etc.) to ensure planned withdrawal date for the asset. Empennage Monitoring The above processes as described for the wing, are also applicable to the empennage if it can be demonstrated that the principal load can be translated reliably to the stress at critical locations on the empennage or its substructure. Traditionally empennage monitoring has been given secondary consideration to that of the wing. However with greater structural optimisation in modern aircraft, there is no reason why the empennage should not be as fatigue critical as the wing. Apart from the difficulties due to the number of required parameters mentioned above, there are further difficulties to overcome in achieving a reliable and accurate empennage monitoring system. These are:
Figure 1: A Sample of F/A-18 Strain Gauge Locations Table 2: Calibration Results Strain Response [µ µε/in.kip] HT
• Structural Redundancy • Aerodynamic Buffeting Structural Redundancy. As previously mentioned, one of the factors that influences a strain gauge’s response is structural redundancy. In the case where multiple loads paths exist, variations in sensor strain response between aircraft may be indicative of load distribution variations between these paths, in addition to other factors which affect sensor sensitivity. If this is the case, then gauge calibrations need to be treated with caution. The gauge/s can still be calibrated to the predominant load, however this load may not be accurately translated to stress at a critical location away from the gauge location, due to the possible significant load distribution variation in this structural component as experienced throughout the fleet. To illustrate this, consider the structure of the Vertical Tail (VT) attachment of the F/A-18, shown in Figure 1.
VT
A/C No.
LH WF
FS651 RH
FS651 LH
FS598 RH
FS598 LH
1
2.225
3.653
3.793
2.063
2.385
2
2.277
—
3.871
1.711
2.030
3
2.317
3.980
4.073
2.514
2.528
4
2.153
4.024
3.609
2.461
2.398
5
2.262
3.914
—
1.855
2.025
6
2.289
3.873
3.705
2.048
2.621
7
2.342
3.858
4.037
2.103
2.040
8
2.212
3.957
3.953
1.955
2.248
9
2.281
3.718
3.796
2.043
1.982
10
2.478
3.977
3.938
1.986
2.065
11
—
3.830
3.926
1.907
2.089
It can be seen from Table 2 that the greatest response variation occurs for the VT gauges. This is the case for both left to right VT and inter-aircraft VT comparisons. Although variations do exist for the HT gauges (note single load path) and the wing fold (WF) gauges (placed
Each VT has six spars which are attached to six bulkheads via stub frame splices. For the purposes of
9
on the skin close to multiple lug attachments), these may be explained by normal gauge variation differences. The large variations seen in the VT gauges (maximum interaircraft difference here was 35%) is considered attributable to load path variations.
However, the statistically non-stationary nature of the dynamic response for a given α-Q combination and variations in structural response between various aircraft make this methodology unreliable(23). Significant variations in dynamic response have been observed for the VT of the F/A-18.
Although it was demonstrated that torsion did not significantly affect the VT gauge response(15), it was shown that by applying the same effective VT bending moment and torsion but using both a “point” and a distributed loading on two aircraft, lead to a 12% strain response variation(15). This further suggests that the VT strain response variation was due to load distribution variation between the stub frames.
Therefore it is considered that monitoring structure affected by buffet is a challenging proposal. Conclusions This paper presents a preliminary overview of a unified philosophy for the implementation of a robust and accurate individual aircraft fatigue life usage monitoring system for modern fighter military aircraft.
With variations of the magnitude demonstrated above (and possibly larger fleet wide), then the danger in translating VT bending moment to critical point stress can be seen.
In summary, a system is required which utilises both strain gauges and flight parameters recorded synchronously. The strain gauge locations are chosen such that their response can be demonstrated to be affected predominantly by the principal load inducing fatigue damage for each relevant flight component. The strain readings can then be related directly to the stresses at critical locations without the specific need for complex transfer functions. Finally, fatigue damage is calculated and directly related to that demonstrated on the fatigue substantiation test.
Aerodynamic Buffeting. The phenomenon of aerodynamic buffet is common on highly agile aircraft. This buffeting can be caused by the break down of aerodynamic vortices from leading edge surfaces impinging on control surfaces(8, 21). This buffeting can excite the dynamic modes of these control surfaces and subsequently significantly degrade the fatigue performance of their structures. The assessment of the buffet loads poses significant problems for the usage monitoring system. Firstly, the dynamic response of the structure may be at high frequency, and secondly, multiple modes may be excited. In the case of the F/A-18 VT, two modes are considered fatigue damaging, namely the first bending mode (15 Hz) and the first torsion mode (45 Hz) (8).
The system should record the necessary flight parameters such that analytical calibration of the strain sensors against the response demonstrated by the fatigue test article can be achieved. Further, these parameters can then provide the capability to “fill-in” for missing or corrupted strain data, and provide an independent means of validating the recorded strain data.
If strain gauges are to be considered for assessing the buffet damage, then the DRS must be capable of recording and storing data at significantly high frequencies. In addition to possible structural redundancy difficulties, the placement of gauges is further complicated because both dynamic bending and torsion mode responses may need to be captured (in-addition to the manoeuvre component) to properly account for all significant loadings.
It has been demonstrated that empennage usage monitoring presents specific problems which still need to be addressed. These include the number of flight parameters required for sensor calibration, the effect of load distribution variations in redundant structure and accounting for the effect of aerodynamic buffeting. In the current environment of decreasing budgets, the need for an accurate and reliable fatigue usage monitoring system is of ever increasing importance to ensure the safe and economical utilisation of aircraft. The through life cost of the entire monitoring system far exceeds the initial cost of implementing the recording instruments, therefore due consideration to the monitoring philosophy to be adopted should be given early in the acquisition cycle. This should ensure that the cost of the fatigue monitoring system is optimised to deliver more accurate and cost effective data for the safe and economical utilisation of the platform. The proposed philosophy is directed at this goal, and at
Alternative parametric based approaches have also been shown to be problematic. As it had been shown that buffet severity was proportional to α and dynamic pressure (Q)(8), it was proposed that the F/A-18 buffet induced damage be assessed by monitoring aircraft time spent at pre-defined α and Q regimes(22). For each α-Q combination considered, dynamic flight data is required for critical points under consideration. These data are in the form of a sample of strain peaks and valleys for each α-Q combination.
10
reducing the differences in philosophies currently used worldwide.
11
Acknowledgments 12
The author wishes to acknowledge the individual contributions of the colleagues whose efforts contributed to this paper, namely members of: the RAAF Aircraft Structural Integrity Section, DSTO’s F/A-18 Life Assessment Task and IFOSTP.
13
References 1
2
3
4
5
6
7
8
9
10
14
“Fatigue Damage Tolerance Service Monitoring”, Leaflet 201/6, Def Stan 00-970, Vol 1, Oct 1987 (Amdt 6). “Aircraft Structures, General Specifications for the Design”, MIL SPEC MIL-A-87221 (USAF), Appendix, 28 Feb 1985. J.M.H. Barnard and F.H. Hooke, “General Procedure for Fatigue Life Assessment of an Aeroplane”, Struc. and Mat. Note 273, Aeronautical Research Laboratory, Aust., Nov 1961. D.J. Spiekout, “New Developments in the Fatigue Management of the F-16 Aircraft of the RNLAF”, proc. USAF Structural Integrity Program Conference, San Antonio, Texas, USA, 1-3 Dec 1992. F.A. Blaha and Capt. L. Grenier, “A Fibre-Optic Loads Monitoring System for the CL-600 Challenger Aircraft”, proc. USAF Structural Integrity Program Conference, San Antonio, Texas, USA, 6-8 Dec 1994. A.F. Blom and H. Ansell, “Fatigue Management and Verification of Airframes”, ICAF-DOC-1961. Molent, L., “A Review of a Strain and Flight Parameter Data Based Aircraft Fatigue Usage Monitoring System”, proc of USAF Structural Integrity Program Conference, San Antonio, TX, 3-5 Dec 1996 D. Graham, D. Symons, D. Sherman and T. Eames, “ARL F/A-18 IFOSTP Full Scale Fatigue Test”, Proc. 5th Australian Aeronautical Conference, Melbourne, Aust., 13-15 Sept. 1993. “Review of RAAF F/A-18 “Structural Appraisal of Fatigue Effects” (SAFE) Version 112, Volume 1: Detailed Review”, L. Molent and R. Ogden (editors), DSTO-TR-0381, Aust. Jan 1998. K. Walker and L. Molent, “Corrtest: A Computer Program for Correlating and Validating Separate But Related Sets of Fatigue Data in Range Mean Pair Form”, proc. of ICAF Conference, Melbourne, 3-5 May 1995.
15
16
17
18
19
20
21
22
23
11
B. Aktepe and R. Ogden, “A Comparison of Strain Measurements from the ‘AFDAS’ and ‘MSDRS’ Monitoring Systems Using RAAF F/A-18 Operational Flight Data”, DSTO-TR-0640, Aust. Apr 1998. P. S. Adams, G.S. Keys II, R.E. Schutte and D.J. Smith , F/A-18 Hornet Structural Appraisal of Fatigue Effects (SAFE) Software Manual - Final Report. MDC B2027, McDonnell Aircraft, USA, October 1990. K. Walker, “F111 Aircraft Fatigue Data Analysis System (AFDAS) in Service Development Progress Report Number One”, DSTO-TR-0118, Aust., Jul 1995. “F-111C Service Life Monitoring Program, Basic Data for Airframe Control Points”, General Dynamics, FZS-12-5018, Ft. Worth, TX, USA, 1 Sept 1979. B. Aktepe, K. Hewitt, R. Ogden and L. Molent, “Ground Calibration of RAAF F/A-18 Onboard Fatigue Strain Sensors”, DSTO-TR-0641, Aust., Apr 1998. L. Molent, F. Polanco, R. Ogden, and Y. Guan Ooi, “Development of Parametric Strain Equations for Fatigue Sensors on the RAAF F/A18”, DSTO-TR-0140, Aust., Jan 1995. R.E. Pinckert and R.A. Scheidter, “Improved Fatigue Life Tracking Procedures for Navy Aircraft Structures - Phase II - Final Report”, Rep. No. NADC-77194-60, McDonnell Aircraft Company, St. Louis, USA, Nov. 1981. L. Molent, R.W. Ogden, and Y. Guan Ooi, “Development of Analytical Techniques for Calibration of F/A-18 Horizontal Stabilator and Wing Fold Strain Sensors”, DSTO-TR-0205, Aust., Aug 95. G. Habermann and D. Graham, “Calibration of F/A-18 Empennage Strain Gauges from MSDRS Fatigue Records”, DSTO-TR-0585, Oct 1997. Y. Guan Ooi, R.W. Ogden, and L. Molent, “Validation of an Analytical Technique for Scaling of F/A-18 Vertical Tail strain Sensors”, DSTOTR-0539, Aust., Jun 1997. M.A. Ferman, S.L. Liguore, C.M. Smith and B.J. Colvin, “Composite ‘Exoskin’ Doubler Extends F15 Vertical Tail Fatigue Life”, proc. 34th AIAA Structures, Structural Dynamics and Materials Conf., La Jolla, CA, USA, 1993. D.P. Conser and G.S. Keys, “F/A-18 Production ASPJ Vertical Tail Dynamic Fatigue Test Spectra Development”, MDC 91B0424, McDonnell Douglas Aerospace, USA, 9 Jan 1992. P. Chapman, K. Hewitt and L. Molent, “A Critical Review of the F/A-18 Vertical Tail Fatigue Tracking Process”, DSTO-TR-0642, Aust., Apr 1998.