The Employment Impact of Cleaner Production on the Firm Level Empirical Evidence from a Survey in Five European Countries
KLAUS RENNINGS AND THOMAS ZWICK CENTRE FOR EUROPEAN ECONOMIC RESEARCH (ZEW) MANNHEIM, MARCH 2001 eMail:
[email protected],
[email protected] Abstract This paper analyses the determinants of employment reactions of firms when environmental innovations have been carried out. It differentiates hereby between employment increases and decreases. The data stem from a telephone survey covering more than 1500 firms in five European countries that have introduced environmental innovations recently. Environmentally beneficial product and service innovations create jobs in contrast to process innovations. Employment changes occur in the wake of major innovations only and especially in small firms and firms with positive sales expectations. While innovations purely motivated by environmental goals tend not to have employment effects, cost reductions envisaged by environmental innovations reduce employment. We detect skill biased technological change of environmental innovations. Environmental innovations have a small but positive effect on employment on the firm level. Thus, environmental support programmes do not counteract labour market policy. A further shift from end-of-pipe technologies to cleaner production, especially towards product and service innovations, would be beneficial for the environment and creates jobs. Key words: Environmental technologies, cleaner production, innovation, labour demand JEL classification: Q 50, J 23, O 33
1. Introduction The impact of innovations on employment has been analysed empirically in several studies over the past years (see e.g. Pfeiffer und Rennings, 2001; König, 1997; König et al., 1995; Smolny and Schneeweis, 1999; Rottmann and Ruschinski, 1998, Brouwer et al., 1993, Van Reenen, 1997). The studies have tested the hypotheses that: • Product innovations have a positive impact on employment since they create new demand. Negative indirect effects occur if sales of other products decrease (substitution effect) or if prices increase due to the new product (income effect). • Process innovations increase the productivity of firms and have a negative direct impact on employment since they are normally labour-saving investments. A negative direct effect can be compensated by positive indirect effects, if the sales of a firm increase due to lower prices. The fear that technical progress in general and process innovations in particular kill jobs has not been confirmed by the empirical data. Although the results of individual studies varie, the tendency is that innovation has a positive effect on employment and more jobs are created by product than by process innovations. Nevertheless individual studies found negative employment effects of process innovations (survey in König 1997). Empirical research in this area encounters some methodological problems. First, when innovations are measured it is generally difficult to distinguish clearly between product and process innovations. New products often need new processes, while new processes often change characteristics of a good or service. Such interdependencies between product and process innovations are not reflected in survey data which are used in microeconomic studies. Thus the results give only a simplified picture of complex innovation processes. Secondly, surveys on the firm level measure mainly direct effects. Interpretations thus have to keep in mind that indirect effects are, if at all, only partly included. In the political debate, increasing attention is drawn to the question of how ecological transformation towards cleaner production affects the economic 2
performance of industries, especially concerning employment. Views about the direction of these impacts are highly controversial. A popular hypothesis is that lower inputs of natural resources in the production process due to improved ecoefficiency require higher labour inputs and thus lead to positive employment effects (Ritt 1999, p. 26). This view is expressed in the slogan: „Make kilowatthours unemployed, not people“. However, this position is contradicted by observations over the past decades that innovation improves both energy and labour productivity and therefore replaces labour. Further, it is often argued that environmental protection measures are a cost burden for domestic firms and thus weaken their competitiveness on international markets. Within the empirical literature on employment impacts of innovation, only few studies have specifically analysed innovations which are environmentally beneficial. Pfeiffer and Rennings (2001) conducted an industry survey of environmentally oriented firms in Germany, in Austria Kosz (1997) investigated firms being involved in environmental programmes and Köppl and Pichl (1997) analysed data from the Austrian innovation panel. All three studies found that employment impacts of environmental innovations were positive but very small. In the German survey, 84 to 91 percent of the firms stated that environmental innovations have no notable effect on firm-level employment (numbers differ slightly across categories of innovations). When there were employment changes, the positive ones outnumbered the negative ones. In this paper, we analyse the direct employment effect of environmentally beneficial innovations on the firm level on the basis of data from the European project IMPRESS1: 1594 telephone interviews with industry and service firms were realised in five European countries (Germany, United Kingdom, Italy, Netherlands, Switzerland). The data bank created on the basis of the interviews is unique concerning the possibility of econometric analysis of the relationship between environmental innovation and employment. The paper is structured as follows. In section 2, we present our conceptual approach, including basic definitions and hypotheses. Section 3 presents the survey results: description of the sample and descriptive and econometric analysis. Finally we draw some conclusions and indicate further research needs.
1
Acronym for: “The Impact of Cleaner Production on Employment – A Study using Case Studies and Surveys”, see for detailed information project homepage http://www.impress.zew.de. 3
2. Conceptual approach 2.1. Definitions According to the OECD Guidelines for Collecting and Interpreting Technological Innovation Data (OECD 1997), we distinguish between technical and organisational innovations. Technical innovations are further subdivided into product and process innovations. We use the following definition of environmental innovation or eco-innovation (Kemp and Arundel 1998; Hemmelskamp 1997; Rennings 2000): Environmental innovations consist of new or modified processes, techniques, practices, systems and products to avoid or reduce environmental harms. Environmental innovations may be developed with or without the explicit aim of reducing environmental harm. They may be motivated by the usual business goals such as reducing costs or enhancing product quality. Many environmental innovations combine an environmental benefit with a benefit for the company or user. For environmentally friendly technologies we use the following categories: • Eco-innovations are divided into cleaner technology (product and processintegrated
changes)
and
end-of-pipe-technology
(pollution
control
technologies that prevent the direct release of harmful substances into the environmental media air, water and soil). • Recycling can not easily be subsumed under the categories cleaner and endof-pipe technology. Process-internal recycling can be understood as cleaner technology while process-external recycling is an end-of-pipe technology. To avoid any confusion, it is reasonable to treat recycling as a separate category. • Finally, we have introduced the area of logistics, product delivery and distribution systems as a separate innovation category. Although they can be interpreted as specific kinds of process innovations, we have added them explicitly. This was motivated by the fact that the importance of product delivery, transport and distribution has increased over the past years, and not all firms may understand these activities as process innovations. 4
To summarise, we asked for six different categories of eco-innovations in our survey: Product integrated measures (goods and services), process integrated measures, end-of-pipe measures (pollution control), recycling, organisational measures and logistics. 2.2. Direct and indirect employment effects We assume a two-stage decision process of the firm. It decides at a first stage on the resources to invest in innovation and, depending on the outcoume, determine at a second stage the profit-maximising volume of labour input, see also König et al. (1995). Our study concerns the second-stage profit-maximizing decision for a given successful innovation. The employment impacts may be split into direct and indirect effects, see also König (1997). The direct employment effects are defined as effects that are directly related to the new product or process. Indirect employment effects occur elsewhere in the same firm (the case of a multi-product or multi-process firm where these indirect effects are related to other products and processes) or occur in other firms. Indirect effects can be: • substitution effects (like reduction in employment in old processes and products following the introduction of an eco-innovation), • income or compensatory effects (they stem from an increase or decrease in value added related to the production and use of an eco-innovation. They can occur in the innovating firm (changes in sales due to the costs of ecoinnovation) or elsewhere.
2.3. Hypotheses We have formulated hypotheses concerning direct and indirect employment effects as described in Table 1. The hypotheses are in broad conformity with hypotheses in former studies on the general employment effects of innovations (see König 1997 and König et al. 1995). We have, however, introduced two peculiarities of eco-innovation: • Environmentally friendly products usually do not create substantially new demand. An example is the introduction of low-noise lawn-mowers. They led to more employment in the production of these devices, which are however at least partly compensated by respective losses in the sale of noisy lawnmowers. Thus it can be assumed that substitution effects of cleaner products are generally higher compared to other product innovations. Positive 5
employment effects of cleaner products can occur if they create more value per unit. For example, the production of organic food is normally more costly than for conventional food which is met by a higher consumer willingness to pay for these products. Further, additional employment can be created in R&D-departments temporarily. Total employment effects of cleaner products can however be expected to be lower compared to other innovations. • Environmentally friendly process innovations do not necessarily increase the productivity of a firm. They may even reduce productivity and require increasing labour inputs per unit. Thus environmental process innovations can have a positive direct employment effect. These effects can be compensated by negative indirect effects, i.e. a loss of sales and competitiveness (especially if environmental standards are different across countries). This peculiarity of environmental process innovations can be explained by the fact that they are often not motivated by cost reduction and increasing sales, but also compliance with regulation (Cleff and Rennings 1999). This can be assumed especially for end-of-pipe technologies. For example, a new filter or recycling process may be installed due to regulation. In contrast, economic innovation goals like increased productivity and cost reduction (costs of energy, waste, disposal, material or labour) can be especially assumed for process integrated innovations and innovations in logistics.
6
Table 1: Hypotheses on direct and indirect employment effects of ecoinnovations Types of Direct employment effects Indirect employment integrated effects measures Tendency positive, employment due Tendency negative, size Product to new product or service depends i.a. on the degree of integrated complementarity of old and measures new products/services (goods and services) Process Increasing productivity but negative Tendency positive integrated employment effect, substitution (compensatory effect, measures, effect of technical progress increasing competitiveness) logistics Tendency negative End-of-pipe Tendency positive, due to (compensatory effect, loss of processes, implementation and operation of competitiveness) recycling new technology. Increasing measures productivity is not the main innovation goal (other motivations such as compliance with regulation dominate) Organisational Positive employment effect due to Unknown, depends on concrete measures within measures (e.g. implementation of the environmental programme organisational measure eco-audits) of the firm
Product integrated innovations, eco-friendly services Product innovations in integrated environmental protection lead to positive direct employment effects, which can however be partly or entirely offset by their crowding out of previous products. Our study is the first one looking specifically at the effects of environmental innovations in the service sector, too. Our working hypothesis is that the effects are similar to those of product integrated measures. Process integrated measures, logistics Our hypothesis is that the employment effects of process integrated environmental measures are in terms of their employment effects comparable to the cost-saving technological progress by other process innovations. In addition to the ecological effects, increasing productivity of the production process is sometimes the main reason for the innovation. As competitiveness improves, the indirect effects inside the firm tend to be positive. Negative indirect effects outside the firm may occur in other sectors due to reductions of waste, transport, energy and material use (job losses for supplying firms in waste, energy, transport and production sector). The same is assumed for environmental logistics innovations which often include measures for reducing transport. 7
End-of-pipe processes, recycling End-of-pipe and recycling measures tend to have positive direct employment effects. They create new steps and links in the value chain and thus have a potential for additional employment. They are normally accompanied by additional investments which do not necessarily increase the productivity of the firm. The indirect employment effects tend to have the opposite effect. The effects are thus the opposite of the hypothesised effects of integrated process innovation. Organisational measures Organisational measures are initially accompanied by additional expenditure and work processes (e.g. undergoing an eco-audit procedure), which create positive direct employment effects, while the indirect effects depend on the concrete measures which are implemented within the environmental programme of a firm. It should be noted that our firm survey mainly measures direct effects within the firm. Thus empirical evidence drawn from our study focuses on our corresponding hypotheses on direct effects. However, some questions have been included in the questionnaire which allow interpretations concerning the relevance of indirect effects. For example, we asked for the effects of environmental innovations on prices. Substantial price effects can be used as an indicator that indirect income effects may be significant. 3. Empirical evidence 3.1. Description of the data In this paper we analyse data from the European project IMPRESS. The project was carried out from October 1998 to January 2001. Between March and July 2000, 1594 telephone interviews with industry and service firms were carried out in five European countries (401 from Germany, 384 from Italy, 201 from Switzerland, 400 from the United Kingdom, 208 from the Netherlands). The addresses for the telephone interviews were drawn from a stratified sample with the dimensions small firms (between 50 and 199 employees) and large firms (200 or more employees) and 8 sectors according to the NACE codes D-K. These NACE codes are industry, manufacturing and services. Firms active in other sectors such as mining, agriculture or public administration have not been included in the sample.
8
In Germany, an additional stratification for the firms located in East or West Germany has been introduced, in Italy, the firms were differentiated between the North and the rest of the country, while in Switzerland, a differentiation between the region of the three major language groups German, French and Italian was made. The firms contacted have been asked first if they have introduced at least one eco-innovation from the list from Table 1 during the last three years. If this was not the case, the interview was terminated. Therefore, the data basis only contains firms that identified themselves as eco-innovators and the analysis concentrates on the behaviour of firms with respect to employment changes provided they have introduced an environmentally related innovation. In addition, we only have cross-section data and therefore neither an analysis of causal effects or of the impact of time is possible. Also individual fixed effects can not be taken account of. The time structure is only captured indirectly by asking about the employment impact during the last three years and by asking about the expected demand effects (see also König et al. 1995 and Rottmann/Ruschinski 1998). These limitations of the data seem to be minor, however, because we do not estimate employment change equations or labour demand, but only impacts on the sign of the employment change. A thorough discussion of possible data limitations and related estimation problems can be found in Chennels and Van Reenen (1999). The number of small and large firms and the number of firms interviewed per sector is reported in Table 5 in the appendix. We used a stratified representative sample considering the cells mentioned above. The results of the survey are therefore representative for each country under the assumption that ecoinnovators do not differ in their characteristics from other firms. Since this is a very restrictive assumption, the survey results should not be interpreted as being representative for all eco-innovators. A representative survey of eco-innovators can only be carried out if the universe of eco-innovating firms is known, what is not the case. Determining the universe of eco-innovating firms and improving the knowledge about general differences between eco-innovating and other firms is beyond the scope of our project and remains as a question for further research. The data set was especially designed to measure the effects of eco-innovations on employment at the firm level. Therefore, it has some unique variables that are not included in other data sets. For example, it directly asks about the employment effects induced by the innovation in contrast to the general employment change which is frequently used as an indirect indicator for it, see for example Pfeiffer (1999). In addition, besides the differentiation between direct and indirect effects, the data set allows to draw conclusions on the 9
employment effects of relevant policy variables such as subsidies and environmental regulations.
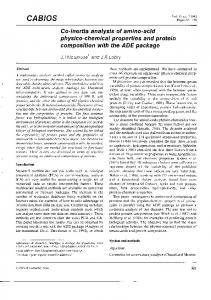
3.2. Descriptive results 3.2.1. Environmental innovations and employment Figure 1 shows all environmentally beneficial innovations according to our definition which have been introduced by the firms in the last 3 years (column ‘Mentioned’; multiple answers were possible). The figure also shows the innovation which has been cited as the most environmentally beneficial one (´Most beneficial´, here also multiple categories were given by some firms). The most environmentally beneficial innovation is the one the entire questionnaire is referred to. Therefore, if the firm has introduced more than one innovation, the respondent had to choose the one that had the highest positive impact on the environment for the interview. Besides the innovation types process and product integrated environmental innovations, also recycling and pollution control (endof-pipe technologies) also have been frequently introduced. Changes in the distribution system (logistics) and in organisation methods are not widespread. Figure 1: Environmentally beneficial innovation
Mentioned
Most Beneficial
% 70 N=1570
60
N=1564
N=1588 N=1580 N=1581
50 N=1567
40 30
65
N=1592 57
57 52
49
20
39
36
32
29
32
10 13 8
0 Products or Services
Distribution System
Process
10
Organisational Method
Recycling System
Pollution control
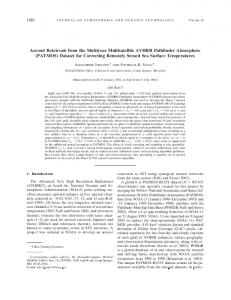
Figure 2 shows important reasons for introducing the eco-innovation by innovation type (multiple answers were possible). The three most cited reasons for introducing the innovation are to improve the firm’s image, to comply with environmental regulation and to reduce costs. This is particularly noticeable for process integrated innovations, recycling innovations and when end-of-pipe (pollution control) technologies were introduced. Increasing market share plays only a minor role for introducing eco-innovations but is particularly important for integrated technologies (product, service and process integrated). Figure 2: Important reasons for introducing the innovation
Product Process Pollution control
N
Service Organisational Method
Distribution System Recycling System
500
400
300
200
419
402
390
390
374381 314
308
264
100
185
171 122
132
66
141 92 61
142 120 84
181 125 77 44
101111 62
142 131 109100
Secure existing markets
195
182 139 101
155
103 62
0 Comply with environmental regulations
203 159
87 47
24
41
67 77
92 84 42
Increase Reduce costs Improve firm's Respond to a Achieve an market share image competitor's accreditation innovation
11
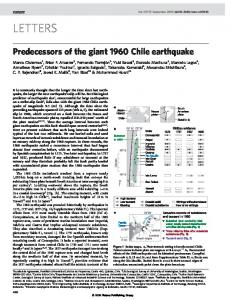
Figure 3 shows the effects of the environmental innovation on employment. Overall 88 % of the firms had no notable effect on employment due to the specific innovation (see left column). In 9 % of the cases the number of longterm employees increased due to the innovation, in 3 % of the cases it decreased. This shows that there is only a weak but positive relation between the introduction of environmental innovations and employment. Regarding the distribution of employment effects by innovation type, it becomes apparent that product innovations and service innovations have a sizeable aboveaverage positive employment effect (18 % and 20 %). It is further interesting that the employment effect of recycling innovations is positive in almost all cases. Innovations in logistics have the highest shares of negative employment changes. Figure 3: Effect of innovation on employment increased N=1575
%
N=274
N=185
78
76
decreased N=132
unchanged N=568
N=201
N=502
N=498
91
88
1 8
4 8
100 80 60
88
80
84
88
40
l ro nt n ll u
tio
g lin yc
tio isa an rg O
co
st Sy
et lM na
Pr
tri bu is
12
Po
es oc
st tio
n
Sy
Se
12
9
s
e rv
ic
ct du Pr o
O
ve
ra
ll
0
12
D
9
4
3
em
8
d
20
ec
18
R
4
ho
4 3
em
20
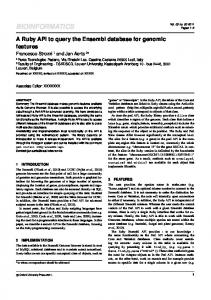
3.2.2. Factors influencing employment effects of eco-innovations Figure 4 shows by whom the eco-innovation was developed, overall and in connection with the question as to whether the innovation resulted in employment effects. For 44 % of the firms, other firms or institutes developed the innovation (see left column). Against this, only 32 % developed the innovation in their own institution. For the firms with employment changes due to eco-innovations, 39 % to 40 % developed the innovation themselves. This means that in-house development of eco-innovations results more frequently in employment effects. Figure 4: Who developed the innovation our firm
%
N=1511
N=140
24
25
other firm
both N=37
N=1318
100 30
24
80
60 44
36
30
39
40
45
40
20
32
31
0 overall
Innovation increased employment
13
Innovation decreased employment
Innovation kept employment unchanged
Figure 5 gives an overview of the investment costs and their correlation with the employment effect of the eco-innovation. 64 % of the firms invested less than € 50,000. In the 135 firms which increased employment there is an aboveaverage high level of investment costs. Firms which decreased employment due to the innovation also have an above-average share of investment costs above € 50,000, i.e. it seems that innovation size has only an impact on the variance of employment effects. This is plausible if we take into account fixed employment turn-over costs. Minor changes in the production process are therefore not employment effective.
Figure 5: Investment costs of the innovation
% 100
less than 50000 Euro
between 50000 and 0.5 million Euro
between 0.5 and 5 million Euro
more than 5 million Euro
N=1493 4
N=135
N=39
4
5
N=1305 3 7
8 20
80
26 24
60
35
23
26
40 67
64
20
41
43
Innovation increased employment
Innovation decreased employment
0 overall
14
Innovation kept employment unchanged
Figure 6 shows which proportions of the establishment’s total innovation expenditures over the past three years were spent on environmental innovation. For the majority of establishments (51 %), less than 5 % were spent on the ecoinnovation. Distributing the results by innovation types, it is remarkable that an above-average number of firms had a relatively higher investment share for product, service and process integrated innovations. When comparing this result with Figure 3, there is no clear connection with the employment effects of such innovation types. Compared to process integrated innovations, product and service innovations have a small, above-average positive effect on employment. After we have observed that more expensive innovations more frequently induce employment changes, it is not surprising that innovations with a high share in total innovation costs also induce employment changes more often. While in firms where employment was unchanged by the innovation only 14% reported an innovation share above 50% of total innovation expenditures, the share was 42% for firms reporting employment increases and 16% for firms reporting employment decreases. Figure 6: Proportion of innovation expenditures
less than 5%
% 100
N=1284 9 9
80
between 5% and 25%
N=213
N=144
11
11
14
12
34
40
N=98
N=476
16 7
31
60
between 25% and 50%
30
N=163
11
12
13
11
35
more than 50%
N=411
N=414
6 5
10 13
22
26
32
40 67
20
51
41
47
37
41
51
45
15
C on tro l Po llu tio n
Pr oc O es rg s an is at io na lM et ho d R ec yc lin g Sy st em
Sy st em
e D
is tri bu tio n
Se rv ic
Pr od uc t
O ve ra ll
0
Figure 7 gives an answer to the question whether there is a correlation between receiving subsidies or grants for introducing the innovation and the innovation type. Multiple answers were possible. On average, only 11 % of firms received a subsidy or grant. For product and service innovations, the number of firms is above average. Since exactly these innovations are the ones with the strongest positive employment effect, the overall allocation of subsidies within environmental technology support programmes in the five countries involved can be characterised as employment-friendly. This also can be seen from the fact that 21% of the firms indicating employment increase due to the innovations received subsidies, while this was the case for only 7% of the firms that reduced employment. The share was 9% for the firms that did not change employment.
Figure 7: Was subsidy/grant received (by innovation type)
%
yes
50 40 30 20
N=263
10 14
N=179
N=556
N=198
N=128
17
N=478
N=488
overall
13
11
6
12
8
16
C on tro l Po llu tio n
Sy st em R ec yc lin g
et ho d
O
rg an is at io na l
M
Pr oc es s
Sy st em
D is tri bu tio n
Se rv ic e
Pr od uc t
0
3.2.3. Eco-innovations and skills Figure 8 answers to the question whether new skills required because of the ecoinnovation are correlated with the innovation type and with employment. Overall, new skills were required by about 36 % of the firms introducing environmental innovations. It can be shown that service innovations (50 %) and organisational methods (46 %) as well as product (45%) and process integrated (44%) innovations require a noticeable above-average need for new skills. Furthermore, there is a strong connection between the need for new skills and a positive employment effect: 67 % of firms with new long-term employees due to the innovation had a need for new skills. On the other hand, there was also an above-average need for new skills in firms which reduced employment due to the innovation. Figure 8: Need for new skills by innovation type and employment effect
Yes
% 100 80 60
N=145 N=275
N=184
N=43
N=204 N=496 N=502
N=133
40 20
N=570
N=1374 overall
67 45
50 35
44
53
46 29
40
32
17
Innovation kept employment unchanged
Innovation decreased employment
Innovation increased employment
Pollution control
Recycling system
Organisational method
Process
Distribution system
Service
Product
0
Figure 9 gives an overview how the need for new skills was met (multiple answers were possible). The majority of the firms (90 % of firms requiring new skills; 41 % of all firms) uses the method of training existing employees. Only 14 % of all firms (33 % of firms requiring new skills) hire new employees on a permanent or temporary basis. From the 10 % (17 % of firms requiring new skills) which outsourced this work, it can be expected that positive employment effects occurred in the firms commissioned. Figure 9: How were new skills met
Yes
%
N=1270
50
40
30
41
20
10 10
0
4
Obtain new employees from other units of your firm
10 4
Train existing employees
Hire new employees Hire new employees on a permanent on a temporary basis basis
18
Outsourced work
Figure 10 gives an answer to the question as to who received training and whether there is a connection with manufacturing or service firms or with the employment effect. Overall, mostly skilled workers received training (45 %), followed by staff with college or university degrees (32 %) and by unskilled workers (24 %). This distribution is similar for both manufacturing and service firms. In firms which increased employment, employees received above-average training, especially the staff with college or university degrees. In firms which decreased employment, unskilled workers and staff with college or university degrees received the same share of training (29%). Figure 10: Who received training by industry and employment effect College or university degree
Skilled workers
Unskilled workers
% 70 N=926
60 50
N=922 N=924
40 63
30 49
45
20
42
40 34
32
10
54
53
24
26
31
29
29
29
29 22
20
0 overall
manufacturing
service
Innovation increased employment
19
Innovation decreased employment
Innovation kept employment unchanged
3.2.4. Effects on sales, prices and costs The following Figures show the effects of the environmental innovations on sales, prices and costs. They therefore allow us to make tendency statements about the indirect innovation effects. As can be seen in Figure 11, the innovations had no effect on sales and prices for more than 83 % of the establishments. For 16 % of the establishments, sales increased. Prices increased in 9 % of the firms but in most cases by less than 5 %. Prices decreased also in 9 % of the firms. Since 82 % of the firms state no price effect and for the rest neither negative nor positive effects dominate, it can be concluded that indirect income effects stemming from the innovation can be neglected on the firm level. Figure 11: Effects of innovations on sales and prices increase
%
N=1517
decrease
N=212
no effect
< 5%
N=7
N=1547
100
5%-25%
> 25%
N=119 7
N=126 4
16 29
80
60
83
39
60
57
prices increased by
prices decreased by
82
56
40
33
71
20 28 16
9
0 sales
sales increased sales decreased by by
20
prices
Figure 12 shows that energy costs decreased in more firms than the other costs listed here. 34 % of the firms could decrease their energy costs due to the innovation. This result is in line with the high share of process innovations (see Figure 1) and the motive of cost reduction (see Figure 2). The level of decrease of energy costs is also relatively high: for 52 % of the firms, energy costs decreased by more than 5 %. Material costs were unaffected for 58 % of the firms. In those cases with changes in material costs, the number and level of decrease were a bit higher than in the cases of increase. While substantial decreases of energy costs indicate negative indirect employment effects for the energy supplying industry, no similar effect can be found for materials. Figure 12: Effects of innovations on energy and material costs increase
%
N=1551
100
decrease
N=214 5
no effect
N=470
< 5%
N=1552
5%-25%
> 25%
N=239 6
7
N=366 10
21
80
35
51
58
45
43
60
40
74 34
25
59
48
20
47 17
15
0 energy costs
energy costs increased by
energy costs decreased by
21
material costs
material costs increased by
material costs decreased by
Waste disposal costs could be decreased for 37% of firms (see Figure 13). This is due to the relatively high share of recycling innovations. The level of decrease was even more than 25 % for 22 % of the establishments. However, waste disposal costs increased for 19 % of the firms. Thus a total negative indirect effect can be observed for employment in the disposal sector. In 65 % of the firms, labour costs did not change due to the innovation. However, they increased for 20 % of the firms but mostly by less than 5 %. Compared to the increased or decreased employment (see Figure 3), the higher percentage of firms with an increase or decrease in labour can be explained by the fact that labour costs had increased due to the need for new skills and higher qualifications. Figure 13: Effects of innovations on waste disposal and labour costs increase
%
N=1566
100
decrease
N=267
no effect
N=537
< 5%
N=1554
N=281 2
N=225 6
24
44 41
60
40
> 25%
9 22
80
5%-25%
45
65 44
37
74 15
50
20
49
34 20
19
0 waste disposal costs
increased by
decreased by
22
labour costs
increased by
decreased by
3.2.5. Influence of regulation, competition and general employment trend Figure 14 gives an answer to the question how important are environmental regulations for processes and products and whether concrete changes were made in the last three years in order to comply with these regulations. It becomes apparent that environmental regulations seem to be important for both product and process innovations. Concrete changes in order to comply with the regulations were made in about half of the eco-innovative firms. Figure 14: Importance of environmental regulations for processes and products and changes to comply with regulations
very important
%
moderately important
no effect
60 N=1566 N=157
N=1567
50
40
30 53
46 20
41
40
38
22
10 13
0 process
product
23
changes to comply with regulations
Finally we asked some general questions which are not related to the specific innovation, e.g. concerning the competitive situation of the firm and general employment trend. Price and quality are clearly the dominating competition factors, see Figure 15. By a wide margin, they are followed by innovative products or services, corporate image and environmentally friendly features. Environmentally friendly features are mentioned by only 3 % of the firms as the most important factor. This is surprising because the answering firms are exclusively those which introduced environmental innovations in the last three years. It can be concluded that environmental innovations are only developed voluntarily by firms if they face no substantial negative impacts on more important competition factors, especially on costs and quality. Figure 15: Important competition factors mentioned
most important
% 100 90
N=1588 N=1583 N=1587
80 70
N=1585
60
N=1581
50 40
83
N=1480
92 76 63
30 20
38
45
50
10 3
6
8
0 Price
Quality
Environmentally friendly features
24
Innovative products or services
Corporate Image
Figure 16 shows the overall employment changes of the firms introducing environmental innovations. For the majority, employment increased in the last three years (49 %; see left column). Figure 16 shows that large and small firms increased employment almost to the same extent, while the employment shift to the tertiary sector is represented by a more frequent increase in service than in manufacturing firms. The last three columns of the figure present evidence for the measurement error if the general employment change is taken as a proxy for changes in employment induced by innovations. This measurement error only can be avoided in panel studies, see for example Rottmann and Ruschinski (1998). In addition, the difference between total employment change and employment change attributed to the innovation shows that the people who were interviewed were able to differentiate between general employment changes in the firm and changes induced by the eco-innovation. Figure 16: Change in overall employment increase
%
N=1582
N=387
decrease
N=1195
N=902
35
36
unchanged
N=680
N=146
N=43
N=1378
100 16
80 60
34
17
28
25
30
36
13 15
21
51
40 20
23
7
17
77 49
47
50
57
47
43 26
25
Innovation kept employment unchanged
Innovation decreased employment
Innovation increased employment
service
manufacturing
small
large
overall
0
Figure 17 shows whether there is a correlation between employment change due to the eco-innovation and those firms which offer environmentally friendly products or services. There does not seem to be a strong connection because firms with increased as well as decreased employment due to the innovation have an above-average percentage of environmentally friendly offered products. Thus firms offering product on the market for environmental goods and services (so-called EGS-market) seem to have a higher variance of employment due to their eco-innovative activities. Figure 17: Companies offering environmental products or services on the market
Yes
% 100
80
N=145 60
N=41 N=1568
N=1347
40 63 20
49
42
40
0 overall
Innonation increased employment
Innovation decreased employment
Innovation kept employment unchanged
3.3. First conclusions We can conclude from the descriptive analysis that environmentally beneficial innovations generally have a small but positive effect on employment on the firm level. Overall 88 % of the firms state that eco-innovations are neutral, 9 % state a positive and only 3 % a negative impact. For environmental product and service innovations, 18 to 20 % state positive effects. These results give first evidence to the hypothesis that more jobs are created by environmentally friendly product and service innovations than by process innovations. Other factors like in-house-development of innovation, size of innovation or regulatory pressure can strengthen both positive and negative effects. 26
The three most cited reasons for introducing the innovation are to improve the firm’s image, to comply with environmental regulation and to reduce costs. This is particularly noticeable for process integrated innovations, recycling innovations and when end-of-pipe (pollution control) technologies were introduced. Increasing market share plays only a minor role for introducing ecoinnovations but is particularly important for integrated technologies (product, service and process integrated). On the other hand, price and quality are clearly the most important competition factors for eco-innovating firms. It can be concluded that environmental innovations are only developed voluntarily by firms if they expect no substantial negative impacts on these “hard” competition factors. In the innovation process of a firm, environmental aspects are clearly dominated by economic factors or by restrictions due to regulation. While the data mainly refer to hypotheses on direct effects, at least some general conclusions can be drawn concerning the indirect effects. Income effects due to price changes seems to be negligible, while substantial decreases of energy and waste disposal costs may lead to significant negative indirect employment effects in the energy and waste disposal sector. 4. Econometric Analysis The goal of the econometric analysis is to quantify several explanatory variables (like the impact of the category of innovation, the innovation goals, and the size of the innovation) and suitable control variables on the probability that the ecoinnovation has a positive or negative employment effect on the firm level. The dependent variable is the answer to the question “By long-term employment we mean employment in the firm for more than one year. Has this innovation increased, decreased, or had no noticeable effect on the number of long-term employees in your establishment?”. The dependent variable has three values (increase, decrease and unchanged) that are unordered. As we have argued in the introduction, the determinants of a positive employment impact, no employment change and of a negative employment impact may be completely different. Therefore, we need an estimation method that allows for differences between the employment changes of firms. We therefore chose a multinomial logit regression, because this estimation techniques detects the differences between the determinants for the three values of the dependent variable. The regression thus explains the different reasons for an employment increase or decrease relative to unchanged employment. The explanatory variables included in the model are directly linked to the considerations in section 2. Independent variables are: 27
• Categories of eco-innovation (see hypotheses in section 2.3) • eco-innovation goals (since it can be expected that cost reduction targets have a negative impact, while targets to increase market share should have a positive influence on employment) and • size of innovation (since employment changes only occur when the turn-over costs are more than compensated by the change, see Rottmann and Ruschinski, 1998). Control variables are: • the firm size, • whether the effects can be partly explained by subsidies which have been received for the innovation, • sales expectations (it can be expected that firms with optimistic expectations are more inclined to increase employment already before demand actually increases, this is also called demand pull hypothesis of innovations, see König, 1997 or Rottmann and Ruschinski, 1998), • whether products or processes have been changed due to environmental regulation (indicator for strictness of environmental regulation), • competition factors as a proxy for market characteristics (since firms competing on the basis of costs probably choose a different employment behaviour than firms competing on innovative products or environmental performance) and • the share of workers with unversity or college degree. This may indicate if skills and innovations are complements, i.e. there is skill biased technological change (see for example Van Reenen, 1997). The list of relevant variables for our econometric model is shown in Table 2.
28
Table 2: Relevant variables and indicators Dependent variables: Increase of employment due to eco-innovation Decrease of employment due to eco-innovation Independent variables: Category of eco-innovation Eco-innovation goals Share of expenditures for eco-innovation on total innovation expenditures Control variables: Firm size Share of employees with college or university degree Subsidies or grants for innovation received Positive sales expectations Changes of product or processes to comply with environmental regulations Competition factors Country
The eco-innovation categories, eco-innovation goals, and competition factors are captured by item lists that potentially are correlated and therefore the variables may be collinear. In order to correct for that, a factor analysis was carried out that reduces the number of dimensions to the uncorrelated ones. We use the Kaiser-Meyer-Olkin-Criterion (KMO) in order to decide if the correlation structure of the items is suited for a factor analysis.2 For categories of eco-innovation, no clear factors could be identified. The KMO criterion is 0.51 and therefore too low. The highest correlation is .185. In addition, no single factor has a high measure of sampling adequacy and, therefore, multi-collinearity seems to be a minor problem. As a consequence, no reduction in dimensions is carried out here. For the list of seven innovation goals, the KMO value is 0.67 which allows a factor analysis. There are three components with eigenvalues above 1 which explain 62 % of the total variance. The factor loadings can be found in Table 7 in the Appendix. The three independent innovation goals are given the intuitive names market share, environmental factors and cost reduction.
2
The KMO criterion may lie between 0 and 1. The critical value below which no factor analysis should be carried out is 0.6. 29
The competitive situation is captured in a list of five items. Here the KMO value is 0.70 which also allows a factor analysis. There are two components with eigenvalues above 1 which explain 59 % of the total variance. The factor loadings can be found in Table 8 in the Appendix. Price and quality are subsumed to “hard” competition factors, while environmental and other aspects are called “soft” competition factors. Notice that the first factor is negatively correlated with price and quality and therefore the signs in the regression of this factor have to be reversed in the interpretation of the estimation results. The multinomial logit model shows which variables have a stronger impact on firms with a change in employment in comparison to firms without employment changes in the wake of environmentally beneficial innovations. It produces the following significant correlations (see Table 3). A F-test confirms that all parameters are jointly significantly different from zero. The determinants of an employment increase also differ significantly from the determinants of an employment decrease. Table 9 in the annex gives an indication of how well the regression fits reality. First, the predicted probabilities are calculated that one firm is in one of the three different employment situations. Then the firms are classified according to their highest predicted probability. Finally, these predicted outcomes are compared with the actual outcomes. The observations in the main diagonal in table 9 are predicted correctly with our estimation, while the observations off the main diagonal are not predicted correctly. The table therefore tells us that many firms are predicted to have no employment change although they actually increased or decreased employment. This is a consequence of the weak prediction power of logit models with strongly asymmetrical distributions of ones and zeros. Nevertheless, 88% of the cases have been predicted correctly according to our measure of fit.
30
Table 3: Regression results of multinomial logit regression Probability that employment increased Coefficient z * Product innovation .632 2.349 * Service innovation .658 2.205 Process innovation -.116 -0.444 Organisational method innovation .187 0.548 Recycling system innovation -.007 -0.026 End-of-pipe innovation -.055 -0.204 ** Reason to innovate: Market share .577 4.823 Reason to innovate: Environment .008 0.066 Reason to innovate: Cost reduction .046 0.385 "Hard" competition factors .094 0.809 "Soft" competition factors -.105 -0.814 * Large firm -.832 -2.369 ** Share of innovation expenditures on .899 3.501 total innovation expenditures Share of total employees with college .015** 3.075 or university degree Subsidies or grants for innovation .327 1.070 received Sales expectations positive 1.144** 3.191 ** Change to comply with environmental .753 2.995 regulations Germany .941* 2.290 Switzerland .462 0.907 + The Netherlands .800 1.680 Italy .404 0.970 ** Constant -4.942 -9.051 Number of observations 1015 Log likelihood -353 2 Pseudo R 0.2253
Probability that employment decreased Coefficient z .536 1.004 .432 0.601 .282 0.562 .051 0.078 * -2.361 -2.180 ** 1.593 3.006 ** .976 3.801 ** -.650 -2.718 ** .692 2.613 -.595 -1.570 * -.503 -2.119 .666 1.281 * 1.217 2.465 .003
0.276
-1.080
-1.205
-.393 1.345**
-0.751 2.673
1.231+ .737 -1.185 -.560 -6.269**
1.862 0.913 -1.143 -0.738 -6.496
Source: IMPRESS Questionnaire, April 2000 Remarks: Significancy levels are as follows: + < 0.1, * < 0.05, ** < 0.01
5. Discussion In this section we discuss factors which have been identified to be significant for an increasing probability of positive employment changes, for negative employment changes, or for both. Finally we draw some policy conclusions. 31
Firstly, several factors are significant for positive employmment impacts. With respect to the reference category (logistics innovations3), product and service innovations have a positive effect, while all other innovation categories are not significant. This is in line with the general literature on innovation and employment. Indirect substitution effects of product and service innovations on the firm level appeared to be lower than we expected. To control for this substitution effect, the question “Did this innovation replace some of the product/service sales of your establishment?“ was used. While we expected substitution effects in nearly all cases, only 43 % of the product innovators and 27 % of the service innovators answered “yes“. It seems that ecological products and services have created their own market niches being supplements to conventional goods and services. However, it can be assumed that for most of the innovations mentioned by the firms, as for example “new cleaning techniques” or “transport reduction measures“, negative indirect substitution effects occur in other firms. Small firms report more employment increases than large firms. This result is in line with other empirical studies on the general relation between innovation and employment, too (see Brouwer et al. 1993 or Smolny and Schneeweis 1999). Firms with high shares of employees with college or university degrees have a higher probability to increase employment in the wake of innovations. This may be an indication that also environmentally-oriented innovations are skill-biased, see Van Reenen (1997) and Chennels and Van Reenen (1999). Positive sales expectations are highly significant for increasing employment (this is also found in most other estimations on the firm level, see the discussion in König, 1997). As innovations frequently are induced by positive sales expectations, there is a possible endogeneity problem here, see Chennels and Van Reenen (1999). Firms in Germany, the Netherlands and Italy have a higher probability to report a positive employment effect than firms in the UK, the reference country. Secondly, some other factors have been identified correlating significantly with an increasing probability of job losses. End-of-pipe-processes have a positive, recycling innovations a negative correlation with the probability that the innovation has a negative impact on employment. This result is quite surprising since we expected the same direction of employment effects for both kinds of innovations. However, already the descriptive analysis has shown that employment effects of recycling innovations are positive in almost all cases. An
3
Innovations in logistics have been used as reference category because they have a small share of the total sample and appeared to be not significant in the econometric analysis. The relative high number of cases with negative employment effects in the descriptive analysis turned out to be a spurious correlation int the econometric test. 32
explanation for the difference between end-of-pipe technologies and recycling measures may be the maturity of regulation. While end-of-pipe regulations have existed, in many cases, for twenty or thirty years, political measures concerning recycling have been mainly implemented during the nineties. Thus, new end-ofpipe innovations often replace existing older technologies, while other environmental process innovations, especially in the area of recycling, have lower substitution effects. We have addressed this substitution effect by the following two questions in the questionnaire „Did the introduction of this process innovation replace, at least in part, a previous production process in your establishment?“ and „Did the introduction of this process innovation replace, at least in part, end-of-pipe pollution control equipment?“ 38 % of end-of-pipe innovators answered the first question with “yes“, compared to 19 % of recycling innovators. And 34 % of end-of-pipe innovators agreed on the second question, compared to 13 % of recycling innovators. These numbers indicate that substitution effects are substantially different across different types of environmental process innovations. This may explain the better performance of recycling innovations in terms of employment. When environmental goals motivate the innovation, it is less probable that the innovation has a negative employment effect. On the other hand, cost reduction as motivation for the innovation increases the probability that the firm reduces employment. In contrast, innovations aiming at cost reduction have only negative effects on employment. It can be expected that firms invest in improved labour-saving technologies, especially in areas where the technologies have already reached a certain maturity (mainly end-of-pipe technologies). If the firm is not under the pressure of strong cost competition, “soft“ factors like environmental aspects become more important. This decreases the probability of job losses. Further, three factors have been identified which can affect employment in both directions. Market share as an innovation goal, innovation size and strictness of environmental regulation are significant for either positive or negative employment changes. Market-oriented strategies focusing on the development of environmentally beneficial innovations impose chances but also risks on firms. Environmental products and services are often marketed on small niches and thus bear risks of profitability. Other innovation goals like complying with environmental regulations still dominate. Concerning innovation size, the result confirms the hypothesis that fixed turn-over costs lead to changes in employment only if there is a major re-organization in the wake of the innovation. A critical innovation size must be reached before employment changes are measurable in person/years by surveys as carried out within our project. Also environmental regulation can lead to both positive or negative employment effects, depending on the concrete innovation actitivities being undertaken due to the regulatory pressure. 33
Finally, it is remarkable that subsidies or grants for the innovation do not have any employment impact. This means that the allocation of subsidies for environmental technologies and innovations in the respective countries is neutral concerning employment and thus does not counteract labour market policy. However, employment could be stimulated by shifting more money from endof-pipe measures to integrated measures, especially products and services. But even an employment-oriented allocation of subsidies for environmental programmes will only induce minor employment changes. To sum up the results of the econometric analysis, basic hypotheses about the general relationship between innovation and employment have been confirmed. Product and service innovations create more jobs than process innovations. Employment changes only occur in the wake of major innovations. This is confirmed by the significant impact of the share of innovations expenditures variable for employment increases as well as employment decreases. We also detect signs of skill-biased technological change of eco-innovations, because the share of highly qualified employees has a positive impact on employment increases, while it is insignificant for employment decreases. Significant impacts of the control variable size show that employment is especially created in small firms. A positive correlation between sales expectations and employment is in broad conformity with the innovation literature. Beyond these general insights, some specific conclusions can be drawn for a coordinated environmental, innovation and labour market policy. Generally, eco-innovations have a small but positive effect on employment on the firm level. Thus environmental support programmes do not counteract labour market policy. However it should not be expected that ecological modernisation of industries gives substantial contributions to overcome mass unemployment. A further shift from end-of-pipe technologies to cleaner production, especially towards product and service innovations, would be beneficial for the environment and would create jobs. This synergy should be considered in political programmes whether they are borne by environmental, labour market or innovation policy. Some potential still exists for shifting subsidies from processes and end-of-pipe solutions to cleaner products and services. The scope of the data is limited to employment effects on the firm level when a firm classified itself as being an eco-innovator. Improving the knowledge about either the universe of eco-innovators or the differences between ecoinnovatoring firms and other firms are important questions of further research. While the problem of measuring innovations can be addressed thoroughly, we can not control for fixed effects and possible endogeneity for example in demand expectations. While the data mainly refers to hypotheses on direct effects, at least some general conclusions can be drawn concerning indirect effect. Income effects due to price changes seems to be negligible, while indirect 34
substitution effects of product and service innovations seem to occur mainly beyond the firm level. Indirect substitution effects of process innovations seem to depend on the maturity of regulation, i.e. new regulation requires new equipment while older regulation means that equipment already exists and is replaced in the innovation process.
Acknowledgements: Work was funded by the European Commission within the IMPRESS project (contract No: SOE-1-CT-98-1106) of the TSER-Programme (Targeted SocioEconomic Research). We would like to thank our project partners Najib Harabi, Annette Jochem, René Kemp, Anthony Arundel, Leann Chervenic-Poeth, Matteo Bartolomeo, Steve Glynn and Ian Miles and our colleagues Peter Jacobebbinghaus and François Laisney for data support, stimulating discussions and useful comments. 6. References Brouwer, Erik, Alfred Kleinknecht, and Jeroen Reijnen (1993): Employment growth and innovation at the firm level – An empirical study, in: Evolutionary Economics, 3, pp. 153-159. Cleff, Thomas, Klaus Rennings (1999): Determinants of Environmental Product and Process Innovation – Evidence from the Mannheim Innovation Panel and a Follow-Up Telephone Survey. Forthcoming: European Environment, Special issue on Integrated Product Policy, edited by H. Karl and C. Orwat, Vol. 9., No. 5., pp. 191-201. Chennels, Lucy, John Van Reenen (1999): Technical Change and the Structure of Employment and Wages: A Survey of the Micro-Economic Evidence. Working Paper 99/23, Institute for Fiscal Studies: London. Hemmelskamp, Jens, 1997. Environmental Policy Instruments and their Effects on Innovation. European Planning Studies, Vol. 2, pp.. 177-194.
35
Kemp. René, Antony Arundel (1998): Survey Indicators for Environmental Innovation. IDEA (Indicators and Data for European Analysis) paper series 8/1998. STEP Group Norway, htp://www.sol.no/step/IDEA König, Heinz, 1997. Innovation und Beschäftigung. In. H. Vosgerau, H. König (Eds.): Zentrum und Peripherie – Zur Entwicklung der Arbeitsteilung in Europa, Schriften des Vereins für Socialpolitik, Volume 250, pp.149-176. König, Heinz, Herbert Buscher, Georg Licht, 1995. Investment, Employment and Innovation. In: OECD (Ed.), Investment, Productivity and Innovation. Paris, OECD, pp. 67-84. Köppl,
Angela,
Claudia
Pichl
(1997):
Wettbewerbsvorteile
durch
umweltorientierte Innovtionen. Überprüfung der First-Mover-These. Umwelt und Arbeit II. Informationen zur Umweltpolitik Nr. 122 der Arbeitskammer Wien. Kosz, Michael (1997): Integrierter Umweltschutz und Arbeit. Erste Erfahrungen und langfristige Perspektiven. Umwelt und Arbeit III. Informationen zur Umweltpolitik Nr. 123 der Arbeitskammer Wien. OECD, 1997. OECD Proposed Guidelines for Collecting and Interpreting Technological Innovation Data - Oslo-Manual, OECD/Eurostat. Paris. Pfeiffer, Friedhelm (1999): Human Capital and innovation in eastern and western Germany. In: M. Fritsch, H. Brezinski (eds.): Innovation and technological change in Eastern Europe. Edward Elgar, Cheltenham, pp. 142– 166. Pfeiffer, Friedhelm, Klaus Rennings (2001): Employment Impacts of Cleaner Production – Evidence from a German Study Using Case Studies and Surveys. Forthcoming „Business Strategy and the Environment“, Vol 10, part 3 (may/june 2001).
36
Rennings, Klaus (2000): „Redefining Innovation – Eco-Innovation Research and the Contribution from Ecological Economics“. In: Ecological Economics 32 (2000), pp. 319 – 332. Ritt, Thomas, 1999. Integrierter Umweltschutz: Enttäuschend gut! In: UmweltWirtschaftsForum, 7. Jg., H. 2., pp. 24 – 28. Rottmann, Horst, Monika Ruschinski, 1998. The Labour Demand and the Innovation Behaviour of Firms – An Empirical Investigation for West German Manufacturing Firms. In: Jahrbücher für Nationalökonomie und Statistik, Bd. 217/6, pp. 741-752. Smolny, Werner, Thomas Schneeweis, 1999. Innovation, Wachstum und Beschäftigung – Eine empirische Untersuchung auf der Basis des Ifo Unternehmenspanels. In: Jahrbücher für Nationalökonomie und Statistik, Bd. 218/3+4, pp. 453 – 472. Van Reenen, John, 1997. Employment and Technological Innovation: Evidence from U.K. Manufacturing Firms. In: Journal of Labor Economics, 15, pp. 255284.
37
7. Appendix
Table 5: Description of the sample Number of Firms
Share
Small
1203
75.47
Large
391
24.53
Industry/Manufacturing (NACE-Codes D-F) hereby: Manufacturing
906
56.84
736
46.17
Electricity, Gas and Water
33
2.07
Construction
137
8.59
Service (NACE-Codes G-K)
688
43.16
hereby: Wholesale/Retail-Trade 263
16.50
Hotels and Restaurants
2.32
37
Transport, Storage Communication Financial Intermediation
and 156
Real Estate, Renting Business Activity
and 171
9.79
61
3.83 10.73
38
Table 6: Summary statistics of variables used Variable Obs Probability that 1575 employment increased Probability that 1575 employment decreased Product innovation 1592 Service innovation 1591 Distribution system 1592 innovation (reference) Process innovation 1592 Organisational method 1592 innovation Recycling system 1592 innovation End-of-pipe innovation 1592 What percentage of all 1321 employees has a college or university degree? Innovation share larger 1284 than 50% Large firm 1594 Subsidies or grants for 1521 innovation received Sales expectations 1482 positive Change to comply with 1566 environmental regulations UK (reference) 1594 Germany 1594 Switzerland 1594 The Netherlands 1594 Italy 1594 Number of firms 1015 answering all questions (net sample)
39
Mean .093 .027 .174 .118 .085 .363 .129 .318 .318 18.72 .181 .245 .105 .789 .534 .251 .252 .126 .130 .241
Table 7: Reasons to introduce the innovation: rotated factor loadings Reason to Market share Environmental Reduce costs Uniqueness introduce factors innovation Comply to 0.29891 0.78205 0.08074 0.36754 environmental regulations Secure 0.85207 -0.31464 -0.23076 0.26702 existing markets Increase 0.86265 -0.41575 -0.19023 0.25450 market share Reduce costs 0.11952 -0.31658 0.98440 0.03031 Improve 0.49710 0.59486 0.10614 0.59457 firm´s image Respond to a 0.54907 -0.05111 0.09606 0.57204 competitor´s innovation Achieve an 0.54134 0.61711 0.12153 0.54807 accreditation
Table 8: Important competition factors: rotated factor loadings Competition „Hard factors“ „Soft factors“ Uniqueness Factor Price -0.83280 -0.00488 0.30642 Quality -0.76436 0.12803 0.39937 Environmentally -0.8364 0.71760 0.47806 friendly features Innovative -0.12561 0.74468 0.42967 products or services Corporate image -0.32709 0.69171 0.41455 The bold items are attributed to the respective factors. Notice that the first competition factor is negatively correlated with the items price and quality and therefore the signs in the regression also have to be reversed in the interpretation.
40
Table 9: Measuring goodness of fit: predicted and actual employment changes Predicted Increase Unchanged Decrease Total Increase 15 90 0 105 Actual Unchanged 9 874 1 884 Decrease 0 22 4 26 Total 24 986 5 1010
The 893 observations on the main diagonal are predicted correctly by our empirical model, while the other 117 observations are predicted wrongly.
41