The rare gas data in volcanic materials seem to support this interpretation. Relatively low ..... Las Vegas, Nevada, 1973, R.E. Stanley and A.A. Mog- hissi, eds.
Earth Planetary Science Letters, 48 (1980) 284-292 © Elsevier Scientific Publishing Company, Amsterdam - Printed in The Netherlands
284
[61
RARE GAS ISOTOPES AND MASS FRACTIONATION: AN INDICATOR OF GAS TRANSPORT INTO OR FROM A MAGMA ICHIRO KANEOKA
Geophysical Institute, Faculty of Science, University of Tokyo, Bunkyo-ku, Tokyo 113 (Japan)
Received October 24, 1979 Revised version received March 5, 1980
A simple model of mass fractionation may explain the isotopic ratios of rare gases in volcanic materials. Singlestage mass fractionation of atmospheric rare gases predicts an upper limit for 2oNe/22 Ne of 10.3 and a lower limit for 4 o At/36 Ar of 280. The rare gas data in volcanic materials seem to support this interpretation. Relatively low 4°Ar/36Ar ratios, as low as 282, have been observed in recent Japanese volcanic rocks. Such a low 4°Ar/36Ar ratio may be explained by mass fractionation of the atmospheric value if the rare gases represent those which were transported into the magma chamber with other volatile elements. Both the amounts and the fractionated rare gas abundance pattern of lighter elements which are observed in pumices from the recent eruption of Mt. Usu, Southern Hokkaido, Japan, suggest the possibility of air injection into its magma chamber. Thus, the fractionation of rare gases in volcanic materials may be a common occurrence, and it must be considered in models for the origin of isotopic differences between rare gases in volcanic materials and the atmosphere.
1. Introduction Rare gases are characterized by their chemical inertness. This characteristic permits their use as a tool to investigate the physical processes which govern their elemental and isotopic distribution in nature. Thus, rare gases observed in volcanic materials may reflect the physical conditions which produced these volcanic materials. The elemental distribution of rare gases is governed by processes such as diffusion through solids and/or liquids, solubility in magma, partitioning between silicate melt and minerals, adsorption on rock or mineral surfaces, and so on. Isotopic compositions may also be changed by these processes, but generally to a lesser degree. Particularly when a limited exchange is involved, and no equilibrium is reached, isotopic mass fractionation can be prominent. It should also be noted that rare gases often show variations in isotopic composition apart from those
produced by mass fractionation. For example, the 3He/4He ratios observed in submarine pillow basalts [1,2], volcanic gases (e.g. [3]), and ultramafic rocks [4] are an order of magnitude higher than that of the atmosphere, suggesting the occurrence of primordial 3He. The value of the 3He/4He ratio seems to have regional differences [5], and thus may be useful in distinguishing different magma sources. The occurrence of excess 129Xe in terrestrial rocks [6] and CO2 well gases [7] may also provide another feature which can be used to identify the magma source. Other radiogenic components, such as 4He and 4°Ar, directly reflect the state of the distribution of their parent elements. Although information from rare gases may not provide a unique solution, it may impose constraints on the physical processes in volcanic phenomena and the identity of possible magma sources [8]. However, it is necessary to distinguish the effect of isotopic mass fractionation from other isotopic anomalies. In this study, the effect of mass fractionation in
285
volcanic materials and its application to volcanology are demonstrated by example.
•
103
/
-~///I
2. Mass fractionation of rare gases in volcanic materials
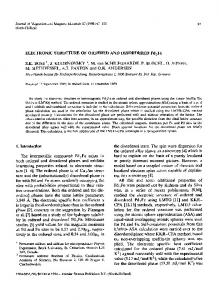
,00 When gases enter and/or degas from a magma source through a very narrow conduit, it is expected that they may experience isotopic fractionation. Such mass fractionated rare gases have been found in volcanic materials [9,10]. We will consider a very simple model to characterize the effect. A part of the gas is lost from an original reservoir, undergoing mass fractionation, and creating two reservoirs: the diffusive gas and the residual gas. If we consider two isotopes, the lighter isotope will be enriched in the diffusive gas and depleted in the residual gas. The degree of mass fractionation in each reservoir can be expressed as a function of the fractional retention of gas in the original reservoir. It should be noted that a limit exists in the degree of mass fractionation in the diffusive gas, as long as a single-stage fractionation process is considered. This limit is very close to (m2[rn01/2, where m t and mz are the respective masses of each isotope. There is no corresponding limit to the isotopic ratio in the residual gas, but in practice, we could not detect a very small amount of residual gas and other factors may limit the value of the ratio. For the 3He/4He ratio, the maximum enrichment of the ratio by a single mass fractionation process is less than 16% in the diffusive gas. Hence, it is difficult to explain the high 3He/4He ratios observed in pillow basalts and volcanic gases by mass fractionation of atmospheric He, since they frequently are an order of magnitude higher. On the other hand, a decrease in the 3HefiHe ratio by more than 50% is possible in the residual gas by the mass fractionation process. Since He has only two isotopes, however, it is difficult to identify unambiguously the effects of isotopic mass fractionation as long as we observe only the 3He/4He ratio. In the case of Ne, we can check the occurrence of isotopic mass fractionation by correlation of ZONe/ 22Ne with 21Ne/22Ne. Fig. 1 shows Ne compositions for all available published data on volcanic materials recently extruded on the surface such as pillow
+ O.g 0.6
9.5
9.0
21Ne/22Ne Fig. 1. The 2°Ne/22 Ne ratio versus the 21 Ne/22 Ne ratio observed in volcanic materials: • = volcanic rock; • = gas from the thermal area including fumarolic gas. The mass fractionation line through the atmospheric Ne is drawn as a solid line. The dotted line is its extension for multiple-stage mass fractionation. The numerical figures on the mass fractionation line correspond to F, defined as the ratio of the volume of the residual gas to that of the original gas, in the case of single mass fractionation from the atmospheric Ne. "A" denotes the atmospheric values. Data sources: Anufriev et al. [11], Bochsler and Mazor [12], Craig and Lupton [13], Hennecke and Manuel [14,15], I. Kaneoka and N. Takaoka (unpublished, 1977), Nagao et al. [10].
basalts, fumarolic gases, volcanic rocks and others. Most data lie approximately on the mass fractionation line which goes through atmospheric Ne (2°Ne/ 22Ne = 9.81,21Ne/22Ne = 0.0290 [16]). If only a single mass fractionation process controls the trend, the 2°Ne/22Ne and 21Ne/22Ne ratios should have maximum values of about 10.3 and 0.0297, respectively, assuming that the original Ne has atmospheric isotopic compositions. Except for one sample, the 2°Ne/~2Ne ratios observed in the most seriously fractionated volcanic materials show approximately the values for single-stage fractionation. In the case of the 21Ne/22Ne ratio, however, the addition of a nuclear
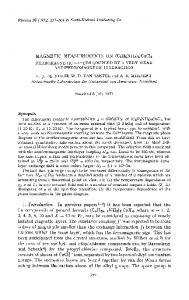
286 component at 21Ne, produced by the i SO(t~,n)21Ne reaction may produce higher values of 21Ne/22Ne than expected from simple fractionation. To explain such a trend for terrestrial Ne isotopes, a mixing between solar wind Ne-B and Ne-E has been suggested [17]. Since the mixing line is close to that expected from fractionation, and the analytical uncertainty in Ne isotopes is relatively large, it is difficult to identify which mechanism is more reasonable from the trend in the Ne isotopic ratios alone. However, when Ar isotope data are available for a sample whose Ne isotopes deviate from the atmospheric values, Ar isotopes also show the deviation expected from mass fractionation [ 10]. Hence, although a mixture of solar Ne and Ne-E or the occurrence of excess 2°Ne [I 3] cannot always be excluded as a possible explanation for high 2°Ne/22Ne ratios, we can also explain the observed data by a simple mass fractionation process. For Ar isotopes, a similar trend is expected. Starting with atmospheric Ar, the lower limits for the 4°Ar/a6Ar and 38Ar/S6Ar ratios in the diffusive gas are expected to be about 280 and 0.182, respectively, assuming a single mass fractionation process. In Fig. 2, available Ar isotope data reported so far on recent volcanic materials are shown, together with the mass fractionation line. They approximately lie on the mass fractionation line. Furthermore, it is noteworthy that the lowest 4°Ar/36Ar ratio observed in these rocks is close to 280, the value predicted for single-stage fractionation. Hence, as suggested by Krummenacher [9], Ar isotope data observed in recent volcanic materials can often be explained by mass fractionation of atmospheric argon. By the same procedure, we can also predict limiting values for Kr and Xe isotopic ratios in diffusive gas phases, assuming single-stage mass fractionation of originally atmospheric composition (i.e. 7aKr/a6Kr = 0.0204, 124Xe/la6Xe = 0.0108). The calculated results (TaKr/a6Kr = 0.0213, 124Xe/la6Xe = 0.0114) are comparable to those observed in some soil gases in a geothermal area in Japan [10], which have apparently suffered extreme isotopic fractionation. One sample (A-15) shows 7aKr/a6Kr = 0.02108 +- 0.00027 and l~-4Xe/la6Xe = 0.0114 + 0.004 and another sample (A-31) 7aKr/a6Kr = 0.02096 + 0.00036 and 124Xe/la6Xe = 0.0114 +- 0.0004, with 2°Ne/22Ne ratios of 10.29 + 0.06 and 10.33 + 0.10, respectively
/.OAr 04
310
0.a/ .¢o" •
°
,IT, ,.17'5
0.180
oJss
S8A.~6Ar
ojgo
Fig. 2. The 4°Ar/36Ar ratio versus the 3SAr/a6Ar ratio for recent volcanic materials. Symbols are the same as those in Fig. 1. The mass fractionation line through the atmospheric Ar is drawn as a solid line. The meanings of the dotted line and the numerical figures on the mass fractionation line are the same as described in the caption of Fig. 1. Data sources: Krummenacher [91, Hennecke and Manuel [14], Nagao et [ 10 ], I. Kaneoka and N. Takaoka (unpublished data, 1977), M. Honda, K. Nagao and N. Takaoka (unpublished data, 1978).
[10]. These values agree well with those expected from the calculation. However, the number of recent volcanic materials for which isotopic ratios o f several rare gases have been measured simultaneously are very limited. Furthermore, the relationships of isotopic mass fractionation between different rare gases are liable to be disturbed by contamination with atmospheric gases. Hence, no further attempt is made to compare the general trend of isotopic mass fractionation among each rare gas. If we assume atmospheric composition for the original gas and a single-stage fractionation process, we may estimate the fraction of gas that escaped into the diffusive gas phase. Certainly, we cannot unambiguously separate the mass fractionation trend
287 from all possible mixing trends. However, the limiting value of each isotopic ratio can pose a constraint on its origin. If a sample shows isotopic ratios which exceed the limit expected from a single-stage fractionation, but still lie on a mass fractionation line, multiple-stage mass fractionation is suggested. However, most reported values lie within the limit expected for each isotopic ratio. This suggests that even if multiplestage mass fractionation processes may occur in nature, they are not a common occurrence in most volcanic materials.
3. Ar isotopes of recent Japanese volcanic rocks and pumices In order to study the characteristics of rare gases in volcanic materials from an island arc region, Ar isotopes were measured for recent volcanic rocks and pumices from Japan. To avoid the effect of radiogenic components, samples which erupted very recently were used. Two- or three-stage stepwise analyses (700, 1000 and/or 1300°C, one hour) were adopted to separate the effect of secondary components. Ar isotopes were measured on a Reynoldstype mass spectrometer with a Faraday cup. Gas amounts were measured by the peak height comparison method. Since the Ar extraction and the measurement of Ar isotopes were made in separated systems, direct application of blank corrections would be not appropriate. Hence, blank corrections were not made in the present measurements. Instead, sample amounts were increased, when necessary, from about 3 g up to as much as 14 g so that blanks might not affect the observed values significantly. Results are given in Table 1. Numerical figures in parentheses for each sample indicate the data of eruption. As seen in the results, blanks correspond mostly to less than a few percent of the amount of gas released at each temperature. It is seen that some samples have 4°Ar/a6Ar ratios lower than the air value. The lowest 4°Ar/a6Ar ratio, about 282, was observed for O-shima 1951 lava in the 1300°C fraction. Even the total 4°Ar/a6Ar ratio for this sample shows a low value, about 284. In this study, 38Ar/ 36A£ratios were also measured. Although the observed aaAr/36Ar ratios in these rocks seemed to fol-
low mass fractionation as a trend, they also showed signs of memory from aSAr spikes and/or neutron produced 38Ar. Hence, the 38AE/36A~ratio is not included in Table 1. A similar 4°Ar/a6Ar ratio of 285 -+ 5 has been observed for a sample from the same O-shima 1951 lava flow with a 38Ar/36Ar ratio of 0.183 -+ 0.003 (total melt; M. Honda, K. Nagao and N. Takaoka, personal communication, 1978). The pumice from Sakura-jima also shows a lower 4°Ar/ 36Ar ratio than that of the atmosphere. Krummenacher [9] also observed lower 4°Ar/36Ar and 38Ar/ 36Ar ratios than those of the atmosphere in the Sakura-jima lava flows. His results are consistent with the value expected by mass fractionation of atmospheric argon. Hence, the apparent low 4°Ar/a6Ar ratios observed in recent volcanic rocks and pumices in the present study probably relate to the mass fractionation of the atmospheric values.
4. Comparison of 4°Ar/a6Arratios and Ar contents in recent Japanese volcanic rocks and pumices In Fig. 3, a°Ar/a6Ar ratios observed in recent volcanic rocks and pumices from the Japanese Islands are plotted versus their 4°Ar contents. This figure includes the present data and all other published data. Fig. 3 indicates that not a few samples show lower 4°Ar/36Ar ratios than that of the atmosphere. As discussed above, the low 4°Ar/a6Ar ratios in recent volcanic rocks and pumices from Japan can probably best be explained by mass fractionation of atmospheric Ar. Three separate processes can be considered where fractionation might occur: (1) diffusion of gas into the magma from surroundings at the depth, (2) diffusive escape from the magma, and (3) diffusion of atmospheric gas which may enter the cooling magma. Process (2) is inadequate to explain low 4°Ar/36Ar ratios in the samples. Furthermore, the amounts of 4°Ar observed in many volcanic rocks and pumices are larger than expected from the solubility of Ar in the air under 1 atm in an enstatite melt at 1500°C [18] (cL Fig. 3). Recent measurement of the solubility of Ar in a basalt melt at 1200°C also shows a value similar to that of the enstatite melt (A. Hayatsu, personal communication, 1979). Hence, process (3) is also unlikely to explain the observed low 4°Ar/a6Ar
288 TABLE 1 Ar in modern volcanic rocks and pumices from Japan Sample
T (°C)
4OAr
4OAr/a6Ar
(X 10 -8 cm 3 STP/g) Asama Onioshidashi lava (1783) (andesite) 7.390 g
700 1300 Total
14.8 24.6 39.4
291.0 ± 3.9 289.1 ± 1.4 289.8 t 2.3
O-shima 1951 lava (1951) (basalt) 13.597 g
700 1300 Total
8.8 29.1 37.9
290.2 ± 1.3 282.2 ± 1.3 284.1 ± 1.3
Akita Komagatake lava (1970) (andesite) 3.086 g
700 1300 Total
163 89.9 252.9
290.6 -+ 0.8 304.5 +- 1.5 295.5 _+ 1.0
Sakura-jima pumice (1977) (dacite) (KS770720) 3.936 g
700 1000 1300 Total
329 526 371 1226
700 1300 Total
278 272 550
293.0 ± 1.5 297.2 -+ 2.0 295.1 -+ 1.8
700 1000 1300 Total
234 126 13.4 373.4
294.8 296.8 299.2 295.6
700 1300 Total
2310 2670 4980
295.6 ± 2.3 296.3 -+ 1.2 295.6 ± 1.8
700 1000 1300 Total
3670 113 >3783
296.6 ± 1.1 300.2 -+ 1.5 296.7 +- 1.1
Usu, pumice (1977) (dacite) (SA77080901; Big IV) I. 3.857 g
II. 3.005 g
Usu, pumice (1977) (dacite) (SA77080902; Big I) I. 4.077 g
II. 2.621 g
(1) (2) (3) (4)
287.7 285.3 284.1 285.6
_+2.3 ± 4.6 ± 2.7 ± 3.4
_+ 1.4 -+ 0.7 +_3.3 _+ 1.3
The uncertainty in the 4°Ar content is about 30%. The 4°Ar/36 Ar ratio is corrected for mass discrimination in the mass spectrometer. ± in the 4°Ar/36Ar ratio means one standard deviation. Blanks were estimated to be about (2 ~ 8) x 10 -8 cm 3 STP 4°Ar, depending on extraction temperatures (700 ~ 1300°C).
ratios in t h e J a p a n e s e volcanic rocks and p u m i c e s . Thus, process (1) remains as a possibility.
shallow crustal materials w h i c h c o n t a i n a t m o s p h e r i c gases. Such volatiles will be a d m i x e d w i t h t h e mag-
The mass f r a c t i o n a t i o n w h i c h l o w e r e d the appare n t 4°Ar/36Ar ratio p e r h a p s o c c u r r e d during t h e
m a t i c volatiles. I f t h e a m o u n t s o f f r a c t i o n a t e d atmospheric gases are large c o m p a r e d t o m a g m a t i c gases, t h e o b s e r v e d values s h o u l d be close t o t h e f o r m e r .
gathering o f volatiles i n t o a m a g m a f r o m relatively
289 310[
z,OAr [ 36Ar I
more frequent in Japan than elsewhere [9,19]. This may be characteristic of volcanic activity in an island
I
I I
arc region.
I
300[ ;I I
295.51 ~ A~R 1 ,~oI~,
~-~g~' ~ c~:~
~ 1 1 g771
I
~
~67
1oS
,o-S
:!977
40At
1d-4 c~srpjg
~°-3
Fig. 3. The 4°Ar/a6Ar ratio versus the 4°Ar content for recent volcanic rocks and pumices from the Japanese Islands. The different symbols represent different localities: A, AO = O-shima; . A = Asama; z~Ao = Aso; , , S= Sakura-jima; • K = Komagatake, Akita; t~U1, U2 = Mr. Usu. Open symbols designate acidic volcanic rocks including pumices; closed symbols, basic volcanic rocks. Numerical figures in the parentheses indicate the year of eruption. A dashed line through E on the air line represents the amount o f 4°Ar in an enstatite melt at 1500°C expected from the solubility data by Kirsten [18] at air pressure of 1 atm. Data sources: Dalrymple [19], Krummenacher [9] and the present study (designated with a bar under each letter symbol).
The gas content will strongly depend on the circumstances of the uppermost magma reservoir. Low 4°Ar/36Ar ratios are typical for recent volcanic rocks and pumices from the O-shima and the Sakura-jima. This suggests that the uppermost magma reservoirs for these volcanoes are relatively shallow and easily affected by the intrusion of gases from such sources as relatively young sediments and/or volcanic rocks sintered with atmospheric rare gases. Relatively. low 4°Ar/36Ar ratios also suggest that only a small portion of the original rare gases has been concentrated into the magma. This may imply that the volume of ambient atmospheric rare gas sources are relatively large. This probably reflects the characteristics of the locality for these volcanoes. Furthermore, it should be noted that the absolute value of the 4°Ar/36Ar ratio is likely to be vary in each eruption even for the same volcano and may be disturbed by atmospheric contamination. Even so, however, the trend in the variation of the 4°Ar/36Ar ratio is maintained, and it is characteristic of the uppermost magma chamber. Low 4°Ar/36Ar ratios in volcanic rocks seem to be
In Fig. 3, the amount of 4°Ar observed in volcanic rocks and pumices are also shown. Pumices contain larger amounts of rare gases than basic volcanic rocks. In stepwise heating, pumices retain relatively large amounts of gases at high temperatures, i.e. the rare gases in pumices are tenaciously retained. However, the 4 ° A r / a 6 A r ratio in these pumices suggest that they are mostly composed of rare gases of atmospheric composition. The 4°Ar/36Ar ratios of pumices from the Sakura-jima show signs of mass fractionation, but those of Mr. Usu do not. These results suggest that the mass fractionation process may be mainly related to the ambient source materials.
5. Elemental fractionation of rare gases
Elemental fractionation of rare gases occurs much more easily than isotopic mass fractionation in volcanic materials, in reflection of the different atomic size of each rare gas element. For example, in volume diffusion He diffuses much faster than Ne, which diffuses faster than Ar. Hence, if only a portion of rare gases from the source materials is observed, it will show an elemental fractionation. Such an example is shown in the 1977 volcanic pumice from Mt. Usu, Southern Hokkaido, Japan. The rare gas concentrations were measured on a quadre-pole mass spectrometer. They were analysed with an on-line system. The concentrations were determined by the peak height method with a calibrated air standard. The results are shown in Table 2. Fig. 4 shows rare gas elemental pattern for this sample. Normalized to atmospheric rare gases, the pattern shows a slight fractionation favoring the lighter gases except for He. In pumices from Lipari, a similar trend is observed, though Kr and Xe were not measured [12]. It differs from the pattern for atmospheric rare gases dissolved in water or enstatile melt. Furthermore, rare gas concentrations are one or two orders of magnitude larger than those expected from the solubility of rare gases into enstatite melt. The apparent depletion of He compared to the amount expected from the fractionation trend is probably due to selective loss of He from the magma during
290 TABLE 2 Rare gas concentrations * in a pumice sample of Mt. Usu, Hokkaido, Japan Sample
4He
T (°C)
2ONe
36Ar
(X 10-8 cm3 STP/g)
84Kr
132Xe
(X 10-1° cm3 STP/g)
SA77081301 (Big IV) 700 3.049 g 1400
0.33
2.5 0.11
1.4 0.70
1.6 1.4
0.064 0.034
Total
0.33
2.61
2.10
3.0
0.098
700 1400
0.30 0.40
0.05 0.08
0.01 0.03
0.02 0.1
0.002 0.012
Blanks (45 minutes)
* Rare gases were measured on a quadre-pole mass spectrometer. Their concentrations were determined by the peak height method with about 30% uncertainty, using a calibrated air standard. All tabulated data were corrected for blanks.
Fm
10
a
Fm..(mx/36Ar)sampte -(mx/36Ar)cli r
//x\
>-
\
• USU, PUMICE(Big IV) x LIPARI, PUMICE e AIR a WATER z~ ENSTATITE MELT
0.1
!
,
,
4He 22Ne36Ar
i
i
84Kr
132Xe
Fig. 4: Rare gas abundance pattern in a pumice from Mt. Usu, erupted in August, 1977 (Big IV), compared with other samples as indicated. F m is defined a s (mx/36 Ar)sample/ (mx/a6Ar)air, where m is the mass number of an element X. • = pu/hice (Big IV) from Mt. Usu; X = pumice from Lipari [12] ; o = air; t~ = rare gases dissolved in water at 20°C from the 1-atm air [20] ; ~ = rare gases dissolved in an enstaUte melt at 1500°C from the 1-atm air [18].
cooling. As shown in Table 1, the 4°Ar/a~Ar ratios observed in this pumice (Big IV) are almost atmospheric. Furthermore, many bubbles are observed in the pumices under a microscope. These observations suggest a probable air injection into a magma. One may argue that the observed bubbles might have occurred by the vesiculation of water which had mixed up with the magma in the magma chamber. In such a case, the groundwater is generally considered to be the source of the water. However, the rare gas abundance pattern does not support this conjecture. Although rare gas solubility in water depends on the temperature [2], the relative abundance,pattern is ~, not changed seriously at least up to about 80 ~ 90°C. A problem arises, then, as to where such an air injection into the magma occurred. Concerning this problem, a very interesting relationship is observed between the amount of Ar retained in pumices and the degassing rate of Rn estimated from the breakdown of the equilibrium state of the 22eRa322Rn series. As shown in Table 1, the total amount of 4°At is quite different for samples Big IV and Big I, which were ejected in different eruptions. The amount of 4°Ar in Big I is about one order of magnitude larger than that of Big IV. The results for the 226Ra222Rn series for these pumices indicate that Big IV clearly shows evidence of Rn loss during eruption while sample Big I shows no sign of Rn loss [21 ]. This trend agrees quite well with the amount of 4°Ar observed in these samples. This correlation suggests
291 that the original amount of 4°Ar in these pumices was controlled in the magma chamber. Rn can be produced in the magma chamber from the a.decay of the U series, whereas the amount of Rn in the air is almost negligible compared to that observed in samples. Hence, the injection of atmospheric rare gases into the magma probably occurred in the magma chamber. This suggests the occurrence of a space idled with the atmospheric rare gases in the magma chamber. Such an air injection into a magma is not a well-known phenomenon. However, similar air bubbles have been observed in a glassy spatter of Kilauea, in which case air injection probably occurred at almost the surface [22]. In the case of pumices of Mt. Usu, no enrichment of lighter Ar isotopes has been observed. Hence, an air injection into a magma may only cause elemental fractionation and not cause isotopic mass fractionation. This study summarizes one aspect of the application of rare gas data to gas transport into or from a magma and indicates that the fractionation of rare gases is often observed in volcanic materials. Hence, when considering the isotopic differences from the atmospheric values, one should be careful to identify the effects of mass fractionation.
Acknowledgements The author is grateful to Prof. S. Aramaki and Dr. K. Sato of the Earthquake Research Institute, University of Tokyo for supplying him with some samples used in this study. He also thanks Profs. O.K. Manuel of the University of Missouri-Rolla, M. Ozima of the University of Tokyo and F.A. Podosek of Washington University for offering helpful comments on the manuscript. It has benefited greatly by the constructive review by Prof. J.H. Reynolds of the University of California, Berkeley. This work has been supported by the Ministry of Education under grant No. 464120.
References 1 A.Ya. Crylov, B.A. Mamyrin, L.V. Khabarin, T.I. Mazina and Y.A. Silin, Helium isotopes in the basic rocks of the
ocean floor, Geokhimiya 8 (1974) 1221-1226 (in Russian). 2 J.E. Lupton and H. Craig, Excess 3He in oceanic basalts: evidence for terrestrial primordial helium, Earth Planet. Sci. Lett., 26 (1975) 133-139. 3 B.A. Mamyrin, V.I. Gerasimovsky and L.V. Khabarin, Helium isotopes in rocks of East Africa and Iceland rift zones, Geokhimiya 5 (1974) 693-700 (in Russian). 4 I.N. Tolstikhin, B.A. Mamyrin, L.V. Khabarin and E.N. Erlikh, Isotope composition of helium in ultrabasic xenoliths from volcanic rocks of Kamchatka, Earth Planet. Sci. Lett. 22 (1974) 75-84. 5 H. Craig, J.E. Lupton and Y. Horibe, A mantle helium component in circum-Pacific volcanic gases: Hakone, the Marianas, and Mt. Lassen, in: Terrestrial Rare Gases, E.C. Alexander, Jr. and M. Ozima, eds., Cent. Acad. Publ. Japan, Tokyo (1978) 3-16. E.W. Henneeke and O.K. Manuel, Noble gases in a Hawaiian xenolith, Nature 257 (1975) 778-780. 7 M.S. Boulos and O.K. Manuel, The xenon record of extinct radio activities in the earth, Science 174 (1971) 1334-1336. I. Kaneoka and N. Takaoka, Excess 129Xe and high 3He/ 4He ratios in olivine phenocrysts of Kapuho lava and xenolithic dunites from Hawaii, Earth Planet. Sci. Lett. 39 (1978) 382-386. D. Krummenacher, Isotope composition of argon in modern surface volcanic rocks, Earth Planet. Sci. Lett. 8 (1970) 109-117. 10 K. Nagao, N. Takaoka and O. Matsubayashi, Isotopic anomalies of rare gases in the Nigorikawa geothermal area, Hokkaido, Japan, Earth Planet. Sci. Lett. 44 (1979) 82-90. 11 G.S. Anufriev, I.L. Kamenskii and V.P. Pavlov, Anomalous isotopic composition of neon in hot-sPrings of modern volcanic zones, Dokl. Acad. Nauk USSR 231 (1976) 1454-1457. 12 P. Bochsler and E. Mazor, Excess of atmospheric neon in pumice from the Islands of Lipari, Nature 257 (1975) 474-475. 13 H. Craig and J.E. Lupton, Primordial neon, helium and hydrogen in oceanic basalts, Earth Planet. Sci. Lett. 31 (1976) 369-385. 14 E.W. Hennecke and O.K. Manuel, Noble gases in lava rock from Mount Capulin, New Mexico, Nature 256 (1975) 284-287. 15 E.W. Hennecke and O.K. Manuel, Nobel gases in CO2 well gas, Harding County, New Mexico, Earth Planet. Sci. Lett. 27 (1975) 346-355. 16 P. Eberhardt, O. Eugster and K. Marti, A redetermination of the isotopic composition of atmospheric neon, Z. Naturforsch. 20 (1965) 623-624. 17 I.N. Tolstikhin, A review: some recent advances in isotope geochemistry of light rare gases, in: Terrestrial Rare Gases, E.C. Alexander, Jr. and M. Ozima, eds., Cent. Acad. Publ. Japan, Tokyo (1978) 33-62. 18 T. Kirsten, Incorporation of rare gases in solidifying enstatite melts, J. Geophys. Res. 73 (1968) 2807-2810.
292 19 G.B. Dakymple, 4°A~/36Ar analyses of historic lava flows, Earth Planet. Sci. Lett. 6 (1969) 47-55. 20 C. McKinley, An overview of the physical-chemical properties of the noble gases, in: Ptoc. Symp. Noble Gases Las Vegas, Nevada, 1973, R.E. Stanley and A.A. Moghissi, eds. (1973) 391-404. 21 K. Sato, J. Sato, S. Asamaki and H. Kanaya, Radon release observed in the 1977 ejecta from the Usu volcano,
Hokkaido, Bull. Volcanol. Soc. Jpn., 2nd Ser., 24 (1979) 73-74 (in Japanese). 22 I. Kaneoka, N. Takaoka and K. Aoki, Rare gases in mantle derived rocks and minerals, in: Terrestrial Rare Gases, E.C. Alexander, Jr. and M. Ozima, eds., Cent. Acad. Publ. Japan, Tokyo (1978) 71-83.