to the process of the slow intrusion or extrusion of liquid mercury in the porespace .... interaction between the adsorbed gas and the adsorbent solid, rather than.
3. PROBING PORE STRUCTURES BY SORPTION ISOTHERMS AND MERCURY POROSIMETRY
Yanis C. Yortsos Department of Chemical Engineering and Petroleum Engineering Program University of Southern California Los Angeles, California
3.1 Introduction The objective of this chapter is to provide a review of the use of (physi)sorption isotherms and mercury porosimetry to identify geometric and pore-structural parameters of porous media. Physisorption refers to the reversible adsorption or desorption of a gas in a porous medium at constant temperature, as a result of an incremental increase or decrease of its pressure, respectively. Its origin is the binding of the gas molecules at the solid surface, typically by van der Waals forces. Mercury porosimetry refers to the process of the slow intrusion or extrusion of liquid mercury in the porespace of a porous medium in response to an incremental increase or decrease in the applied pressure, respectively. This process is also controlled by interfacial (capillary) forces at the advancing or receding interface. Adsorption and mercury extrusion conceptually correspond to the displacement of a nonwetting phase (vapor or mercury, in the respective processes) by a wetting phase (liquid or air, respectively). This is also known as an imbibition process. Conversely, the processes of desorption and mercury intrusion conceptually correspond to the displacement of a wetting by a nonwetting phase, also known as drainage. The information on the pore structure is obtained from the inversion of experimental isotherms and measuring the mass or volume adsorbed or penetrated in sorption or mercury porosimetry, respectively, as a function of the applied pressure. The two methods have been widely used in the past and they constitute standard surface science tools for porous media characterization [1- 51. In the absence of other information on the history of the pore-structure evolution (whether chemical, biological, or geological), the task of providing a complete representation of the pore structure is very complex. Typically, two main variables are probed: the (accessible) pore surface and the “pore-size’’distribution. Information on the pore surface can be provided by 69 EXPERIMENTAL METHODS IN THE PHYSICAL SCIENCES Vol. 35 ISBN 0-12-475982-3
Copyright Q 1999 by Academic Press All rights of reproduction in any form reserved. ISSN 1079-4042/99 $30.00
70
PROBING PORE STRUCTURES
the adsorption of single-component gases at low pressures or by mercury porosimetry at high pressures. Under these conditions, the surface may be unfolded into an object that can be studied independently of the complicated three-dimensional pore structure. Here, the key task is to relate the experimental measurements to quantities such as the surface area per unit mass, its roughness, or its fractal characteristics, if appropriate. In this context, the surface is often modeled as a statistically self-affine object. For the characterization of porous media containing mesopores or macropores (see later in this chapter), sorption processes at relative pressures in the capillary condensation regime or mercury porosimetry at relatively low pressures, respectively, are used. The accurate interpretation of these measurements, however, requires the representation of the porespace in terms of a pore network. The latter is described by the size distribution of pore bodies and pore throats, their connectivity, and their spatial correlations. The use of network theories, such as percolation theory [6] and its variants, can be quite beneficial in this context. The information extracted from sorption or mercury porosimetry experiments is based on the analysis of a few isotherms. A forward and an inverse problem must be formulated. The forward problem involves the modeling of the process assuming a certain representation of the porous medium. The inverse problem involves identifying the assumed properties of the porous medium by inverting the experimental measurements. Because the latter reflect the integrated response of the system, which is also influenced by heterogeneities in geometry, size, connectivity, and accessibility, the inversion of the experimental isotherms is not unique. The corresponding limitations are important and are addressed in this chapter. Even though the information on the pore structure is not as detailed as one may desire, sorption and mercury porosimetry methods can be quite useful for porous media characterization, provided that their strengths and limitations are properly recognized. This chapter is organized as follows: First, background material is provided on porous media description with a focus on the pore surface and the pore network, and on the basic aspects of sorption isotherms and mercury porosimetry. The next section deals with the characterization of the pore surface and its chemical and geometric heterogeneity. We discuss adsorption over a surface (or, equivalently, adsorption in a porous medium at low relative pressures) and capillary invasion at high capillary pressures to identify pore surface characteristics. Multilayer adsorption and condensation are also reviewed. The next section involves sorption processes and capillary invasion in single pores and pore networks. We review fundamentals of capillary condensation in confined geometries and capillary equilibria and discuss their applicability for infering pore-size distributions. The use of
BACKGROUND
71
percolation approaches to interpret the effect of the pore network on sorption isotherms and mercury porosimetry data is particularly emphasized. Various issues related to pore and throat size distributions and their spatial correlations are also discussed.
3.2 Background Understanding the macroscopic behavior of sorption isotherms and capillary phenomena in porous media requires conceptual models of the pore surface and the pore structure. In general, porous media and pore surfaces are geometrically and chemically heterogeneous, as a result of their formation and evolution history [7,8]. For example, porous materials prepared by methods such as coagulation, controlled growth, precipitation, or aging have different geometric and chemical properties, in general. The same is true for geologic porous media, the particular history of the formation of which (sedimentation, compaction, diagenesis, etc.) leads to specific pore-structural characteristics. Given the large diversity in these media, an inclusive description, although desirable, is rather impractical. Here, we comment instead on the representation of two key aspects of porous media- the pore surface and the pore network-the identification of some of the properties of which are the objectives of sorption isotherm and mercury porosimetry methods. Following this description, basic experimental procedures in adsorption-desorption processes and in mercury porosimetry are reviewed.
3.2.1 Representation of Porous Media Pore surfaces are, in general, rough with features in the form of cavities, peaks, and pits at various scales. For the purposes of this section, we assume that the surface can be unfolded into a topologically two-dimensional object, so that its height z can be expressed as a function of local Cartesian coordinates x and y (Fig. l), namely,
z = h(x, y).
(1)
The function h certainly depends on the history of the formation of the surface. An increasing amount of evidence has accumulated (e.g., see reviews by Barabasi and Stanley [9] and Halpin-Healy and Zhang [lo]), suggesting that surfaces evolving from various different processes (from molecular beam epitaxy to displacements in random media) are actually self-affine fractals (Fig. 1). Self-affinity is a generalization of self-similarity (which is more commonly associated with a fractal description, see Mandelbrot [l 13,
72
PROBING PORE STRUCTURES
.._"
350
150
FIG. 1. Schematic description of a pore surface as a self-affine surface of the fBm (fractional Brownian motion type) with H = 0.7. Two different regimes corresponding to two different scales are shown.
in that self-affine objects preserve statistical similarity only if their scaling response is different in different directions. For example, a self-affine surface of the type of Eq. (1) satisfies the anisotropic scaling z
- bH1 h(bx, by), -
BACKGROUND
73
where b > 0 is the scale expansion (or reduction). The affine exponent, H ( 0 < H < l), is known as the Hurst or Holder exponent [12] and reflects the relative roughness, surfaces with higher values of H being smoother with long-range trends. In the preceding, we implicitly assumed isotropy in the x and y directions. Barabasi and Stanley [9] have reviewed the various mechanisms, including ballistic deposition, solid-on-solid models, propagation of interfaces, that lead to the formation of self-affine surfaces. An important characteristic of self-affine objects is that their scaling behavior is different, depending on the range investigated [12-141 (Fig. 1). In general, two limiting regimes exist: a local one at small length scales, 6 > 6,,, where the surface is not fractal (of dimension d, hence equal to 2 for a surface). The crossover length 6,, demarcates the two regimes. Recall that in real systems, fractal behavior is typically displayed in a finite region, between upper and lower cutoff scales d,, and dl,, respectively. In this region, the measured surface area is not a constant, but varies depending on the ruler used for its measurement, according to the power law:
+
S(6)
- 62-D,
d,, < 6 < dup.
(3)
This is the behavior expected in the local regime of a self-affine surface. Adamson [2] was among the first to recognize the relevance of a multiscale, fractal description in the context of surface chemistry. Pioneering work in the application of fractal concepts to porous media was also conducted by Feder [12], Avnir [lS], and de Gennes [16]. Neimark [141 investigated the characterization of self-affine surfaces in the global regime and considered the scaling of the excess area Sex(namely, that in excess over a reference planar surface), of smoothed surfaces, obtained from the actual rough surface after small-scale fluctuations below a smoothing scale Axs are eliminated. In particular, he considered the scaling of Sexwith the mean radius of curvature of the smooth surface 6, and demonstrated the scaling behavior
in the two limiting regimes of self-affinity, respectively. Note that the first scaling is the same with that for a self-similar surface [Eq. (3)] in the local regime (where D = 3 - H ) . However, the scaling of Sexin the global regime is different. Neimark [14] noted that the latter exponent is more properly
74
PROBING PORE STRUCTURES
related to an “excess dimension,” 2 + [2(1 - H ) ] / ( 2 - H ) , rather than to a fractal dimension. Related are the observations of Pfeifer and Cole [17] who argued that in the regime of self-similarity, any fractal dimension obtained experimentally must be the local fractal dimension 3 - H and that a different exponent should apply in the global regime (but see also Kardar and Indekeu [18]). The fact that self-affine objects involve power-law scalings in various regimes makes self-affinity a good working model for surface roughness. Its implications to sorption at low pressures and mercury porosimetry at high pressures are discussed in the next section. In addition to the pore surface, sorption and mercury intrusion are significantly affected by the three-dimensional aspects of porous media, specifically the characteristics of pores and throats: their size distributions, connectivity, and spatial correlation (see the schematic in Fig. 2). For a detailed geometrical description, consult references such as Dullien [4] and Adler [19]. In the context of sorption, IUPAC has recommended the following classification of pores based on their size: Micropores with sizes in the range 6 2 nm Mesopores with sizes in the range 2-50 nm Macropores with sizes in the range 3 50 nm However, Balbuena and Gubbins [20] have argued in favor of a different classification, which would also depend on the particular intermolecular interaction between the adsorbed gas and the adsorbent solid, rather than size alone. For the purposes of this chapter, we model the local pore geometry in terms of a converging-diverging cross section, which is the simplest model for describing fundamental aspects of equilibrium and transport in porous media [4,21,223 (Fig. 2). We define pores (also termed sites or cavities or chambers) as the geometrical elements in which an inscribed sphere has the locally largest radius; and throats (also termed bonds or windows or necks) as the elements joining adjacent sites, and which are characterized by the locally smallest radius of an inscribed sphere (Fig. 2). Pores contain most of the information on volume (or capacity) and they are most important in adsorption and extrusion (imbibition). Throats contain mostly information on transport properties and they are important in desorption and mercury intrusion (drainage). The statistical distributions of pore and throat sizes are described by the two cumulative probability density functions
75
BACKGROUND
,
FIG.2. Schematic of a porous medium. Highlighted are the converging-diverging geometry nature of the cross sections and the pore-network representation of the porespace.
respectively, where cli ( r ) ( i = s, b for site or bond) is the respective probability density function. (We also ocasionally denote by r, or rb the corresponding sizes.) In many applications, it is these two probability functions that are needed for a basic formulation of forward and inverse problems. A variety of other models have also been used in the literature [23-261. Geometric,
76
PROBING PORE STRUCTURES
volume, transport, and capillary properties associated with these elements can be distributed randomly or by spatial correlation. In some applications, however, additional simplifications are introduced. In the context of adsorption, for example, Seaton and coworkers [27-321 take the porous medium to consist of pores of a slitlike (parallel plates) geometry, which contain all the volume of the porous material, and which join at junctions to form a pore network. In this approach, it is only the throat size distribution ab(r)that characterizes the pore geometry. A slitlike geometry has been proposed to model the pore structure of activated carbon. On the other hand, Mason [33-361, Zhdanov et al. [37], and Parlar and Yortsos [38, 391 consider both pores and throats, with all the volume contained in the sites and throats controlling the onset of desorption. Two size distributions are necessary in the latter models. The graph that connects adjacent pores in the porous medium comprises the pore network (Fig. 2). It is characterized by its coordination number 2 (which is the average number of neighboring pores adjacent to a given pore), its dimension (two or three dimensions), and its linear size L (which expresses the number of pores along a coordinate direction). The need for a pore network representation to capture percolationlike processes, which are associated with the onset of connectivity of a phase (and may be controlling desorption and mercury intrusion), was recognized since the late 1950s by Fatt [40]. However, a systematic application of pore network models, and specifically of percolation theory, to porous media processes started only several years later [4,41,42]. Wall and Brown [43] were among the first to recognize the importance of percolation theory in interpreting adsorption-desorption curves. Regular lattices (2-D square, 3-D cubic, etc.), but also the less realistic but analytically tractable Bethe lattices (which lack reconnections), have been used in computational and analytical studies. Having defined some key aspects of porous media, we next proceed with a description of the basic characteristics of sorption isotherms and of mercury porosimetry. 3.2.2 Sorption Isotherms and Their Classification
Sorption isotherms correspond to single-component gas (physi)sorption in a porous medium. Physisorption is a result of long-range attractive interactions and short-range repulsion between the molecules of the gas and the solid that makes up the porous medium. For nonmetallic surfaces,a Lennard-Jones 6- 12 intermolecular potential, which translates into a 3-9 potential for the interaction between an atom and a flat surface, provides an often used model of this combined interaction. When chemisorption or chemical reactions are important, however, a different approach is necessary, as described in detail in Masel [MI.
BACKGROUND
77
The experimental procedure involves exposing the porous medium to a single-component gas at constant temperature T and incrementally increasing-decreasing its pressure until an equilibrium state is reached. The quantity measured is the amount adsorbed (usually per unit volume of the adsorbent) as a function of pressure P, or more appropriately of the relative pressure P/Po(T), where Po(T) is the bulk vapor pressure. With increasing pressure, adsorption coverage of the surface proceeds in the form of a submonolayer, first, followed by the formation of a monolayer and then multilayer condensation. Over a flat surface, progressively thicker liquid films would form as the bulk vapor pressure is approached. In a porous medium, however, adsorption will give rise to the filling of micropores, followed by capillary condensation in larger pores. When the pressure is decreased, desorption occurs. Because of the lack of reversibility in the capillary condensation regime, at both the single-pore and the pore network levels, however, adsorption-desorption isotherms show a characteristic hysteresis, the origin of which has been the subject of numerous studies. A compilation of the adsorption behavior of various gases in various media can be found in the review of Valenzuela and Meyers [45]. It is conventional to classify sorption isotherms in porous media according to their qualitative behavior, following the recommendations of the IUPAC Commission on Colloid and Surface Chemistry [46], as shown in Fig. 3. According to this classification, type I corresponds to monolayer coverage (and filling of micropores). Types I1 and 111 are characteristic of multilayer adsorption in nonporous materials (with type I1 corresponding to strong and type 111 to weak gas-solid attractive forces, respectively). Isotherms 1-111 are reversible. Isotherms of types IV and V occur when multiple layers of gas adsorb in a porous solid containing mesopores, and correspond to strong and weak fluid- solid interactions, respectively. These types involve a reversible part at low pressures, where filling of micropores occurs, and an irreversible part at higher pressures, due to capillary condensation, which exhibits hysteresis. They are typical of many industrial applications. Finally, type VI occurs in nonporous materials with strong fluid-wall interactions at a temperature close to the melting point of the adsorbed gas. Based on calculations in slit pores using nonlocal D F T (density functional theory), Balbuena and Gubbins [20] proposed yet another type corresponding to capillary evaporation. To interpret the sorption isotherms, the adsorption-desorption behavior over a surface in single pores and in a network of pores is analyzed in the sections to follow. Under thermodynamic equilibrium conditions, all these isotherms manifest the underlying equality of the chemical potential between adsorbed and bulk phases.
78
PROBING PORE STRUCTURES
V
V
0
PRO
1
V
0
PPO
0
PIP0
1
V
0
PIP0
1
1
V
V
0
PPO
1
0
PPO
1
FIG.3. Schematics of adsorption isotherms according to the IUPAC classification 1461.
BACKGROUND
79
3.2.3 Mercury Porosimetry Curves
Mercury porosimetry is an experimental tool for the characterization of the pore structure of porous media containing macropores. It is routinely used in the characterization of catalysts, soils, geologic porous media, etc. The conventional experimental procedure consists of conducting cycles of intrusion or extrusion of liquid mercury in an initially dry porous sample, at constant temperature, by incrementally increasing or decreasing its pressure. In these applications, mercury is the nonwetting phase. After equilibrium is reached, the volume of mercury occupying the porespace at equilibrium is plotted as a function of the pressure. Conventionally, the results are presented in a capillary pressure-saturation diagram, where the capillary pressure P , = P,, - P , is the difference between the pressures of nonwetting and wetting phases (namely, of mercury and air, respectively), and the nonwetting saturation S,,, is the volume fraction of the porespace occupied by the nonwetting phase (namely, mercury, in the present application). Repeated intrusion-extrusion cycles give rise to scanning curves, as shown in Fig. 4.In analogy with sorption isotherms, the hysteresis exhibited in mercury porosimetry has its origin both at the single-pore and at the pore network levels, as discussed later in the chapter.
FIG.4. Characteristic mercury intrusion-extrusion curves (denoted as injectionimbibition, respectively), for Dalton sandstone with the permeability and porosity indicated. Reprinted with permission from J. J. Pickell et al., SOC.Pet. Eng. J., 55. Copyright 1966 SPE.
80
PROBING PORE STRUCTURES
During the primary cycle of mercury intrusion, significant penetration of the porous sample occurs only after a certain threshold in the capillary pressure is reached (Fig. 4). This threshold reflects the facts that mercury, being a nonwetting phase, preferably invades larger pore throats and that for a significant penetration, a connected pathway of these large pore throats must exist. As pressure increases, mercury invades progressively smaller pore throats, and at sufficiently large pressures, the penetration of small cavities and other features of roughness at the pore surface will take place. In this regime, the characteristics of the pore surface can be uncovered. Note that because of its compressibility, the volume of air can be constantly reduced, even when the latter becomes topologically disconnected by the advancing mercury. However, this is not the case during extrusion, where liquid mercury-air menisci can become trapped as isolated blobs (ganglia) of mercury. As a result, a significant residual, trapped saturation of mercury (of the order of 15-20% in Fig. 4), will exist at the termination of the extrusion process. The preceding description pertains to constant pressure porosimetry. An alternative method, known as APEX, was developed based on controlledvolume porosimetry [48]. Here, it is the volume rate of intrusion that is held constant. As a result of the constant rate invasion (or withdrawal) of menisci in pores and throats, the pressure undergoes rapid fluctuations, which reflect the characteristics of pore geometry [26]. The envelope of the pressuresaturation curve in APEX is the mercury porosimetry curve in the conventional approach. Thus, the information obtained from APEX includes, in principle, that from the more conventional approach. In the sections to follow, we discuss in sequence the behavior of sorption and mercury intrusion-extrusion in pore surfaces, single pores, and pore networks.
3.3 Probing Pore Surfaces The identification of the characteristics of the pore surface by sorption and mercury porosimetry methods is possible using adsorption at low relative pressures and/or capillary invasion at high capillary pressures. These two applications are discussed separately. 3.3.1 Langmuir Adsorption
Consider, first, adsorption over a flat, smooth surface at low pressures. The resulting submonolayer coverage can be described by the well-known
PROBING PORE SURFACES
81
Langmuir’s model [ S , 441:
which expresses the equilibrium between adsorption and desorption rates under the conditions of submonolayer coverage. Here, 0 = V/V, is the surface fractional coverage, I/ is the volume adsorbed, ,/I is the monolayer volume, P denotes pressure, and the equilibrium constant KL(E) depends on the binding energy E between adsorbate and adsorbent. Langmuir-type models produce adsorption isotherms of type I. Langmuir’s equation enables the estimation of the monolayer volume V,, which is best accomplished by rearranging the r/; P data in the form
-1_-- 1 I/
V,
+-I/,K,P’1
and using linear regression. A direct estimation of the surface area of the adsorbent follows, provided that the surface coverage (3 of the adsorbate molecules per site is known (e.g., estimated [49) to be equal to 16.2A2 for N , at 77K). The Langmuir model and its modifications apply to noncompetitive, nondissociative adsorption in chemically homogeneous surfaces [44]. When the surface is chemically heterogeneous or has geometric roughness, however, the low-pressure adsorption data can be further analyzed as follows. 3.3.1.1Chemical Heterogeneity. In the presence of chemical (energetic) heterogeneity of the surface, the binding energy E , hence the equilibrium constant K L , is distributed, and adsorption models of the type of Eq. (6) must be modified. A direct extension is to assume a linear superposition of the effects of the various sites, in which case Langmuir’s model yields
0(P)=
1
‘E)P f ( E ) d E . +K LK,(E)P
Here, the chemical heterogeneity of the surface is represented in terms of a probability density function (pdf) f ( E ) , where f ( E ) d E expresses the fraction of the surface area with binding energies in the interval (E, E + d E ) . The basis of Eq. (8) is the assumption that effects of different sites are independent of neighboring interactions. The effect of the particular distribution f(E)can be significant and may change the qualitative features of the composite adsorption isotherm. In fact, by combining the local Langmuir model with an assumed form of heterogeneity, as expressed in Eq. (8), one can derive various empirical
82
PROBlNG PORE STRUCTURES
expressions [IS] commonly used. These include the Freundlich isotherm 6 = UP”,
(9)
where a and ra are fitting constants, obtained from Eq. (8) using an exponential distribution, and the multisite model
where x i is the fraction of sites with constant K,(E,) obtained using patch coverage. Equations of the type of Eqs. (9) and (10) are examples of the forward problem in adsorption in heterogeneous surfaces. Conversely, Eq. (8) can be inverted with respect to f(E)to identify the chemical heterogeneity of the surface. The problem posed is to find f(E), satisfying Eq. (8), given experimental data 6 ( P ) and the kernel function K,(E). An extensive discussion of the various inversion techniques used can be found in Jaroniec and Madey [S]. Similar inverse problems also arise in the estimation of the pore-size distribution of micro-, meso-, and macropores, as is shown later, as well as in other fields (for example, in the context of identifying the permeability heterogeneity of porous media [SO]). Equation (8) is a Volterra integral equation of the first kind (e.g., see Carrier et al. [Sl]). Because of its ill-posedness, the inversion being sensitive to experimental and numerical noise, however, some regularization method is needed for its solution [ 5 2 , 5 3 ] . Another approach is to assume an a priori pdf (e.g., Gaussian, log-normal, etc.) with a few adjustable parameters, which are then estimated by various best-fit routines. Figure 5 shows pdfs obtained from the inversion of data for adsorption of nitrogen on Aerosil A at 78 K, using two different algorithms. 3.3.1.2 Surface Roughness. Adsorption at low pressures will also be affected by the geometric heterogeneity of the surface. Consider, in particular, adsorption on a self-similar fractal surface, first discussed by Avnir et al. [54,55]. These authors reasoned that the size of the molecule of the adsorbate 6 is effectivelya ruler measuring the area of the self-similar surface. They found experimentally that the monomolecular coverage (molecular tiling) of the surface by various species of different molecular weight (and hence of presumed different surface coverage per site, CY 6’) scales as a power law of 6, namely,
-
N,@)
N
0-”’2
N
6-”,
(1 1)
where N,(6) denotes the amount adsorbed at the end of monolecular coverage. Because Eq. (11) can be interpreted as a power law between the number N , of “spheres” that cover the surface (actually its active sites) and their size 6, it also serves to define the box-counting fractal dimension of the
PROBING PORE SURFACES
83
EDCAIS
8
11
E, kJlmole
FIG.5. The pdf of the binding energy in a chemically heterogeneous surface obtained from the inversion of adsorption data of nitrogen on Aerosil A at 78 K using two different inversion algorithms. Reprinted from Jaroniec and Madey, Physical Adsorption on Heterogeneous Solids, 0 1988, with permission from Elsevier Science.
surface (namely, we have D = n). A list of widely different surfaces were probed and found to have a fractal dimension in the range between 2 and 3. In most of these experiments, however, the range of scales where fractal behavior was identified was quite narrow (less than a decade in terms of 6, for example, for N , , d,, = 0.2 nm and d,, < 1 nm). The limitation of small range is clearly important as far as a fractal characterization is concerned. It must be also kept in mind that the fractal dimension thus identified may well pertain to the local regime of a generally self-affine pore surface with self-affine exponent H = 3 - D. In this context, the dimension D identified would reflect the roughness of the various surfaces tested, which will increase (lower H ) as D increases. The molecular tiling approach for estimating the fractal dimension of the surface was critically reviewed by Drake et al. [56].
84
PROBING PORE STRUCTURES
An alternative approach for the determination of various characteristics of the pore surface involves the use of an isotherm of a single species in the multilayer region, rather than of multiple isotherms of different adsorbates. This is discussed in the following section.
3.3.2 Multilayer Adsorption In multilayer adsorption, adsorbate-adsorbate interactions cannot be ignored and, in fact, control the adsorption process. Brunauer, Emmett, and Teller [57] proposed the simple, but still widely used, BET model for multilayer adsorption over a flat surface, based on which the pore surface area can be estimated. The BET equation has the simple form V
-
cx
--
v,
(1 - x)[1
+ (C - 1)x-J’
where x = P/Po is the relative pressure and C is a parameter depending on temperature, the binding energy, and the latent heat. The approach follows assumptions similar to Langmuir’s, namely, localized adsorption over a homogeneous, flat surface and the absence of lateral interactions. Depending on the value of C, the BET model can cover the range of adsorption isotherms of types I1 (C > 1) and 111 (C < I) (see Fig. 6). As in the Langmuir model, the BET equation is reversible. By rearranging it in the linear form, X
--
1
V(1 - x ) - CV,
+ x(CCV,- 1)’
we can estimate the monolayer volume, V, (and C), by parameter fitting, from which the pore surface area follows, as in the case of Langmuir adsorption. When multilayer adsorption occurs over a rough surface, models that account for the potential energy of the adsorbate due to its attraction to the rough surface are required. One such class makes use of the “equipotential” assumption, in which the potential of the interaction depends only on the distance from the surface, while the film thickness remains the same irrespective of surface curvature. We note that the thickness t of a liquid film over a flat surface is obtained by a simple balance in the chemical potential between adsorbed and bulk gas phases:
where van de Waals attraction was assumed. Here A , is the Hamaker
PROBING PORE SURFACES
85
X
FIG.6. Adsorption isotherms described by the BET model for different values of C.
constant, is the molar volume of the liquid, and we also introduce the disjoining pressure n(t)for later use. The latter is the pressure of the nonwetting phase in equilibrium over a flat wetting film of thickness t . Under the equipotential assumption, adsorption over a rough surface of area S can be described by generalizing Eq. (14):
P
-=
t3
-RTlnx,
(15)
where P is a constant. Then, multilayer adsorption of volume V over a surface area S is expressed as
where we have used the conventional notation, A = RTln(Po/P), for the adsorption potential.
86
PROBING PORE STRUCTURES
In practice, however, isotherms over rough surfaces display power laws with an exponent in a range of values rather than the specific value of 3 suggested in Eq. (16). To account for such behavior, semiempirical isotherms of the type
have been proposed, in which exponent n is now an adjustable parameter (and p’ is another constant). Equations of the type of Eq. (17) are known as Frenkel-Halsey-Hill (FHH) equations. Other semiempirical models for multilayer adsorption over rough surfaces have also been proposed, for example, the Dubinin-Radushkevich (DR) equation, V
- = exp[ - bA2],
VM
where b is another adjustable parameter [3] (although the latter is actually more appropriate for the filling of micropores, see later). Pfeifer et al. [58] combined the equipotential approach with van der Waals attraction to describe adsorption over a self-similar fractal surface, and derived the following result: I/-
t3-D
~-1(3-D)/31,
(19)
for the volume V contained in cavities and pits of size less than r. The first part of this equation reflects the surface self-similarity and was derived previously by de Gennes [16] (see later). The second reflects equation Eq. (14). Comparison with Eq. (17) shows that Eq. (19) has the form of an FHH equation, now with exponent n = 3/(3 - D), thus providing a possible interpretation of the empirical FHH exponent in terms of the degree of roughness. Indeed, according to this model, n = 3 is obtained in the Euclidean limit of flat surfaces, D = 2. Pfeifer et al. [58] fitted Eq. (19) to experimental results for the adsorption of N, on silver and reported a surface fractal dimension of 2.3 in the range 0.8-4.5 nm. This range is larger than that for the molecular tiling approach, giving confidence to the estimated fractal dimension. However, the method neglects capillary condensation, which will likely occur in pores in the upper limit of the range investigated, and the consideration of which will change the scaling behavior, while the adsorbate-adsorbent interaction for this system may not necessarily be of the van der Waals type [59]. In a subsequent paper, Pfeifer and Cole [17] presented an extensive discussion of the adsorption and capillary equilibria over a self-affine surface and discussed the various regimes that may arise.
PROBING PORE SURFACES
87
3.3.3 Capillary Effects and Surface Roughness
In the previous sections, the intermolecular forces between bulk and condensed phases (essentially the effect of the meniscus) were neglected. As adsorption proceeds and films thicken, however, their contribution becomes important. It is well known that across a macroscopic interface separating two immiscible phases in equilibrium, the capillary pressure between the two phases, P , = P,, - P,, is related to the mean curvature, C"".",through the Laplace equation
(20) where y is the interfacial tension between the fluids. Here, we defined c n w . " - 1/2(1/R1 + l/R,), where R , and R , are the principal radii of curvature measured from the side of the nonwetting phase. The interface is stable provided that P,
= 2C""~"y
namely, that C""." increases with an increase in the volume Vnw.Equation (20) contains the well-known result,
p . = -2Y '
r
for spherical interfaces of radius r. It is important to note the different power-law dependences between the pressure (disjoining or capillary) and the length scale (film thickness or radius of curvature) expressed in the two Eqs. (14) and (20) [or (22)], respectively. In relating surface roughness with adsorption data at higher relative pressures (which give rise to a capillary condensation) or mercury porosimetry at high capillary pressures, therefore, the different power law, Eq. (20) [or (22)] must also be considered. This problem was considered by de Gennes [16], who studied the displacement of a wetting fluid from the cavities of a self-similar fractal surface. He derived the following scaling law for the wetting fluid saturation (namely, the pore volume fraction occupied by the wetting phase) contained in pits and cavities of radius less than r :
where D is the fractal dimension of the pore surface and rupis the upper cutoff limiting the fractal behavior. We recognize Eq. (23) as the first part of Eq. (19) of Pfeifer et ul. [58]. Now, when macroscopic curvature effects dominate over adsorbed films, the radius r is related to the capillary
88
PROBING PORE STRUCTURES
pressure P , via Eq. (22). Then, the following scaling law between S,. and P, can be derived [60]
-
S,
where n = 3 - D.
P,-"
(24)
This power law is consistent with the experimental data of Melrose [61] for describing the dependence of the capillary pressure curve in the low S, regime (Fig. 7), where the exponent n was found to be in the range 0.38-0.46. From this analysis, Davis [60] concluded that the pore surface in these experiments has a fractal dimension in the range 2.54-2.60. Neimark [59] combined de Gennes's approach with capillary condensation to interpret adsorption data at higher pressures. Using Kelvin's equation (see later) and neglecting the adsorbed film in comparison to the capillary-condensed adsorbate, he obtained the following relation between adsorbed volume and adsorption potential: 1/
Iv
A-(~-D).
(25)
Like Eq. (19), this is also an equation of the FHH type, but now with the different exponent n = 1/(3 - D), reflecting the dominance of macroscopic curvature over thin film effects. The same exponent was also derived by 100 80
I
- SYSTEM : BEREA
b '
I
I
8.0
8.0
'
SANDSTONE/ AIR/
5
m
t,. This thickness also depends on the molecular interaction parameters. Due to the difference between t , and t,, complete emptying (desorption) of a filled pore occurs at a pressure lower than pore filling, thus resulting in hysteresis. Due to the account of the liquid-solid interaction, the onset of adsorption and desorption predicted by this theory is different from that of Everett and Haynes [68]. More modern treatments make use of DFT and molecular dynamics simulations. The significant advantage of the molecular models is that they can cover the size distribution over a large range, including micropores (which do not involve capillary condensation) and macropores (which involve capillary condensation). Evans et al. [76] applied local D F T in slit and cylindrical pore geometries. As in Cole and Saam [73], they attributed hysteresis to the metastability of thick films and obtained hysteresis loops for the amount adsorbed as a function of pressure. Their theory shows explicitly how the vapor-liquid coexistence in confined geometries depends on the pore radius. In effect, the constricted geometry leads to a lowering of
94
PROBING PORE STRUCTURES
the critical temperature of the fluid (Tc),compared to the bulk ( T ) ,which in certain limiting cases can be described with the approximate expression
-T C%E I - -
TC
1
hr ’
(33)
where r is the pore size and l / h is the decay length of the intermolecular potential. Thus, for sufficiently small pores at a sufficiently high temperature, the confined fluid is in a supercritical state, and the adsorption-desorption process is reversible. This is the case of adsorption in micropores. Figure 9 shows experimental results for adsorption in porous media [77], which clearly demonstrate the diminishing of the hysteresis loop as the temperature increases and the existence of a capillary critical point. We conclude that the single-pore adsorption-desorption behavior in the capillary condensation regime can be modeled only approximately with the use of Kelvin’s equation and, more accurately, by molecular models. Use of Kelvin’s equation, however, leads to simple analytical estimates for the relative pressure at which a pore of size Y fills (or empties). For example, one has
and the geometry-dependent index is equal to s = 1 in spherical pores for either adsorption or desorption, while in cylindrical elements (throats), s = 1 for desorption, and s = 1/2 for adsorption. A number of single-pore studies have been conducted using molecular models, an important by-product of which has been the assessment of the validity of Kelvin’s equation. Ball and Evans [74,75] used local DFT, in which the adsorption branch was assumed to “nucleate” at the limit of metastability (namely, at the spinoidal pressure) and the transition from liquid to gas was assumed to occur at the bulk equilibrium coexistence point. In a related study, Seaton et al. [28] used local DFT in slitlike pores. To obtain expressions for the intermolecular potential parameters they fitted their DFT results for large pores (which effectively mimic a flat surface) to a t-plot-like curve. They showed that Kelvin’s equation deviates significantly from the DFT predictions for small pores, although the modified equation that includes the t correction gives better agreement (with a deviation that does not exceed 10% in small pore sizes). Balbuena and Gubbins [20] applied nonlocal DFT to slitlike pores to characterize adsorption-desorption isotherms in terms of pressure, temperature, the pore width H , and the intermolecular (fluidfluid and solid-fluid) parameter ratios. Their results covered the range of
95
PROBING POROUS MEDIA
0.0
a.2
0.6
a4
a.8
LO
P’PSd
FIG.9. Experimental sorption isotherms of Xe on Vycor demonstrating the dependence of hysteresis loops on temperature and the existence of a capillary critical temperature. Solid circles denote adsorption and open circles denote desorption. Reprinted with permission from Burgess et al., Pure Appl. Chem. 61, 1845 (1989).
the six IUPAC types of Fig. 3, all of which were found in the simulations. They found that the classification of the various types correlated well with the reduced thickness H* = HJo where o is a characteristic length of the Lennard- Jones potential, and they recommended specifying values of H* rather than the IUPAC absolute size scale to classify pores in the micropore, mesopore, and macropore classes. These authors also commented on the inadequacy of Kelvin’s equation for micropores and in a certain range of mesopores. f,
ff
96
PROBING PORE STRUCTURES Q
0
u!
0
9 0.0
0
0.2
0.4
P/P,
0.6
0.8
1.o
FIG. 10. Predictions of single-pore isotherms for the adsorption of nitrogen in carbon slit pores based on different approaches (dotted line, Kelvin equation; dash-dotted line, modified Kelvin equation; dashed line, local DFT; and solid line, nonlocal DFT). Here H* is a dimensionless pore width. Reprinted with permission from Lastoskie et al., J . Phys. Chem. 97, 4786. Copyright 1993 American Chemical Society.
Lastoskie et al. [78] applied nonlocal DFT theory to examine adsorption in carbon slitlike pores. They particularly emphasized the filling of micropores and identified various filling regimes. In a separate study, Lastoskie et al. [79] compared the predictions of pore-filling with the various different approaches (Kelvin, modified Kelvin, DFT, and nonlocal DFT). Their results (reprinted in Fig. 10) show that the various forms of Kelvin’s equation misrepresent pore-filling, particularly of micropores, although they appear adequate for mesopores of larger size. Using lattice gas simulations, Binder and Landau [SO] also commented on the validity of Kelvin’s equation in sufficiently large capillaries. Nonlocal DFT in cylindrical pores was also used by Ravikovitch et al. [Sl]. Interestingly, however, adsorption-desorption processes in converging-diverging pore geometries, which are typical of porous media, have not yet been simulated at the time of writing this chapter. Direct experimental determination of capillary condensation in slit geometries was obtained by Christenson and coworkers [82-851 using the surface force apparatus.
97
PROBING POROUS MEDIA
3.4.2 Adsorption-Desorption in a Pore Network
Sorption isotherms in porous media reflect the overall response of the multitude of pores comprising the porous medium. The pore structure gives rise to issues of heterogeneity and accessibility. In formulating forward and inverse problems in pore networks, the typical approach taken is to assign local conditions for adsorption or desorption in a pore element, as described earlier, and then to consider the composite behavior of the system subject to various assumptions. In analyzing the composite response of porous media, we consider adsorption and desorption separately. As the relative pressure increases, multilayer adsorption proceeds uniformly over all surfaces. At some stage, the filling of micropores and mesopores will commence. Assuming that pores fill independently of each other, elements with smaller radii fill first, regardless of their accessibility. Then, we can take the linear superposition [28]
to express the adsorbed amount N in terms of the molar density p(P, r ) of the fluid at pressure P in a pore of size r. Here f is the pdf of pores with volume V (which can be related to the size distributions, depending on the geometric model used). We recognize Eq. (35) as belonging to the same class as Eq. (8), describing the effect of chemical and geometric heterogeneity of the pore surface. To construct adsorption isotherms in the forward problem, two additional items are required: relating the number fraction of liquid-occupied sites to the throat statistics and assigning a volume distribution. Considerable attention has been paid to pdfs with power-law scaling. Avnir and Jaroniec [62] considered the filling of micropores. They used Dubinin’s approach for the liquid density, by taking N
- [ly exp(-mr2A2)f(r)
dr,
(36)
-
and assumed that the pore-size distribution satisfies a power-law scaling, namely, f(r) r2-’, where f ( r ) dr is the volume fraction contributed by pores with sizes in the interval (r, r + dr). Based on these assumptions, they obtained the result
N
,4-(3-D),
Equation (37) is of the FHH type with exponent n
(37) =
1/(3 - D),which is
98
PROBING PORE STRUCTURES
identical to Neimark’s Eq. (25). However, the two objects to which powerlaw characteristics are attributed are different, with Neimark’s equation pertaining to a fractal surface, while Avnir and Jaroniec’s was the micropore size distribution. Yin [63] also used the same assumption for the power-law scaling of 1: However, instead of assuming micropore filling, he considered a capillary condensation regime, in which pores fill when the Kelvin threshold for adsorption is reached, and neglected any contributions from the adsorbed film. His result is also an FHH equation of the same type as Eq. (37). Later, Jaroniec [86] pointed out the equivalence of the two approaches for deriving Eqs. (25) and (37). When a pore network model representation of the porous medium is used, formulating the forward and, most important, the inverse problems depends on the assumptions made about the pore structure. As noted, a basic element of the latter is the pore-throat converging-diverging geometry. However, capillary condensation in a converging-diverging geometry has not been rigorously analyzed. A plausible assumption is that pore-filling in the latter occurs when the radius of curvature of the meniscus becomes equal to the pore radius, as further condensation will lead to a smaller radius of curvature, hence to a smaller (more negative) C‘,“. However, this presupposes that all throats adjacent to the pore under consideration have already been filled. Given that cylindrical pore throats fill at a higher relative pressure than spherical sites of the same radius [compare with Eq. (34)], the filling of a pore could be delayed, in principle, until its largest adjacent pore throat has been filled first [69-721. For this ~ where~ , scenario to apply, the following constraint must hold, r, c 2 rb,max is the maximum size of the throat adjacent to a pore. Thus, the pore-throat aspect ratio becomes an important parameter in the filling sequence. Mayagoitia et al. [69-721 have discussed the possibility that such pore-throat interactions may, in fact, have a long-range effect on the overall adsorption pattern. Interactions of this type develop in imbibition, which is the counterpart of adsorption, and drastically affect the displacement patterns [87]. However, the two processes differ in at least one respect: that imbibition has mainly invasion characteristics, in contrast to adsorption, where condensation does not necessitate connectivity to an invading front. The issue of pore-throat correlation appears again in the discussion of desorption and mercury porosimetry. Zhdanov et al. [37] proceeded with the assumption that pore filling is only controlled by their own radius, and accounted for the density of the adsorbed films using a t-plot approach. Then Eq. (35) can be used directly to obtain the pore size distribution as(r).Mason [33-361 (and, subsequently, Parlar and Yortsos [38,39]), on the other hand, modeled adsorption based on the premise that a pore is filled when its largest adjacent throat is
~
PROBING POROUS MEDIA
99
filled. Then, the fraction of occupied sites X , is
X,=l-(l-p)Z,
(38)
where p is implicitly related to the relative pressure via Eqs. (5) and (34) and Z is the coordination number (the notation C , instead of 2, is also used in the adsorption literature). The appearance of 2 in modeling adsorption makes this model qualitatively different from that of Zhdanov et al. [37] (and also of Seaton et al. [28], see later). By further equating the porevolume fraction with the number fraction of liquid-occupied sites (in which it is tacitly assumed that the site volume is uncorrelated with its radius r,), a predictive model for the composite response during adsorption can be obtained using Eq. (38). Given adsorption data and an assumed (or estimated) value of 2, the pore-size distribution ab(r)can be thus estimated. Mason further postulated that Eq. (38) actually serves to relate pore and throat size distributions, namely, q = 1 - (1 - p)Z,
(39)
from which the pore size distribution, ct,(r), can be obtained given ab(r).In a subsequent study, Parlar and Yortsos [39] analyzed the effect of relaxing the assumption of Eq. (39). Although not explicitly accounted for in these models, the contribution of the adsorbed film to the total volume can be readily incorporated using the t-plot approach. In studies where molecular models are used to describe the local behavior, the density function p(P, r) is computed directly. Because the single-pore geometries studied are of only two types (slitlike and cylindrical), however, all volume is allocated to the throats, hence only the pore size distribution of throats a&) is used (or inverted). Seaton et al. [28] considered slitlike geometries and applied local DFT to obtain the pore size distribution of porous carbons from nitrogen adsorption isotherms. Lastoskie et al. [78,79] applied nonlocal DFT to slitlike geometries. Their results showed that the former is generally better than DFT and that both are preferred over Kelvin-type equations. A comparison of the different pdfs obtained based on the different local models is shown in Fig. 1 1 (reprinted from Lastoskie et al. [79]). Nonlocal D F T was also used by Ravikovitch et al. [Sl] to study adsorption in distributed cylindrical pores of near uniform sizes in the range 18-80A. Adsorption terminates upon the complete filling of all pores (or of some fraction qi, corresponding to fraction pi, if secondary desorption is to be investigated). Desorption starts upon reversal of the pressure. Conventionally 127, 33-38, 43, 881, nucleation is neglected (but see Ref. [39]), and according to the single-pore analyses, largest-size elements (namely, pores)
100
PROBING PORE STRUCTURES
,
Pore Width H (A)
60
FIG.1I. Comparisons of the pdfs of the pore size obtained by inverting adsorption data for noninteracting slitlike pores based on different approaches (dotted line, Kelvin's equation; dash-dotted line, modified Kelvin's equation; dashed line, local DFT; and solid line, nonlocal DFT). Reprinted with permission from Lastoskie et al., J . Phys. Chem. 97,4786. Copyright 1993 American Chemical Society.
empty first. However, unlike adsorption, desorption (emptying) of a pore requires access to vapor-occupied sites. These can be sites at the outside surface of the sample (the fraction of which can be significant for pore networks of relatively small size), sites belonging to a cluster spanning the sample, or sites that are not connected to bulk vapor, but contain vapor either as a result of incomplete termination of adsorption (in the case of secondary processes) or as a result of nucleation (Fig. 12). Thus, desorption is affected by the network connectivity. The resulting hysteresis in the adsorption-desorption curves is now due to the limited accessibility, rather than the local geometry. The requirement of accessibility to external (or internal) sources attributes to desorption invasion percolation (IP) characteristics similar to the extrusion part of mercury porosimetry (discussed later). The process is mixed bond-site percolation, in which we are interested in the fraction of vapor-occupied (empty) sites, the occupancy of which is controlled by bonds. This brings about the important question of whether or not the geometrical parameters of pores and throats are interrelated. Bond-percolation or site-percolation models, where only throats or pores, respectively, are considered, have also been suggested as desorption models. Most studies in this area have used ordinary percolation (OP) rather than IP models (the difference between the two in three dimensions being negligible, for practical
PROBING POROUS MEDIA
101
FIG.12. Schematic of the requirement for accessibility to bulk vapor or an internal source before a site can empty during desorption. Two successive steps of desorption are shown. Reprinted with permission from Parlar and Yortsos, J . Colloid Interface Sci. 124, 162 (1988).
purposes). The implicit assumption in all percolation models is that the pressure decreases in infinitesimally small intervals and that dynamic effects during the process are absent. This issue appears again in mercury porosimetry. Whether of the site, bond, or mixed site-bond type, the application of percolation theories results in a set of curves for the fraction of vaporoccupied elements. The curves can be obtained by numerical simulation for regular networks and analytically for Bethe lattices and also depend on the pore network coordination number 2, its dimension, and the size L. Mason [33] developed a differential description of such processes. Parlar and Yortsos [38] solved Mason’s differential equations exactly and provided various analytical solutions of different percolation problems (site-only, bond-only, and mixed site-bond percolation) to model primary and secondary adsorption and desorption in a Bethe lattice, and presented numerical solutions for a square lattice. Typical adsorption-desorption curves for the condensed liquid saturation as a function of the relative pressure for a Bethe lattice [38] are shown in Fig. 13. Similar results are obtained for regular lattices [I891(the main differences are related to the behavior of the primary desorption curve near the onset of connectivity). In these percolation-type models, larger-scale hysteresis associated with connectivity and topology is assumed to dominate over local, single-pore hysteresis (earlier suggested as the reason for the hysteresis loops). Ball and Evans [75] provided a comparative study to probe the origin of hysteresis.
FIG.13. Predictions of primary and secondary adsorption curves (left diagram) and desorption curves (right diagram) for the adsorption of xenon in Vycor glass at 151 K based on a Bethe lattice model with Z = 4 and an assumed pore sue distribution. The numbers indicate the relative pressure values at the onset of secondary adsorption or desorption. Reprinted with permission from Parlar and Yortsos, J. Colloid Interface Sci. 124, 162 (1988).
PROBING POROUS MEDIA
103
They used a Gaussian pore size distribution and a Bethe lattice of coordination number 4 (similar to Refs. [33,38]), to model desorption. Contrary to the latter studies, however, they used results from DFT rather than Kelvin’s equation. They showed that the percolation approach matched the qualitative behavior of the experimental data of Burgess et al. [77] much better than the single-pore hysteresis models and concluded in favor of a percolation approach. Nonetheless, approaches that do not recognize accessibility or connectivity issues are still used. Essentially, these are equivalent to representing the pore network in terms of a bundle of parallel capillaries. Using a percolation approach, Seaton [27] interpreted the various types of hysteresis in the IUPAC classification. By neglecting nucleation and spatial correlations (see also later), primary desorption curves can be inverted as follows: 1. For fixed 2 and L, obtain from simulations a percolation probability curve P(p; L) expressing the fraction of occupied sites in terms of the percolation variable p and the size L. Such curves can, in fact, be cataloged. 2. Convert desorption data into an equivalent liquid saturation vs pore radius curve, S , vs r, using information on the pore volume of the sample and Kelvin’s equation or other expressions. 3. Obtain p(r), thus, the cumulative distribution function (cdf)F,(r) = j&ab(r)dr = 1 - p , by making the identification S,(r) = 1 - P ( p ; L). Differentiation of this curve produces the desired pdf cth(r). An essentially identical approach is used to infer the pore-size distribution from mercury intrusion porosimetry (see later). An example illustrating the application of this algorithm using synthetic data is presented during the discussion of mercury porosimetry. The success of this method, however, relies on several assumptions, including the premise that pores are uncorrelated in space and that the coordination number 2 and lattice size Lare known. Correlation issues are also discussed later in the chapter. The coordination number affects the percolation probability curve, mainly through its effect on the bond percolation threshold p,, which for regular lattices in three dimensions has the approximate dependence 1.5
P , X y .
Larger 2 leads to a smaller p,, hence to a less sharp primary desorption curve. Can the coordination number be obtained from adsorption-desorption data? If one assumes that Mason’s relation [Eq. (38)] is valid, then the simultaneous use of both primary adsorption and desorption data can be iteratively used to infer 2. In particular, Eq. (40) can be usefully employed
104
PROBING PORE STRUCTURES
to match the point where the knee in the primary desorption forms. An alternative approach for estimating 2 is based on secondary desorption curves. Using a Bethe lattice, Parlar and Yortsos [38,39] found that the tangent of the local angle formed by secondary desorption (originating at fractions qi and p i ) and primary adsorption curves satisifies
for arbitrary pore and throat size distributions. In conjuction with available adsorption-desorption scanning loops, Eq. (41) can then be used to estimate 2, without the need to rely on the restrictive assumption of Eq. (39). Du [89] performed simulations of primary adsorption and secondary desorption in regular lattices and found that the value of 2 estimated using this approach (which is based on a Bethe lattice representation) is quite close to that assumed for a variety of lattices and coordination numbers. An analogous approach, but based on Mason's [36] results, was proposed by Rajniak and Yang [90]. Another method for the estimation of both 2 and L makes use of the finite-size scaling of percolation [27,29-311. Proceeding with the assumption that industrially relevant porous particles are actually collections of smaller porous agglomerates with the same 2 and L, Seaton and coworkers [27,29-311 suggested that primary desorption data actually reflect finitesize effects, and proposed the following relation: Z P ( p ;L) = L D - d h [ ( Z p- 1.5)L1'"].
(42)
Here h is a crossover function, depending only on the dimensionality of the lattice, D is the percolation cluster mass fractal dimension, d is the embedding (Euclidean) dimension, and v is the correlation length exponent. Given that in Seaton's approach, the information on pore-size distribution is already available from the primary adsorption data, P is available as a function of p . Then the estimation of 2 and L follows by matching experimental results with Eq. (42), where the function h is obtained independently from numerical simulations. Various estimates for 2 (although some unrealistically large) and L were obtained with this procedure. The application of percolation approaches has been very useful for elucidating the effect of connectivity during desorption in pore networks. However, as discussed, the data interpretation still relies on several assumptions on the pore-throat size relationships and on the assumed lack of spatial correlations. These issues are generic to mercury porosimetry, as well, and are further discussed in the following.
PROBING POROUS MEDIA
105
3.4.3 Mercury Intrusion- Extrusion
Mercury intrusion-extrusion in a pore network shares many common aspects with sorption, capillary intrusion being analogous to desorption and extrusion being analogous to adsorption, respectively. As in the case of adsorption, to formulate forward and inverse problems in mercury POrosimetry, we must consider phenomena at the two different scales, the single pore and the pore network. We also assume that capillary forces dominate over other forces, such as viscous and buoyancy. The advance of a meniscus at the single-pore scale is best captured by considering a converging-diverging geometry of a circular cross section, as shown in Fig. 14. At conditions of capillary equilibrium, the mercury-air interface has a locally spherical shape with mean curvature
where 8 is the contact angle of the meniscus (measured from the air side), 4, is the local angle formed by the tangent to the pore surface at the contact line, and r is the radius of the cross section at the same point. As long as 8 4, < x/2, the interface curvature is positive. During drainage (depicted on the right schematic of Fig. 14), the interface configuration is stable before the meniscus reaches the pore throat (path AB in Fig. 14), since the curvature increases with an increase of the volume of the displacing phase, due to the decrease of both r and 4, and the condition of Eq. (21) is satisfied. At the point where the meniscus reaches the minimum pore throat radius rb (point B in Fig. 14), however, further penetration leads to an unstable interface (dashed lines in the menisci of Fig. 14) as the curvature now decreases with increasing volume. As a result of this instability a nonequilibrium jump of the interface will ensue (path BCED in Fig. 14), until a new stable equilibrium position is reached downstream of the throat (point D in Fig. 14). This jump (B + D), known as Haines’s jump or a rheon event [l], effectively corresponds to the penetration of the throat and the filling of the adjacent pore. Thus, filling of the downstream pore by the nonwetting phase occurs when the capillary pressure reaches the threshold
+
This step is the counterpart of pore-emptying in desorption. Conversely, during imbibition in the same geometry (for example, by reversing the displacement, see schematic on the left in Fig. 14), the interface remains stable as long as withdrawal of the meniscus results in an increasing radius of curvature (path DE in Fig. 14). At the point where the maximum
106
PROBING PORE STRUCTURES
,
,
PCI
Pcd
PC
FIG. 14. Schematic of single-pore hysteresis during drainage-imbibition in a pore with converging-diverging geometry.
radius of the cross section is reached (point E in Fig. 14), however, further retraction will result in an unstable configuration (path ECBA in Fig. 14) and an interface jump (E -+ A) will occur. This Haines jump or hygron event [l] is the analogue of the pore-filling step in adsorption. Thus, in the geometry of Fig. 14, the emptying of the pore by the nonwetting phase is dictated by the maximum pore body size
Comparison of Eqs. (44) and (45) shows that the process is hysteretic (Pcd> Pci) at the pore level. We recognize a close analogy with the single-pore hysteresis in sorption processes depicted in Fig. 8. The stability of menisci in capillary equilibria in a variety of pore geometries has been studied by various authors [23-26,87,91]. Realistic geometries, however, involve pore junctions (as shown schematically in Figs. 2 and 12). Thus, the retraction of the interface during imbibition will also be affected by the interaction with other throats adjoining the pore. Indeed,
PROBING POROUS MEDIA
107
the filling state of adjacent throats affects the value of the capillary pressure at the point where the interface loses stability, leading to different withdrawal mechanisms and affecting the overall imbibition pattern [87]. Furthermore, the receding interface is subject to snap-off instabilities during retraction, the likelihood of which is primarily a function of the size aspect ratio between pores and throats. Consideration of these different mechanisms will give rise to cooperative phenomena between pores, as analyzed for the first time in square channel networks by Lenormand et ai. [87]. These mechanisms have been incorporated in various pore network models developed since [24,25,92]. Consider, now, pore network effects during mercury intrusion. Early models of the intrusion curve were based on the model of noninteracting parallel capillaries (model of the bundle of tubes), where accessibility and percolation phenomena were ignored. In fact, such models formally correspond to pore networks with Z = 00. Fatt [40] and Dullien [4] were among the first to recognize the need for a pore network description. In parallel with various numerical models [4,24,25,92,93], percolation-type approaches have also been proposed to model the forward and inverse problems [4, 91, 94-97]. Both bond percolation [94, 95, 98, 991 and mixed site-bond percolation [89,91, 961 have been used. In these approaches, the volume of the invading nonwetting phase is related to the applied capillary pressure as follows. Assuming that all invaded elements (sites or bonds) have the same volume, percolation probability curves relate the saturation to the capillary pressure. For example, in simple bond-percolation models, we have S,, = P ( p ) and
2y cos 8 P, =-, r
where P is the percolation probability curve (obtained by various authors using ordinary percolation [98] or invasion percolation [99] without trapping) and P, is related to p through Eqs. (44) and (45). The implicit assumption is that of infinitesimally small pressure increments, such that only one pore throat (in fact the largest one available) is invaded at a time. Geometrical (but not kinetic) aspects of percolation during mercury invasion were demonstrated by Thompson et al. [loo, 1011, who analyzed the electrical resistance of invaded mercury as a function of the pressure step size (see also Ref. [102]). These authors also found important effects of gravity during the invasion and suggested that invasion percolation in a gradient may be better suited as a model of the process. Volume-controlled mercury porosimetry [48, 921 (the APEX method) is also affected by pore network effects. This process can be connected to invasion percolation in the theoretical limit where the injection rate is
108
PROBING PORE STRUCTURES
sufficiently small to allow for the resolution of the front as it advances one pore at a time. During mercury intrusion, the capillary pressure fluctuates in the form of bursts of variable size, the characteristics of which reflect single-pore processes and have been analyzed in detail [48, 921. We note that the analogous problem of fluctuations in IP (where, however, the pore is structureless) was analyzed by Roux and Guyon [lo31 (see also Maloy et al. [104]), who related the pressure jumps to percolation exponents. Constant pressure intrusion is, in principle, a subset of APEX in the sense that the envelope of the pressure fluctuations of APEX is the intrusion curve of constant-pressure porosimetry. An example of the use of a pore network model to simulate mercury intrusion-withdrawal in the APEX method is shown in Fig. 15 (from Ref. [92]). In addition to the intrusion part, simulations of withdrawal and scanning loops are shown. The withdrawal algorithm includes snap-off of the retracting interfaces and the entrapmemt of mercury ganglia. Inverting the intrusion data from porosimetry to obtain information on the pore-size distribution was suggested early [105-1073. The use of percolation theory facilitates this analysis, just as in the case of primary desorption. As long as P , remains below a threshold level P,, = 2y cos 8/rc, corresponding through Laplace’s [Eq. (20)] to a bond radius r,, significant (sample-spanning) penetration of the sample by mercury will not occur (see Figs. 4 and 15). The threshold r, is related to the percolation threshold of the pore network p,, here taken to be bond percolation
which for cubic lattices is approximately equal to 0.25. Clearly, larger values of the coordination number lead to smaller p , , hence to larger r,, and to smaller Pcd.Scaling the capillary pressure curve with the threshold P,, has been found to effectively collapse mercury-porosimetry data in many sandstones [91] and it is the basis (along with the relation between r, and the medium permeability, e.g., see Ref. [lOS]) of the so-called Leverett function. The subsequent filling of the pore space is dictated by its accessibility. As in desorption, the algorithm for inverting mercury intrusion data is straightforward. Given a lattice type and size, the fraction of the sites X , occupied during percolation can be computed and stored as a function of p . Assuming that pores are random and uncorrelated and that the volume of sites is unrelated to their nominal size r,, the saturation of the invading phase can be identified with the fraction of sites invaded. Using the relationship between X , and r from the experimental data and the relationship between X , and
109
PROBING POROUS MEDIA
10 ' 1oa
1oa
I
0.8
0.8
0.4
0.2
0
MERCURY SATURATION FIG. 15. Pore network simulation of various scanning loops of the APEX process in a cubic lattice with low-aspect ratio biconical pore segments. Reprinted with permission from Toledo et al., S P E Form. E d . , 46. Copyright 1994 SPE.
p from the network model, the curve p(r) can then be reconstructed. Thus, the pdf of the throat size distribution clb(r)can be obtained. As an example, we have for the simple percolation model [Eq. (46)]:
The parallel tube model is included in Eq. (48) in the limit P = p . As in desorption, however, effective use of this inversion algorithm necessitates knowledge of Z . Typical results for the cdf of throat sizes from the inversion of the intrusion part of a mercury porosimetry curve using mixed site-bond percolation and 2 = 5 are shown in Fig. 16. Results corresponding to the common method of the bundle of capillary tubes are also plotted. It is clear that the latter results in a narrower distribution, underestimating the width of the true distribution [4]. This mismatch increases as the coordination number decreases. Information on the pore size distribution must be sought either by assuming a certain relation between q and p (see also later) or by methods other than constant-pressure mercury porosimetry. Inversion of the extru-
110
PROBING PORE STRUCTURES
-ii L
r FIG. 16. The cdf of pore throat sizes, F(r) = 1 - p ( r ) , obtained by inverting a simulated capillary pressure curve using 3-D mixed bond-site invasion percolation in a 40 x 40 x 40 lattice with average coordination number Z = 5. The solid line is the input cdf. The inverted data for three different realizations of invasion practically coincide with the assumed cdf, except near small sizes. The predictions of the capillary tube model are also shown as a dashed line (reprinted from Du [89]).
sion curve is subject to the additional complications of size aspect ratio and it is difficult to apply in practice. However, assuming a certain pore throat geometry, Toledo et al. [92] simulated volume-controlled porosimetry. Inversion of the pressure-saturation curve, which now involves pressure fluctuations, was done by interpreting the fluctuations of pressure according to local pore models. Both intrusion and withdrawal curves were analyzed and led to the distributions shown in Fig. 17. This approach appears to have considerable merit, compared to constant-pressure porosimetry, as it requires less restrictive assumptions. On the other hand, important assumptions on the correlation between pores and throats and the lack of spatial correlations still apply.
3.4.4Some Additional Issues The preceding inversion techniques are based on certain approximations. These include the relation between pores and throats and the absence of spatial correlations. The question of the particular relation between the size distributions of pores and throats has been repeatedly raised in the literature. Typically, the following relations:
111
PROBING POROUS MEDIA
SIZE AND VOLUME DISl’RIBUTIONS, ‘LOW ASPECT RATIO NETWORK THROAT RADIUS BODY SIZE PORE VOLUME (4
7 -4
E s 3.
0
2
2;.
5
0
01
o
10 20 3b 40 50 60
PORE RADIUS
Tt
50
100 150 200
0 2 4
6
8 10 12 14
( p m ) PORE SIZE q,(p m ) PORE VOLUME V$
nl )
FIG.17. Actual and inferred pore size and volume distributions from the inversion of simulated APEX in a cubic lattice with low-aspect-ratio biconical pore segments. Reprinted with permission from Toledo et a[., S P E Form. Eual., 46. Copyright 1994 SPE.
have been postulated by Mason [ 3 3 ] , Chatzis and Dullien [ 9 1 ] , and Mayagoititia et al. [69-721 (their “first law”), respectively. Actually, in a pore network, two conditions are required: (i) a throat selected at random must have a size smaller than its adjacent two pores and (ii) a pore selected at random must have a size larger than its adjacent 2 throats. These two conditions can be expressed by the following two relations between the pore size distributions:
u*(4 = 2
r
4(Y)as(Y)g(Y - r ) dY%
(50)
where g ( x ) 2 0 is the pdf of the difference between the size of a throat and its smallest adjacent pore, with the property g ( x ) = 0 for x < 0, and
a,(r)
=
s:
c1
-
P ( Y ) l Z - l a,(y)k(r - Y) dy,
(51)
where k(x) 2 0 is the pdf of the difference between the size of a pore and the Iargest of its adjacent throats, with the same properties as g, namely, k(x) = 0 for x < 0. Mason’s results follow by taking k ( x ) = 6(x) in Eq. (51), while Chatzis and Dullien’s expression results by taking g(x) = 6(x) in Eq.
112
PROBING PORE STRUCTURES
(50), where 6(x) is the Dirac delta function. Specifying these two functions will lead to different relations between the pore size distributions. The behavior of the processes will also be influenced by possible spatial correlations. These can develop either because adjacent pores and throats have a certain correlation, which may then propagate to create large-range spatial correlations in the network (e.g., see Zgrablich et al. [lo91 for sorption and Li et al. [23], and Tsakiroglou and Payatakes [I101 for mercury porosimetry), or because spatial correlations exist as a result of the history of the formation of the medium (for example, due to diagenesis, chemical alteration, etc.). The effect of pore-throat correlations on mercury porosimetry has been numerically simulated and found to be important [l lo]. More generally, desorption and mercury intrusion in correlated systems must be analyzed by correlated percolation [lll-1173. Aspects of this process have been studied by Renault [lll] and Prakash et al. [112], who found that percolation thresholds depend on the structure of the correlation function. For example, for a correlation function with a slow H > 0), Prakash et al. [I121 found (algebraic) decay (scaling as that the site percolation threshold in a square lattice decreases with H and approaches the value of 0.5 at H = 0 (compared to its random value of 0.59). For the case of growing spatial correlations, as is the case with self-affine fields of the fF3m type, percolation thresholds become random variables with a variance that increases with the Hurst exponent [I 14-1 171. Ensembleaverage percolation probability curves were computed as a function of the Hurst exponent [117]. These curves have an effectively lower percolation threshold and near the threshold display a behavior similar to a finite-size effect in uncorrelated percolation. Given the stochastic aspects of this problem and its similarity to a finite-size effect, the unmasking of long-range correlations by inverting desorption or mercury intrusion data would be a difficult undertaking.
- lcI-H,
3.5 Conclusions Sorption isotherms and mercury porosimetry are quite useful tools for the identification of key properties of pore surfaces and porous media in general. Surface roughness, pore size distributions, and possibly pore network connectivity can be probed by such methods. Given the nonuniqueness in the inversion of the data in various cases and the use of various assumptions in the forward modeling, however, interpretations using the current methods must be done carefully. These include identifying the various regimes for which a scaling behavior applies at low pressures in sorption or at high capillary pressures in mercury porosimetry, assessing the
REFERENCES
113
relative volume contributions of pores and throats from the analysis of adsorption data, and identifying throat size distributions and the connectivity of the porous medium for desorption and mercury intrusion data. Despite the significant progress that has been made, important issues still remain open, including the particular interrelation in the sizes of pores and throats and the identification of spatial correlations.
Acknowledgments The author would like to acknowledge the assistance of Lang Zhan in composing some of the figures of this chapter. The constructive criticism of an earlier draft by R. A. Guyer is also acknowledged. Given the space limitations, the references cited form only a partial list of the extensive literature of the various fields treated in this chapter.
References 1. N. R. Morrow, Ind. Eng. Chem. 62, 32 (1970). 2. A. W. Adamson, Physical Chemistry of Surfaces, Wiley, New York (1990). 3. S. J. Gregg and K. S. W. Sing, Adsorption, Surface Area and Porosity, Academic Press, New York (1982). 4. F. A. L. Dullien, Porous Media: Fluid Tvansport and Pore Structure, Academic Press, New York (1st ed., 1979; 2nd ed., 1991). 5. J. Lyklema, Fundamentals of Interface and Colloid Science. Volume Liquid Interfaces, Academic Press, London (1995).
II: Solid-
6. D. Stauffer and A. Aharony, Introduction t o Percolation Theory, Taylor and Francis, London (1992). 7. D. H. Everett, Langmuir 9, 2586 (1993).
8. M. Jaroniec and R. Madey, Physical Adsorption on Heterogeneous Solids, Elsevier, New York (1988). 9. A.-L. Barabasi and H. E. Stanley, Fractal Concepts in Surface Growth, Cambridge University Press, Cambridge (1995). 10. T. Halpin-Healy and Y.-C. Zhang, Phys. Rep. 254, 215 (1995). 11. B. Mandelbrot, The Fractal Geometry of Nature, W. H. Freeman, New York (1982). 12. J. Feder, Fractals, Plenum Press, New York (1988). 13. H.-0. Peitgen and D. Saupe (eds.), The Science of Fractal Images, Springer Verlag, New York (1986). 14. A. V. Neimark, Phys. Rev. B 50, 15435 (1994).
114
PROBING PORE STRUCTURES
15. D. Avnir (ed.), The Fractal Approach to Heterogeneous Chemistry, Wiley, New York (1989). 16. P. G. de Gennes, in Physics of Disordered Materials, D. Adler, H. Fritzche, and S. R. Ovskinsky, eds., p. 227, Plenum Press, New York (1985). 17. P. Pfeifer and M. W. Cole, New J . Chem. 14, 221 (1990). 18. M. Kardar and J. 0. Indekeu, Europhys. Lett. 12, 161 (1990). 19. P. Adler, Porous Media: Geometry and Transports, Butterworth-Heinemann, London (1992). 20. P. B. Balbuena and K. E. Gubbins, Langmuir 9, 1801 (1993). 21. A. C. Payatakes, C. Tien, and R. M. Turian, AIChEJ 19, 58 (1973). 22. K. K. Mohanty, H. T. Davis, and L. E. Scriven, SPE Res. Eng., 113 (1987). 23. Y. Li, W. G. Laidlaw, and N. C. Wardlaw, Adu. Colloid Interface Sci. 26, 1 (1986). 24. C. D. Tsakiroglou and A. C. Payatakes, J . Colloid Interface Sci. 137, 315 (1990). 25. M. A. Ioannidis and I. Chatzis, J . Colloid Interface Sci. 161, 278 (1993). 26. P. G. Toledo, L. E. Scriven, and H. T. Davis, SPE Form. Eual., 61 (1994). 27. N. A. Seaton, Chem. Eng. Sci. 46, 1895 (1991). 28. N. A. Seaton, J. P. R. B. Walton, and N. Quirke, Carbon 27, 853 (1989). 29. H. Liu, L. Zhang, and N. A. Seaton, Chem. Eng. Sci. 47, 4393 (1992). 30. H. Liu, L. Zhang, and N. A. Seaton, Langmuir, 9, 2576 (1993). 31. H. Liu, L. Zhang, and N. A. Seaton, J . Colloid Interface Sci. 48, 285 (1993). 32. H. Liu, L. Zhang, and N. A. Seaton, Chem. Eng. Sci. 49, 1869 (1994). 33. G. Mason, J. Colloid Interface Sci. 88, 36 (1982). 34. G. Mason, Proc. R. SOC.London A 390,47 (1983). 35. G. Mason, J . Colloid Interface Sci. 95, 277 (1983). 36. G. Mason, Proc. R . SOC.London A 415,453 (1988). 37. V. P. Zhdanov, V. B. Fenelonov, and D. K. Efremov, J . Colloid Interface Sci. 120, 218 (1987). 38. M. Parlar and Y. C . Yortsos, J . Colloid Interface Sci. 124, 162 (1988). 39. M. Parlar and Y. C. Yortsos, J . Colloid Interface Sci. 132, 425 (1989). 40. I. Fatt, Trans. A l M E 207, 144 (1956). 41. R. G. Larson, L. E. Scriven, and H. T. Davis, Nature 286,409 (1977). 42, P. G. de Gennes and E. Guyon, J . Mec. 17, 403 (1978). 43. G. C. Wall and R. J. C. Brown, J . Colloid Interface Sci. 82, 141 (1981). 44. R. I. Masel, Principles of Adsorption and Reaction on Solid Surfaces, Wiley, New York (1996). 45. D. P. Valenzuela and A. L. Meyers, Adsorption Equilibrium Data Book, Prentice Hall, Englewood Cliffs, NJ (1989). 46. K. S. W. Sing, D. H. Everett, R. A. W. Haul, L. Moscou, R. A. Pierotti, J. Rouquerol, and T. Siemineiewska, Pure Appl. Chem. 57, 603 (1985).
REFERENCES
115
J. J. Pickell, B. F. Swanson, and W. B. Hickman, SOC.Per. Eng. J., 55 (1966). H. H. Yuan and B. F. Swanson, SPE Form. Eva!., 17 (1989). D. Dollimare, P. Spooner, and A. Turner, Surface Tech. 4, 121 (1976). D. Oliver, S P E Form. Eval., 290 (1992). G. F. Carrier, M. Krook, and C. E. Pearson, Functions of a Complex Variable, McGraw-Hill, New York (1966). 52. C. W. Groetsch, The Theory of’ Tikhonou Regularizatton for Fredholm Integral Equations of the First Kind, Pitman, London (1984). 53. V. S. Mamleev and E. A. Bekturov, Langmuir 12,441 (1996). 54. D. Avnir, D. Farin, and P. Pfeifer, J . Chem. Phys. 79, 13566 (1983). 55. D. Avnir, D. Farin, and P. Pfeifer, J . Colloid Interface Sci. 103, 112 (1985). 56. J. M. Drake, P. Levitz, and J. Klafter, New J . Chem. 17, 77 (1990). 57. S. Brunauer, P. H. Emmett, and E. Teller, J . Amer. Chem. SOC. 60, 309 (1938). 58. P. Pfeifer, Y. J. Wu, M. W. Cole, and J. Krim, Phys. Rev. Lett. 62, 1997 (1989). 59. A. V. Neimark, Ads. Sci. Tech. 7,210 (1990). 60. H. T. Davis, Europhys. Lett. 8, 629 (1989). 61. J. C. Melrose, paper no. SPE18331 presented at the 63rd SPE Annual Fall Meeting, Houston, TX (1988). 62. D. Avnir and M. Jaroniec, Langrnuir 5, 1431 (1989). 63. Y. Yin, Langmuir 7, 216 (1991). 64. A. V. Neimark, in Fundamentals of Adsorption, M. D. Le Van (ed.), Kluwer Academic, Boston (1996). 65. M. Kardar, G. Parisi, and Y.-C. Zhang, Phys. Rev. Lett. 56, 889 (1986). 66. J. B. Sweeney. H. T. Davis, L. E. Scriven, and J. A. Zasadzinski, Langmuir 9, 1551 (1993). 67. J. C. Melrose, Langrnuir 3, 661 (1987). 68. D. H. Everett and J. M. Haynes, J . Colloid Interface Sci. 38, 125 (1972). 69. V. Mayagoitia, F. Rojas, and I. Kornhauser, J . Chem. SOC.Faraday Duns. I 81, 2931 (1985). 70. V. Mayagoitia, F. Rojas, and I. Kornhauser, J . Chem. SOC.Faraday Trans. I 84, 785 (1988). 71. V. Mayagoitia, B. Gilot, F. Rojas, and I. Kornhauser, J . Chem. Soc. Faraday Trans. 1 84, 801 (1988). 72. V. Mayagoitia, M. J. Cruz, and F. Rojas, J. Chem. SOC.Faraday Trans. I 85, 207 1 (1989). 73. M. W. Cole and W. F. Saam, Phys. Rev. Lett. 32,985 (1974). 74. P. C. Ball and R. Evans, Europhys. Lett. 4, 715 (1987). 75. P. C. Ball and R. Evans, Langmuir 5, 714 (1989). 76. R. Evans, U. M. B. Marconi, and P. Tarazona, J . Chem. SOC.Faraday Trans. 2 82, 1763 (1986). 47. 48. 49. 50. 51.
116
PROBING PORE STRUCTURES
77. C. G. V. Burgess, D. H. Everett, and S . Nutall, Pure Appl. Chem. 61, 1845 (1989). 78. C. Lastoskie, K. E. Gubbins, and N. Quirke, Lungmuir 9, 2693 (1993). 79. C. Lastoskie, K. E. Gubbins, and N. Quirke, J . Phys. Chem. 97, 4786 (1993). 80. K. Binder and D. P. Landau, J . Chem. Phys. 96, 1444 (1992). 81. P.I. Ravikovitch, S. C. 0. Domhnaill, A. V. Neimark, F. Schuth, and K. K. Unger, Langmuir 11,4765 (1995). 82. D. Beaglehole and H. K. Christenson, J. Phys. Chem. 96, 3395 (1992). 83. E. J. Wanless and H. K. Christenson, J. Chem. Phys. 101, 4260 (1994). 84. H. K. Christenson, Phys. Rev. Lett. 73, 1821 (1994). 85. J. E, Curry and H. K. Christenson, Langmuir 12, 5729 (1996). 86. M. Jaroniec, Langmuir 11, 2316 (1995). 87. R. Lenormand, C. Zarcone, and A. Sarr, J. Fluid Mech. 135, 337 (1983). 88. A. V. Neimark, Colloid J . 46, 813 (1984). 89. C. Du, PhD Dissertation, University of Southern California (1996). 90. P. Rajniak and R. T. Yang, AIChEJ 39, 774 (1993). 91. 1. Chatzis and F. A. L. Dullien, Int. Chem. Eng. 25, 47 (1985). 92. P. G. Toledo, L. E. Scriven, and H. T. Davis, SPE Form. Eval., 46 (1994). 93. G. P. Androutsopoulos and R. Mann, Chem. Eng. Sci. 34, 1203 (1979). 94. R. G. Larson and N. R. Morrow, Powder Tech. 30, 123 (1981). 95. A. A. Heiba, M. Sahimi, L. E. Scriven, and H. T. Davis, SPE Res. Eng., 7 (1992). 96. C. E. Diaz, I. Chatzis, and F. A. L. Dullien, Tramp. Porous Mediu 2,215 (1987). 97. G. P. Matthews, C. J. Ridgway, and M. C. Spearing, J . Colloid Interface Sci. 171, 8 (1995). 98. B. K. Mishra and M. M. Sharma, AIChEJ 34, 684 (1988). 99. Z. Zhou and E. H. Stenby, 'Ransp. Porous Mediu 11, 17 (1993). 100. A. H. Thompson, A. J. Katz, and R. A. Raschke, Phys. Rev. Lett. 58, 29 (1987). 101. A. J. Katz, A. H. Thompson, and R. A. Raschke, Phys. Rev. A 38, 4901 (1988). 102. J.-N. Roux and D. Wilkinson, Phys. Rev. A 37, 3921 (1988). 103. S. Roux and E. Guyon, J . Phys. A: Math. Gen. 22, 3693 (1989). 104. K. J. Maloy, L. Furuberg, J. Feder, and T. Jossang, Phys. Rev. Lett. 68, 2161 (1992). 105. E. W. Washburn, Proc. Natl. Acad. Sci. 7 , 115 (1921). 106. W. R. Purcell, Pans. AIME 186, 39 (1949). 107. N. T. Bourdine, L. S. Gournay, and P. P. Reichertz, Puns. AIME 189, 195 (1950). 108. A. J. Katz and A. H. Thompson, Phys. Rev. B 34, 8179 (1986). 109. G. Zgrablich, S . Mendioroz, L. Daza, J. Pajares, V. Mayagoitia, F. Rojas, and W. C. Conner, Langmuir 12, 179 (1996). 110. C. D. Tsakiroglou and A. C. Payatakes, J . Colloid Interface Sci. 146,471 (1991).
REFERENCES
117
111. P. Renault, Tramp. Porous Media 6, 451 (1991). 112. S. Prakash, S. Havlin, M. Schwartz, and H. E. Stanley, Phys. Reu. A 64, 1724 113. 114. 115. 116. 117.
(1992). M. B. Isichenko, Rev. Mod. Phys. 64, 961 (1992). J. Schmittbuhl, J.-P. Vilotte, and S. Roux, J. Phys. A: Math. Gen. 26, 6115 (1993). M. A. Ioannidis and I. Chatzis, Water Resour. Res. 29, 1777 (1993). M. Sahimi, AIChEJ 41, 229 (1995). C . Du, C. Satik, and Y. C. Yortsos, AIChEJ 42, 2392 (1996).


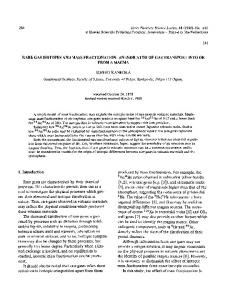
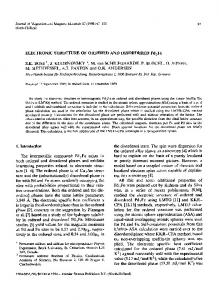


![2.1. Introduction ~ dt ]~HV d3q - Science Direct](https://m.moam.info/img/260x300/21-introduction-dt-hv-d3q-science-direct_5ba80d93097c47565f8b4798.jpg)

![[31] PHARMACOLOGIC NHIBITORS OF MKK1 AND ... - Science Direct](https://m.moam.info/img/260x300/31-pharmacologic-nhibitors-of-mkk1-and-science-dir_5b97b909097c47c3238b468d.jpg)


