Barrie and Street [17] measured a value of. 4.?eV for Na,O, Flodstrijm et ...... M.B. Roberts. D. Latham and ... A. Barrie und F.J. Street, J. Electron Spectty. Related.
Chemical Physics 43 (1970) 117-133 0 North-Holland Publishing Company
ELECTRONIC STRUCTURE OF Rb, Cs AND SOiME OF THEIR METALLIC STUDIED BY PHOTOELECTRON SPECTROSCOPY
OXIDES
Received 28 March 1979
Photoemission mcasurcmcnts with He and Ne resonance lines and Al Kz radiation arc reported on bulk sample!: of the alkali metals Rb. Cs. their suboxides Cs;O. Cs, ,03 and (Cs, ,O,)Rb,. For comparison. the He1 spectrum of the “normal” oxide CszO is added. The occurrence of ionic cluslers in a metallic marrix is typical for rhc subosidcs. Binding energies, Auger transitions. and electron concentrations arc discussed. The spectra of the suboxides show a narrow non-bonding oxygen 2p band at 2.7 eV. Different binding energies arc found for Cs atoms in Ihe clusters and for the atoms in the met;lllic regions of (Cs, ,031Cs, 0. The compound Cs, ,O, consists of ionic [CsI , 0J5 l clusters. which are bound by 5 free electrons in accordance with the chemical bond model.
1.
Introduction
Alkali metals and the alkali metal oxide systems have been investigated under many different aspects [IA]. Metal-rich oxides with compositions in the range between M and M20 (suboxides) are a class of new materials with fascinating structural and physical properties. For example. these suboxides are important with respect to the oxidized films of rubidium and especially of cesium, used for the activation of photocathodes [j]. This paper deals with the photoemission properties of the alkali metals and their suboxides. The investigations are essential to understand the electronic properties and the chemical bonding of these compounds. Measurements on the elements are of considerable interest, since they provide informution about these neatly free electron-like metals and are necessary to understand the photoemission spectra of the suboxides. In addition. the “normal” oxide Cs,O is also investigated. At first an introduction to the structures of the suboxides is given. In the experimental part special attention is paid to the preparation and purity of the samples. Table 1 lists the alkali metal suboxides which are known [4,6-91. The main characteristics
of the crystal structures are the clusters Rb902 and Cs, ,03, which are relared in a simple way: The Rb,O, cluster consists of two slightly distorted face sharing octahedra, which are neatly centered by oxygen atoms. Bonding of a third octahedron via two faces leads to the cluster Cs, ,O,. The compounds Rb,O, [7] and Cs, ,O, [S] consist of such clusters. Intercalation by stoichiometric amounts of additional metal atoms leads to the other compounds given in table I. Metastable (e.g. R b0,. I sy) and non-stoichiometric compounds (CsO,,,,_,~,,) also exist. but our investigations are confined to some of the typical cluster compounds. The interatomic distances for Cs-Cs contacts between difretent
Table 1 List of alkali metal suboxides with known structures. More investigations are in progress with respect to metastable and amorphous phases [6] Rb,OZ (Rb,O?)Rb, G Rb,O
Cs, 10, (Cs, ,o,~cs~cs,o (cs,,o,)cs,,~cs,o (Cs, ,OJRb (Cs, ,0,)Rb2 (Cs, 10JRbi
clusters (z 530 pm) are similar to those in pure cesium and are much longer than those within the clusters (370-430 pm). According to the distances. the clusters have to be described as ionic units. which are linked by metallic bands. A very simple bond model is derived from the valencies of the elements: 6 of the 11 electrons from the cesium cluster atoms are transferred to the 3 oxygen atoms. leaving 5 electrons for the metallic bonding of the clusters. So the compound Cs, ,03 is formulated as [Cs, ,O,]j’ and 5e-. The compound Cs,O contains Cs, 1O3 clusters and oxygen iiee regions of metal atoms. The clusters are the ionic part of the structure and rhe 10 metal atoms (per cluster) form ;Lpurely metallic region. Definitely, this idea of chemical bonding is based on “circumstantial evidence” only. namely on atomic arrangement and interatomic distances. Photoelectron spec!roscopy is expected to yield a quantitative proof for the bond modcf. c.g. via the determination of the free electron concentrations Furthermore it is of analytical interest as to whether or not the metal atoms in different bonding states an be distinguished. Last. but not least. the photoemission process in suboxides is of interest with respect to their application in photocathodes. Some short information concerning some of these topics has been given elsewhere [6. lo]. This work concentrates on the first two topics. it contains a detailed discussion of the photocmission spectra obtained with the different photon energies /W = 16.5.21.2.26.9, and 40.8, as we!l as 1486.6 eV.
2. Experimental
details
The pure alkali metals are prepared by reduction of their chlorides with calcium. The product is distilled twice under high vacuum conditions (p < 10-5 mbar) and then sealed in glass tubes under extremely purified argon. Samples of cesium handled under these conditions have been proved to contain less than 5 x 10-j x, by weight oxygen, as it can be determined from the melting properties [4]. The suboxides are synthesized by reaction of the alkali metals with oxygen. which can be produced by thermally decomposing mercuric oxide in a quartz crucible. By reweighing the glass ampoule and thus
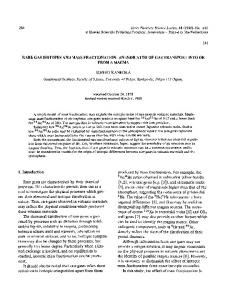
determining the necessary amount of mercuric oxide. the sample composition can be varied within an accuracy OT F0.l itt. “/;1 [I I]. A detailed description of the handling and of analytical and crystallographic results is given elsewhere [4,6]. Part of the measurements are performed in a VLICUUIII Generator ESCA III system, which requires an oblique position of the sample. Therefore. a special sample rod has been constructed. with a tipping crucible at the end (fig. lul. The temperature of the crucible can be changed from 100-600 K. The metals and the congruently melting suboxides (200-300 rngj are filled into small glass ampoules, sealed under vacuum and introduced into the spectrometer. After bakeout und a period of two days cooling (to prevent melting of the sample when moving it into the hot Faraday cage) the base pressure in the preparation chamber is in the range of IO-” mbar. Then the sample is molten and the glass ampoule can be broken by a sudden push with a mechanism screwed onto the gate valve in the ESCA III system. The sample drops onto the cold crucible wbicb is in a horizontal
position. The
crucible with the frozen sample is tipped into the oblique measuring position and the sample rod is moved into the analyzer chamber. where the base pressure is smaller than 5 X‘ IO- “’ mbur. The temperature of the suboxides is kept at = IO0 K during the whole period of measurements. thus minimizing the danger of changes in stoichiometry by evaporation of metal. Rb and Cs have been measured at 100 K, too. The incongruently melting compound Cs,,03 is introduced as such or prepared from a sample 01 original composition Cs,O in the spectrometer. At 300 K Cs,O is liquid and under UHV-conditions it looses cesium until the solid compound Cs, ,03 crystallizes according to the phase diagram [4,6]. In the same way the compound Cs,O is formed by thermal decomposition at 550-600 K. To prevent recondensation of Cs onto the sample, this compound Part
has been studied at 550 K.
of the measurements are performed in a
Leybold-Heraeus LHS-IO system. For the liquid samples this system provides the advantage of a horizontal sample surface. Therefore, samples are prepared in glass ampoules with a vacon-metal bottom (tig. I b). The latter is screwed onto the
119
AMPOULE
-47
VACON
-Nz
POSITIONS
OF CRUCIBLE
a
b
Fig. I. Preparation of ;llbilli metals and suboxides: (a) In tbc VG-spectrometur glass ampoules arc broken and the sample drops onto the tipped crucible which is :it the end ol the sample rod. (b) The vacon-metill bouom of’lhe special glass ampoulcs is screwed onto the sarnplc rod of the LHS-IO system. Normally. the glass brenks away completely.
rod and the class is broken away in the preparation chamber. Both spectrometer systems are equipped with ;I windowless differentially pumped cold cathode gas discharge lamp to produce the NeI (16.8 eV). He1 (21.2 eVI, NetI (26.9 eVI and He11 (40.5 eV) resonance lines. When operating the lamp, the rare gas pressure in the analyzer chamber is in the rnnge of 10-7 to IO-’ mbar. This value has been corrected for the sensitivity of the vacuum gauge. During XPS rncasurements the pressure is in the IO-‘” mbar rwion. Contamination of the sample surface leads .z to a slight change of the spectra after approximately 2 hours. Therefore, the samples huvc been scraped repeatedly with a tungsten brush. The experimental resolution is set to 0.1 cV for the spectra taken with the HeI radiation and to 0.2-0.3 eV for the NeI. NetI and He11 data. Typical count rates in the region of the 4p or 5p levels are I to 5 x IO3 counts/s with HeI, Nel, and NeII, and 10-100 counts/s with He11 radiation. We present the original spectra (figs. 2-6) iis well as spectra corrected for different transmission functions of the analysers. With the vacuum generator system the acceptance angle for electrons changes with kinetic energy T [I?]. Therefore, the measured intensities I,,, have been corrected according to I, = I,,,T/T,,, to yield the treated spectra. T,,, has been chosen as the kinetic energy at the corresponding Fermi level. sample
3. Results and discussion
Figs. 2 and 3 present the spectra obtained from pure Rb and Cs, respectively. The energy scales are referred to the Fermi levels (E,:: = 0.0 eV binding energy) observed with the indicated resonance line: count rates are arbitrary. In the spectra of Rb and Cs. the filled conduction band (5s or 6s) is followed by iln energy loss due to the creation of surface plasmons (SKI@ In the NeI spectrum of Rb Auger electrons overlap the conduction band region. The NVV Auger transitions with their surface pl:~smon loss structures and the spin-orbit split core levels 4p,,? and 4p,,, can be observed in the spectra of Rb. CS shows the corresponding OVV Auger transition and the 5p levels. All structures are superimposed on a smooth background of secondary electrons. increasing towards low kinetic or high binding energies. With the 16.5 eV radiation both the Rb 4p and the Cs 5p electrons are excited. However. in the cases of Rb 4p and Cs jp,,, the primary electrons cannot overcome the work function, or they coincide with the maximum of secondary electrons. Excitation by satellite lines gives rise to mnny spurious peaks. Most of such complications occur in the NeII and He11 spectra, but even in the He1 spectrum of Rb the 4p electrons excited by the
120
BINOING
ENERGY
Fig. 2. Photoemissioo spectra of rubidium. The corresponding main excitation The binding energies are references to the Fermi level. For details see text.
23.09 eV resonance line are observed as a weak structure (wowl Although there are many satellite lines in the NeII and He11 resonltnce spectra, every observed detail can be accounted for. As an illustration the entire assignments of the peaks observed in the NeII spectrum of Cs are given, and the He11 spectrum is compIeteIy explained for Rb. All struclures we labelled alphabetically with small letters. For primary electrons the excitation energies are given in parentheses. The HeII spectrum of Rb consists of the following structures: (a) conduction band (in? = 40.81 eV); (b) part of the energy loss nw,, of (a), superimposed by (cl; (cl 4~3,~ (j&24); (d) 4p,,? (j2,24), and 4~3,~ (51,2); (e) 4e3,, (51,W; (fl4p,,, (51,2); (8) 4P1jz (51,02); (h) 4p,,, (48,37); (i) 4p,,? (48,37); (k) fqP of(h); (I) ho, of(h), and ho,, of(i); (m) Bw, of(i); (n) 4p,,, (40.81); (0) 4pIj2 (40.81); (p) ho,, of(n);
CeVj line is
given in the left region of the figure.
(q) IIW, of(n), and hqp of(o); (f) CB (21,22); (s) /IQ,, of(r); (t) N,,VV; (II) NIIIVV. With the NeII source and the Cs-sample the observed structures are assigned as: (a) conduction band 1za= 27.8 eV; (b) CB (26,9); (c) .5p,,, (38,O); (d) Sp,/, (38.0): (e) 5p,,? (34,7L (0 jp,,, (34,2); (g) Sp,,, (34,7); (h) 5p,,, (34,X (i) %J,,~ (3&5); (k) 5p,,, (30,5)r (1)SP,,~ (27,8); (m) 5p,,, (X9); (n) 5p,,, (27,% (o) 5p,,, (X9); (p) GVV; (9) flLLisP ofp; (r) 5puz (16,s); (s) maximum of secondary eIectrons. Using different excitation energies, electrons of the same binding energy are emitted with different kinetic energies. Since the escape depth ir~ea~ts for electrons in cesium and rubidium from IO to 50 eV kinetic energy, the surface and volume plasma losses associated with the 5p and 4p core electrons can be separated in the He11 spectra.
Fig. 3. Photoemission
Speclra or cesium.
obtained with the for~r resonance lines NcI. HeI. Nell and Hell. Binding energies
are referred to the Fermi level. The assignments are givcn in the text.
Photoemission from the conduction band region of Rb and Cs has already been investigated by Smith and Fisher [ 133 using excitation energies below 10.2 eV. With these photon energies the surface plasmon loss of the conduction band structure is also observed.
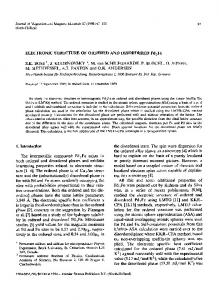
In fig. 4 the HeI data of the samples Rb, c’s, Cs,O, (0, ,O,)Rb,, and Cs, ,O, are compared. The metallic character of the suboxides is proved by the finite electron density at the Fermi level. The most striking feature in the spectra of the suboxidez, is the extremely narrow oxygen 2p band (fwhm = 0.6 eV) at 2.7 eV binding energy. This structure is accompanied by an energy loss, too.
In the spectrum of Cs,O~(Cs, I03)Cs,0 two of spin-orbit split Sp levels due to Cs in two different bonding states occur. Peaks A and A’ correspond to the 5p levels of the partly ionic cesium in the Cs, !03 clustt~; B and B’ have to be attributed to the intercalated Cs atoms (CS,~). The compound (Cs, , 03jRb, consists of Cs, I O3 clusters and additional Rb atoms. So the photoemission spectrum shows the peaks A and A’ originating from the ionic Cs, ,O, c!us:ers well separated from the structures B and B’ due to the intercalared Rb atoms (Rb,). In the spectrum of the compound CS, , 0, only the peaks A and A’ are observed, which originate from the oxidized Cs atom. Spectra ofthe suboxides Cs70 and (Cs, ,O,)Rb, obtained with different excitation energies are shown in figs. 5 and 6. As the core levei peaks of the pairs
spectra. An estimate for the photoionization cross sections of oxygen 2p electrons leads to a nearly constant value between 5 and 50 eV [14]. For js- or 6s-orbit& the photoionization cross sections decrease when the excitation energy is varied from 20 to 40 eV [IS]. The low electron density at the Fermi level and the fact that there is no minimum between the conduction band and the 0 2p band in the He11 spectra of suboxides might indicate a
small deviation from a simple s-type metal. In the He11spectra of the pure metals Rb and Cs ;I well defined s-band is observed.
Photoemission spectra ofall suboxides containing Cs, 1O, clusters show the narrow (0.6 eV fwhm) structure at 2.7 eV binding energy due to photoemission from the oxygen 2p band. A spin-orbit splitting of the 0 2p level cannot be observed. This splitting has been calculated to be 0.04 eV [ 161, which is smaller than the experimental resolution. The binding energy of 2.7 eV for the 0 2p electrons is much smaller than it is known for other oxides. Barrie and Street [17] measured
a value of
4.?eV for Na,O, Flodstrijm et al. [IS] reported 7.1 eV for oxidized aluminum. There is a simple BINDING
ENERGY
tev1
Fig. 1. Comparison of the HcI-photoemission spectra of the pure metals Rb and Cs with the suectra obtained for
the suboxides Cs,O. (Cs,,O,)Rb, ani CS, ,O,.
qualitative explanation for the low binding energy of the 0 2p electrons in suboxides: The stabilizing
electrostatic lield on the O’- ion formed by the surrounding (partially shielded) univalent cations at large distances is weak: the osygen in the.subosides behaves as weakly stabilized, nearly “gas-like”
suboxides are much broader than those of the metals, plasma-loss structures can be clearly observed only for the oxygen 2p band. Unfortunately, in the He11spectra the corresponding energy region is superimposed by photoemission of the Cs 5p electrons. which are excited by the 48.4 eV line. An exceptional case is found in the He11 spectrum of&O (fig. 5). This spectrum has been taken in 6 hours with two intermediate scrapings of the sample surface. Here the intensity of the emitted 0 2p electrons excited with the 48.4 eV line is high enough to observe the surface and volume plasma-loss structures simultaneously. In the He11 spectra of the suboxides, the valence band structure is much weaker than in the He1
O’- ion. This gas-like nature of the 0’ - ions explains also the small half width of the 0 7p band. In the case ofsolid oxides, sharp structures have been reported only for core levels [l9]. Bonding electrons occupy much broader bands. For the metallic NbO the 0 Zp band is reported to be z 5 eV broad [IO]. The narrow oxygen Zp band seems IO be typical for the metallic oxides of the alkali metals rubidium and cesium. The 0 Zp band becomes broader in the compound Cs,O (see lig. 7). It an be excluded that the observed broadening (fivhm Y I.5 eV) at 550 K is caused by the high temperature a!one. Phonon broadening gives approximately 0.1 eV per 200’ raise in temperature [21]. Differences of the oxygen
xl0
:%p*
*
x
_!
I,-
0
BINDING
; , 5
ENERGY
, 10
,
6
,:I,.
I,
20
CeVl
Fig. 5. Photoemission spectra of&O
G (Cs, ,O,lCs,,: excitation by the Ncl, Hel, NelI. and He11resonttnce lines. The spectra arc referred lo the silme binding energy. The Fermi level obtained with the corresponding muin excitation energy is taken as 0.0 eV binding energy. _ _
environment in the bulk and at the surface of Cs,O in contrast to the uniformly surrounded O’- ions interactions between neighboring oxygen ions in the lattice of Cs,O give rise to the broad 0 2p band.
at 100 K 1241. A sharp oxygen 2p band is observed. too. which broadens with increasing oxidation. The authors interpret the sharp d Zp band with the assumption of dissolved isolated O’- ions lying below ;I surface layer of metallic cesium. This
As binding energies and peak widths have been
interpretation
observed to be independent of variations of the measured sample thickness (transparent films to layers of 2 mm thickness), charging should not affect the results for &hecompound CslO. All earlier investigations have been made with photon energies smaller than 11 eV. Therefore, these spectra do not contain any information about core levels of the metal atoms and their characteristic changes. Helms and Spicer [22,23] report a narrow oxygen 3p band in photoemission studies during the early stage of the oxidation of strontium. Gregory et al. have investigated the oxidation of cesium layers over a wide range of oxygen exposure
based on the knowledge of the structures of the suboxides. But at 130 K difJudon is too slow to allow chemical equilibrium to be reached. Thus the surface films are heterogeneous and H discussion in terms of well defined compounds is impossible. Petersson and Karlsson have investigated oxidized potassium films [25] and they find the oxygen 2p band at 2.7 eV: it has a width of 2 I eV, which is only that narrow ilt an exposure of I.5 I. oxygen. At 3 1, it broadens and shifts towards higher binding energies. Several attempts failed to produce porassium suboxides as bulk samples [ZG, 271. The observation of a sharp oxygen Zp band at 2.7 eV
in the clusters of the suboxides
as well as possible
is not too far from our conclusions
n ::
I: II
hv = 21.2eV /
f : / ’ : #’ : ‘-1 Hel
fi
B;NDINGm
ENERGY
d
Fig. 6. Photoemission sprcrra of (Cs, 1O,)Rb,, obtained with Nei, HeI, NeII. and He11 radiation. The energy scale (binding energies) is referred to the Fermi level. might be a first hint to the formation of such phases. In the same way the results of Helms and Spicer [22,23] with the heavier alkaline earths might be interpreted. 3.4. cow
lewls
of tk! rrretdiGOlllS
The HeI- and HeWspectra (tig. 2) observed from clean rubidium show an intensity ratio of approximately 2: 1 for the Rb 4p,,?- and 4p,,z-structures, which represents the occupation of both levels according to the statistical branching ratio. In contrast to Rowe et al. [XI] we do not observe a change of this ratio as a function of excitation energy. For cesium, the Sp,,,-structure is observed to be much broader (tig. 3). This fact is not entirely due to secondary electrons generated from the surface plasmon loss of the 5~,,~ electrons; it is another evidence for the Coster-Kronig decay of the 5~,,~ core hole. This feature will be discussed in detail in section 3.6. For the clean metals the observed 4p- or Sp-peaks are sharp, but for the s;lboxides they become broad and less pronounced. This result is due to the variety of interatomic distances which occur for the cluster
BINDING
ENERGY
teV1
Fig. 7. Comparison of the He1 spectrum ofCs,O with those of Cs, Cs,O, and Cs, ,O,. These data have been corrected according to the transmission function of the energy analyzer of the VG ESCA III system (compare with the raw data of fig. 4). For Cs,O, the energy scale is normalized to the energy where the Fermi level of Cs, ,03 has been observed befcre heating the sample to produce cszo.
atoms as well as for the atoms in the purely metallic regions [6]. Different chemical shifts according to the variation in the bond length have been reported earlier [29]. Table 2 shows the binding energies of the 4p or Sp core electrons. In the last rows values from the literature are given for comparison. Our results for pure Rb and Cs agree very well with those of Oswald and Callcott [30] and with the value for Cs 5p,,, from Petersen [31]. But only in the present investigations the binding energies could be determined with respect to the ciearly observed Fermi edge. The binding energies labelled (A) and
Table Z Comparison of core level binding energies. The experimental error of the measured valurs is 20.1 eV. A and A’are the assignments for the core levels of the oxidized alkali metal atoms in the cluster. B und B’ stand for the core level peaks from atoms in the metallic regions of the suboxides Rb 4p,,,
Rh +,;z
15.7
Rb CS
_ _
(Cs,,O,)Rb,
(Bsardcn
;5”
(Oswald
Cs
(Pctcrsen
cs
A u A
12.1 Il.5 12.2 I I.5
14.0 A’ 13.2 B’ 14.0 K 13.1
8’
Il.6 I1.7(3)
A’ IX3 13.213)
_
[X2]) [JO])
14.0(3) _
l4.Y(41
15.3(3) _
;6.4(3,
[3 I])
(A’) of the metal atoms in the clusters vary only slightly with the different compounds and are similar to the binding energies observed for Cs,O. As Cs,O is a semiconductor, no Fermi edge can be observed and the peaks are rather broad. Therefore. the estimated error for the binding energies is 0.3 eV with CszO. In the metallic regions of the suboxides the core levels of the metal atoms exhibit nearly the same binding energies (B) and (B’Jas in the elements. This result shows that the atoms in the ionic and merallic parts of the structures are in different bonding states. The direction of the chemical shift is surprising: Atoms in the metallic regions of the suboxides show slightly higher or equal binding energies of the 4por jp-electrons compared to the pure metals. On the other hand the 5p doublet corresponding to the cluster atoms shifts by about 0.7 eV towards lower binding energies. In metals the binding energies of core electrons normally increase upon oxidation [33-361. Decreases in binding energies with respect to the metallic state have been reported for the oxides of silver, copper and cadmium [36]. But all these measurements have not been referenced to the Fermi level. So the cesium suboxides, especially the compounds (Cs, IO,)Cs,, and (Cs, ,03)Rbi, are the first samples. where this surprising shift in
5p,,,
16.1 A
Cs, 10, cs,o Rb Cs
15.3
5p,,,
16.1
(Cs,,O,lCs,0
B
cs
_ 11.4(j)
13.1(j)
Iz.aa I I .8(41
14.2121
binding energy is definitely proved. Hcrc the oxidized as well as the metallic state arc separatclj present in the same compound.
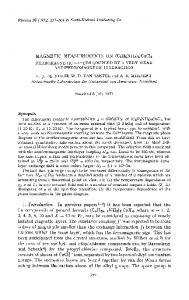
With Al Kz radiation cot-c levels of highcr binding energies can be excited. Fig. 8 shows the change of the Cs 3d structures upon oxidation. The spin-orbit split 3d levels are sharp in Cs and at leust two multiple volume plosmon loss structures are observable. These structures cannot be resolved in the spectrum ofCs,O. since the plasma frequency decreases. In addition. the splitting due to the CllCllliCill Shift (see section 3.4) is IXtllCr SIllall compared to the resolution of XPS. In the spectra of (Cs, 10,)Rbi the Cs 3d structures originate from cluster :ltoms exclusively. Therefore. the 3d structures are slightly sharper th;m with Cs,O. but still asymmetric. Only in the compound Cs,O the 3d levels appear n;lrrow, symrmtric and without energy loss. The 3d levels are the sharpest core levels which have been observed for these compounds. But even here, with values of the half-width ranging from 3 to 5 eV, the uncertainty in binding ene@es is kqe. In the case of the asymmetric structures the given binding energy of table 3 represents the energy
The kinetic energy of an Auger electron depends on the energy difference between the participating energy levels and the work function (1).but is independent of the excitation energy. The radiation source only limits the energy up to which core holes can be produced. The UV spectra of the pure metals Rb and Cs show Auger transitions caused by core holes in the N or 0 shells of Rb or Cs. respectively. An exact assignment for the observed Auger transitions is made by comparing the measured kinetic energies of Auger peaks with values calculated on the basis of measured binding energies for the same sample. Mostly the measured Auger peaks are broadened and asymmetric due to a superposition of their enet_gy loss structures. Thus it is convenient to use Ihe high energy edges for determining the energies of the Auger transitions. Neglecting relaxation effects, the approximate maximum kinetic energy of, e.g., the Auger transition N,,,VV in Rb should be: El;i,.maX+ @ = Q4P,;,). ,
725
730
BINDING
I
,
735
IL0
ENERGY
,
,
IL5
(1)
,
750
LeV1
Fig. 8. Comparison of the photoemission curves from the Cs 3d levels as observed with Cs. Cs70. (Cs,,0,1Kb7. and CszO. The excitation energy is 1486.6 eV. lhe resolution is I.2 eV. of the maximum~of the structure rather than its center. The values have been referenced to the Fermi edge as observed with IJPS. For,Cs,O the Fermi ed:e of the previously measured Cs,O compound has been used ;IS the zero point of the energy scale. Compared to the core levels of the metal atoms the intensities of the oxygen 1s structures are weak: For Cs 3d and 0 Is electrons the measured intensities are > 2 x IO’and < 10’ counts/s, respectively. Unfortunately, the Al Kg,., excitation of the Rb 4p and Cs 5p electrons superimposes the expected photoemission from the conduction band and the oxygen 7p band. According to out results UPS is more suited than XPS for the investigation of alkali metal suboxides, due to the fact that core
levels with sufficiently low binding energies occur.
Table 4 lists the measured values of (ELi,,,m:,r+ (1)) for an easy comparison with the energies from table 2. Column 4 in table 4 lists the assignmenls of the possible Auger transitions. From the values in table 4 and the spectra in fig. 3 it an be concluded that in pure cesium only the Auger transition O,,,VV is observed. The corresponding transition O,,VV is frusttnted, since the 5p,,, core hole is refilled quickly by an electron from the Sp,iz subshell. This CostetKronig transition gives rise to the lifetime btoadening of the jp,,? level [IO, 311. Even when the resulting energy of this transition is transferred to an electron in the conduction band. of course the electron cannot overcome the work function because of the low value of the spin-orbit splitting energy. In the pure Rb sample. the main Auger channel is the N,,,VV transition. but an additional weak structure is observed at the enetsy of the N,,VV transition, which has not been reported by Oswald and Callcott [30]. As the intensity ratio of the Auger peaks N,,,VV and N,,VV does not reflect the original intensity ratio of the 4~,,~ and 4~,,~ peaks, the Costet-Ktonig transition must be
Table 3 Core level binding energies as observed with AlKs excitation. Rb 0
The error of the last digit is given in parcnthws Ks,,O,lRb;
CS
Is
Rb 4p
[I-i-l] 1lLO(jl I 13.015~ ‘39. I(21 248.7(21 X6.7( IO)
Jdj!,
3dXl 3Pw 3Pw 3s Cs jp,,, xJl!Z 4d,.? Jd,:, 4P3:: JPW 4s
[lj.j] I 11.9(j) 113.9(j) 740.2(2) x%9(23
17.X) 14.X3)
7732) 7Y.W) 161.3(j) 172.4(j) X2.3( I01 726.3(2) 740.3tz) 1001.YlIO)
-
L
77.S(31 79.8(5l 161.3(51 172.9(10)
77.4(31 79.3(j) 161.0(51 171.9(j) 232.1(51
77.6(21 7Y.W)
716.,(X 7Kl.2(33
726.1(21 740.1(3)
725.115l 739.1(j)
1070.s~20~ ------------
---_
Table 4 Comparison of the observed high energy edges of Auger transitions with calculated values derived for each sample from its measured core level binding energies. Proposed transitions can be excluded if the calculated energy is smaller than the observed value. The assignments A and B indicate the cluster region or the metallic utoms. respectively. for which the Auger transition has been proposed. An asterisk indicates the derived Auger channel 0 bservcd high cncrgy edge [cV]
Observed intensity
cs
1X(11 16.1(l) 12.1(l)
strong very wca k strong
cs,,o,
17.3(2)
medium
12.2(11
medium
I3.6(31
\WJ
I2.W
weak
lj.3(ZI
medium
Rb
(0, lo,)cs,,
I cs;o
(Cs,,OjlRb7
#f; (0.swald [30]) Cs
(Petersen 1311)
15.001 I 1S(Z) 12.q5)
k
Possible transition
Nu,VV* N,,VV* O,,IVV* O,,VV Q,,VV(A) O,,VV(A’)f QVV(A) O,,,VV(BI* O,,WA’l O,,VV( BY* O,,,VW) O,,VV(A’t* N,,,vv(Bl* N,,VWB’) NuVV O,,,VV O,,,VV
assumed to occur for the metal rubidium, too. If a Costcr-Kronig
transition
hv= 21.2 eV
occurs, this relaxation
/
process
is about 1 to 3 orders of magnitude faster than ;I corresponding Auger tmnsition [37]. Since the core level peaks are broad in the suboxide spectra. the Auger structures become wider and less pronounced in comparison with the pure metals (see figs. 5 and 6). An additional reason for the weaker emission of Auger electrons is the decrease of the electron density in the valence band, which hits’been reported to cause the decrease in intensity of e.g. the aluminum L,,_,,,VVtransition from oxidation studies [3S]. Assignments are proposed for the observed Auger peaks of the suboxides assuming that the calculated value for a high energy edge may be larger but never less than the observed energy. The values do not agree so well us they do for the pure metals due to uncertuintics in determining the positions of the broad structures. All Auger peaks are smeared out. So it is not sure that the given list of Auger transitions is complete with respect to t!le suboxides. But it cm be concluded from table 4 that within the cluster Cs, ,O, the Coster-Kronip transition is suppressed so that the Auger transition O,,VV is observable.
The alkali metals are simple metals and their electrons can be &lirly well described with the model of the free electrdn 31s [GO]. The electric conductivities of the alkali metal suboxides and the elements Rb and Cs are similar [41]. As a first approximation, the conduction electrons of the alkali metal suboxides
might thus be treated as free electrons.
The density of states for free electrons is rela:ed to their kinetic energy by the equation [40] N(E) = iz-?
(2,,r,//j’)3/”El!‘,
(2)
where HIis the free electron mass. Such a parabolic shape of the conduction band (with some tendency to a triangular form1 is observed in the spectra of fig. 9, taking into account some l%lsilication introduced by PES. The triangtlar form exliibited by potassium is still more pronounced [42]. For cesium ;i parabolic form of the valence band is also reported [ 131.
b
BINDING
ENERGY &]
Fig. 9. The conduction band width cdn be obscrvcd directly in the He1 spew-a of Rb and Cs. In the cast of the suboxides. rhc 0 2p structure eacitcd by the 23.09 cV satellite line (indicated by the dashed lines) has to be subtrxted. Dotted curves give the estimated contribution of surface piasmons.
The shape of the conduction band is disturbed by satellite lines in the NeII spectrum of Cs. In the Nel spectrum of ‘Rb the conduction band region is superimposed by the Auger transitions NVV. Nevertheless. it is obvious that for Rb and CS the shape of the conduction band is nearly independent of the excitation energy and thus independent of the escape depth. This result is in good agreement with calculations of Davenport [39] showing that the form of the surface density of states for a half filled s-band is equal to its bulk density of states. Thus, the Fermi energy can be used to derive the number of free electrons in the suboxides. The Fermi energy E, is a function of the electron density N/V, according to the equation [4O] : E, = (h’/2!?2)(3ilZN/V)“3,
(3)
V represents the volume of the N electrons and the atomic cores.
Tdble 5 Calculation of the Fermi energy for Rh. CS and its suboxides and compclrison with tbc measured conduction band width (column 5). V is the volume per formula unit (Tu). N is the assumed number of clcctrons per rormul;l unit. E, are the Fermi energies _---_P’/Nuiat 100 K
(lO~“cm’) Kb CS Cs,,O, (Cs,,O,)Cs,, (Cs, ,O,)Rb,
89 III 960 2095 1600
Rb CS .----_
l.S(21 [3] l.5(2 [3]
K
EF talc.
(c-/fill (eV,l ---ISI I I I.56 I.08 5 I.% lj 1.31; I2
E,- mws. IeVI
I .a I) 1.4(l) 1.1121 I.*(11 1.7(2)
?.I(?) [30] 1.N) [30] e--_
The Fermi energies for Rb. Cs and suboxides derived from the HeI spectra according to fig. 9 itre summarized in table 5. These values bear a high amount of uncertainty due to the overlap of surface plasmon loss structures as well as a satellite excitation (23.09 eV) from the 0 Zp electrons. Fig. 9 illustrates the correction on the data. The measured Fermi energies E, of Rb and Cs correspond to the values which have been obtained with excitation energies up to II eV [7]. Oswald and Callcott [30] have used the observed width of the Auger transition peaks N,,,VV and O,,,VV to derive the values 2.1(Z) and 1.5(2) eV for Rb and Cs, respectively. From measurements of Smith and Spicer [3] the values i.S(3) and 1.5(Z)eV are calculated. In table 5 the calculated Fermi energies according to the chemical bond model described in section I (column 4) are compared with the measured data from the spectra (column 5). The agreement between measured and calculated values is convincing.
These results are a lirst experimental proof of the simple ionic bond model. However, when calculating electron densities from the band width, the relative experimental error is large. The density of the conduction electrons an bc derived more exaly from the plasma frequency. which is discussed in the following part. With nearly free electrons the plasma frequency wP is related to the electron concentration N via equation [43,44] :
4IUVlJ’ (*; = -- I I + Ac, w* ’
(4)
Ai:, represents the contribution of core polarization and interband transitions to the dielectric constant. c is the unit charge and MI*is the effective electron mass. For the surface plasma frequency cq. (4) changes into: w;,, = -
I
4rrNf!? .
Plasma frequencies of the alkilli rnctals have been determined from opticril constants [45,46] and electron energy loss measurements [47]. With photoelectron spectroscopy energy loss struclurcs arc observed from (mainly primary) electrons. which excite it plasma wave on their way through the solid. The kinetic energy of the electrons is reduced b) iw, or hw,,,. In Iig. IO black bars indicare the observed plasma frequencies. which are listed in table 6. With Rb and Cs energy loss structures from the conduction band peak and with Rb in addition the energy loss from the N,,,VV Auger peak is observed. A comparison of the measured values obtained for Rb and CS with data from the literature [13. 45-471 shows that the energy loss structures observed in the He1 spectra are due to surface plasmons. The same behavior is assumed to hold for !he metallic suboxides. The escape depth of electrons in Rb and Cs deviates strongly from the “universal curve” [ 13. 33, 341. The minimum is already found to occur at E 5 eV kinetic energy [ 131. The growing escape depth for &,, > 5 eV causes an irwwrsetl probing depth when passing from He1 to Hell spectra. Therefore. surface and volume’plasmo losses are observed for Rb and Cs in the He11 spectra. They are summarized in fig. I I. Unfortunately, strong photoemission from the Cs 5p electrons excited with the HeII* resonance line superimposes the plasma losses of the 0 Zp structure excited by HeII. Only in the case of Cs,O both the surface and volume plasma loss of the 0 2p structure are observed with this resonance line (see fig. 5). Any interpretation of these peaks in terms of shake-up processes or molecular adsorption can be rejected, since even ;t second surface plasmon could be observed in the He1 spectrum of ;I sample of
I
hv= 21.2eV
!
hv:L0.8&'
i-._ .;I _I.LLL._.~..L_!. BINDING
b
i
IO
I5
20
BINDING ENERGY [eVl Fig. IO. Comparison of the photocmission spectra of Cs. Cs;O. Cs,,O,: Rb and (Cs,,O,lRb,. obtained with He1 radiarion. Black bars indicate the distance between the the primary peak and its corresponding surface plasmon loss s~ructttre. These data have been corrected according to the transmission function of the analyzer.
approximate
composition
Cs,O.
Table 6 contains the vah~cs of hwp,, and Ircu, deduced from all spectra in columns 2 and 3. respectively. The energy of the surface plasmon changes from 2.0 eV for Cs to 1.55 eV for Cs,,O,. This decrease is a consequence of the reduced concentration of conduction electrons upon oxidztion. From the surFace and volume plasma energies electron concentrations have been calculated according to eqs. (4) and (j), and the results are listed in column 4. The values deduced from the volume plasma loss energies are given in parentheses.
1
IO
I .L_L I5
ENERGY
leV1
L..!
.
L
:
!
I_,
Fis. I I. Photoemission spcctrn obtuinrd with HcII radiation from Rb. Cs. Cs,O and (Cs, ,O,)Rb,. Volume ptilsrna ~OSSCS hJp and surhcc plasnla IOSSeS h_ are indicated by bars. Arrows indicate the energy diffcrcncr between excitation with the 40.5 eV and the 48.4 cV line. The energy scale is referred to the Fermi level observed with 40.8 eV excitation.
The calculations have been performed with the free electron mass III. The values At;- for core polarizatidn and interband transitions we 0.25 for Rb [46] and 0.37 for Cs [45j. In the case of (Cs, ,03)Rbi an averaged value Ae,(Rb, Csl according to stoichiornetry has been taken. Using the volume of one formula unit, the calculated number of free electrons per formula unit is given in column 6 of table 6. For Rb and Cs 1 electron per formula unit is expected (see column S). From the energies of the surface and volume plasmons 0.8 and 0.9 electrons per atom, respectively, are found. If the values of the effective masses III* are introduced, nearly 1 electron per atom Rb or Cs is found from Are, and z 0.9 e from hw,,,. But since the effective electron masses HI*are not known [or the suboxides and the volume plasma losses are observed only for Cs,O, no deviations Tram the free
Table 6 Observed values for the surface and volume plasma energy losses htu,, and hru,. resprctively. I/ is the volume per formula unit (fu). ,I is the calculated electron density per cm3. First the values calculated from liw,, arc given. Where Irtu, could be measured. the value )I derived from hro, is given in parentheses. From II and the volume L’per formula unit (ruulrhc clectron concentration per formula unit )I, is calculated. Since here values smaller than I are found for one atom Rb or Cs (see rat), II, is normalized and can be compared with the expected value N, which is derived from our bond model”’ -hw,p (UPS)“’ llWp (UPS)“’ I* A’ esp. V/FE II, &:il, (10” cm-‘) (IO-” cm’) (e-/fu) (e-/hi) k-p-u) (eV) (CV! Rb cs C% 10, (Cs,,O,Ks,,
1.3 2.0 I.55 1.75
(0, ,O,)Rb,
I .65
3.2 2.S
2.6
89 ill 960
8.6(9.4) kY(7.9) 4.3
5.4(6.X)
2095
4.8
I600
O.S(O.9) 0NO.Y) 4.1
I I 5
11.2~14.1: I;H15.61 7.6
9.5
I I 5
15 12
” Values from the lircralurc: litu,, (Rb): 1.46. ho,, (Cs): 2.1; hcu, (Rb): 3.41: htu, (Cs): 2.9. Whanp [45. 463. h,,
(Rb): 2.4. IIOJ,, (Cs): 2.1. Smith and Spiccr [3].
electron mass have been taken into account in the calculation. On the other hand, from the surface plasmon loss values of Kunz [47] an electron concentration of only 0.9 e per atom Rb or Cs is calculated (including effective masses), whereas the corresponding volume plasma loss energies lead to the expected value of I free electron per formula unit.These results are explained by a decrease of electron concentration at the surface [IO]. As it has been discussed in section I electrons are transferred from the metal to the oxygen atoms, thus reducing the free electron concentration in the suboxides. The experimental values of the electron concentrations Ire in good agreement with the given bond model for the Cs, ,O, cluster. The deviation for (Cs, 10,)Cs,o is within the limit of experimental uncertainty. In general, the values for the free electron concentration derived from the conduction band width and from the plasma frequencies of the binary compounds support the bond model for the alkali metal suboxides. Only the electron concentration in the (Cs, ,03)Rb7 sample is remarkably smaller than expected. This deviation might be a consequence or the large range of homogeneity of the compound (Cs, ,03)Rb, [9]. In conjunction with the rather uncontrolled preparation in the spectrometer some phase separation might have occurred.
3.8.
i~VorX-jirr7ctior7s
The threshold [or photoemission is limited by the work function. Since the Fermi levels of the (electrically connected) sample and spectrometer are equal, the observed value of (1)only reveals the work function of the sample if (1)(sample) < (I) (spectrometer) which is the case with alkali metal suboxidcs. So the work functions are obtained from the photoemission curves by subtracting the width of the spectrum (threshold to Fermi level) from the excitation energy. As it is evident in fig. 7, increasing oxidation of Cs leads to a decrease in work function of the samples. This tendency has already been pointed out qualitatively
by Gregory
et al. [24]. For Cs and the
stoichiometric compounds Cs,O and Cs, ,O, the values of U)are I .95, 1.75 and 1.35 eV. respectively. according to fig. 7. The change of the work function has been explained by Burt and Heine [48] as due to a quantum size effect. They discuss the Cs, ,O, cluster in terms of a simple modeI: The inner part of the cluster is highly repulsive for free electrons. due to the negative charges of the O’-ions. The remaining free electrons are conlined to (in first approximation) a spherical shell at the periphery of the clusters. From this model Burt and Heine calculate a decrease in work functions of 0. I and 0.9 eV for Cs,O and Cs, 1O3, respectively, compared to pure Cs.
In spite of this convincing agreement between theoretical and experimental values severe discrepancies exist. The model demands a raise of the Fermi level with respect to the core levels when increasing the oxygen content in suboxides. In contrast to this expected behaviour the binding energies of core electrons in different Cs suboxides are constunt.
Rkferenccs R.W. Wood and C. Lukcns. Phys. Rev. 54 (1938)332. H. F6ppl. Z. Anorg. Allgem. Chem. 291 (19571 12.
N.V. Smith and W.E. Spiccr, Phys. Rev. 188 (1969) 593. A. Simon, 2. Anorg. Allgem. Chem. 395 (1973) 301. G. Ebbinghaus. W. Braun. A. Simon and K. Berrcshcim. Phys. Rev. Letters 37 (1976) 1770. A. Simon, Struct. Bonding 36 (1979) 81.
A. Simon, Z. Anotg. Allpem. Chem. 430 (1977) 5. A. Simon and E. Westerbeck. Z. Anorg. Allgcm. Chem. 478 (1977) 187.
4. Concluding remarks
A. Simon, W. Briimer and H.-J. Deiseroth. Inorg. Chem. I7 (197s) 875. G. Ebbinghaus, W. Braun and A. Simon, Z. Narurforsch. 31b(1976) 1119. G. Ehbinghaus, Thesis, Stuttgart. Gerniany (1977). CR. Brundle. M.B. Roberts. D. Latham and K. Yates, J. Electron Speclry. Related Phenom. 3
UPS proved to be a most powerful niethod for an analytical
characterization
and
ior the investigation
of bonding properties of the alkali metal suboxides. Further investigations will be focussed on binary Rb suboxides, ternary compounds of the kind (Cs,,O,) (Rb, Cs),, amorphous suboxides and the
(1974) 141. N.V. Smith and G.B. Fisher. Phys. Rev. B3 (1971)
reaction of suboxides with various substrate materials. The electronic properties of the stable Rb suboxides containing Rb,O, clusters are expected to be very similar to those of the Cs compounds. Quite different clusters occurring in metastable Rb suboxides could provide more detailed information about the ion-ion interactions. The investigation of ternary compounds will hopefully answer the question, why electrons are withdrawn from the conduction band of e.g. (Cs, 103)Rb7. For amorphous alkali metal suboxides the determination of the lree electron density is of crucial importance, because these glassy metals hurt the electronic rule 2 K, = K,. Last, but not least, oxidized cesium films are used for the activation of photocathodes. Cs suboxides on Ag substrates have been shown to exist in the films, whereas with e.g. GaAs as a substrate material more complicated reactions occur. Preliminary experiments have proved that UPS is the adequate method for investigating reactions in the surfaze layers.
3662. P.R. Hilton. S. Nordholm and N.S. Husk. Chem. Phys. 15 (1976) 345. PC. Kemeny. R.T. Poole. J.G. Jenkin. J. Liesegang and R.C.G. Leckey, Phys. Rev. AI0 (1974) 190. F. Hermann and S. Skillmann. Atomic wucturc
calculations (Prentice Hall, Englewood Clilfs. 1963). A. Barrie und F.J. Street, J. Electron Spectty. Related Phcnom. 7 (19753 1. S.A. FlodstrBm. R.2. Bachrach. R.S. Baucr and S.B.M. Hagstrijm. Phg’s. Rev. Leiters 37 (1976) 1282.
D.E. Eusuuan and J.L. Frecouf, Whys. Rev. Letters 34 (1975) 395. J.M. tionig, A.P.B. Sinha, W.E. Wahnsiedler and H. Kuwamoto, Phys. Stat. Sol. (b) 73 (1976) 651. P.IH. Citrin, P. Eisenberger and D.R. Hartmonn, Phys. Rev. Letters 33 (19741 965. CR. Helms and W.E. Spicer, Phys. Rev. Letters ZS (1972) 565. C.R. Helms and W.E. Spicet, Phys. Rev. Letters 32 (1974) 228. P.E. Gregory. P. Ch;::, H. Swami and W.E. Spicer. J. Appl. Phys. 46 (1975) 3525. L.G. Petersson and S.E. Karlsson, in: Proceeding of the 5th International Conference of Vacuum Ultraviolet Radiation Physics. eds. M.C. Castex, M. Pouey and N. Pouey (C.N.R.S., Meudon, France, 1977) Vol. 2. p. 253.
the chemical
Acknowledgement
[26] J. Besson and P. Touzain, C.R. Acnd. Sci. Paris.
Many helpful discussions with W. Braun, M. Cardona and T. Grandke are gratefully acknowledged. We ate further indebted to the Deutsche Forschungsgemeinschaft for the valuable
[27]
260 (1965) 916.
support
of these investigations.
E. Westetbeck. Dipolomarbeit. (1971). J.E. Rowe and G. Matgatitondo,
Miinstet.
Germany
Phys. Letters 57A (1976) 314. [29] V.I. Nefedov, N.P. Setgushin and J.V. Salyn, J. Electron Spectty.. Related Phenom. 8 (1976) 81. [?S]
[30] R.G. Oswald and T.A. Callcott. Phys. Rev. 84 (1971) 4122. [31] H. Petersen, Phys. Stat. Sol.(b) 72 (1975) 591. [32] J.A. Bearden and A.F. Burr, Rev. Mod. Phys. 39 (19671 125. [33] N.V. Smi tlI, in: CRC critical reviews in solid state sciences. Photoemission spectroscopy of metals. eds. D.E. Schuele and R.W. Hoffman (The Chemi Cal Rubber Co.. Cleveland. USA, 1971) p. 45. D.E. Eastman, Metals (1972) 41 I. M. Cardona, Wiss. Z. Karl-Marx-Univ. Leipzig, Math. Naturwiss. R. 25 (1976) 204. II361G. Schijn. Acta Chem. Stand., 27 (1975) 2623: G. Schiin. Surk~cc Sci. 35 (1973) 96; S.W. Gaarensrroom and N. Winograd. J. Chem. Phys. 67 (197713500. c371E.H.S. Burshop. The Auger effect and other radiationless transitions (Cambridge Univ. Press. Cambridge. 192).
::“j;
[38] G. Alli?. E. Blanc and D. Dufuyard. Surf~e Sci. 47 (19753635. [39] J.W. Davenport, in: C.R. Helms and W.E. Snicer. Phys. Letters 57A (1976) 369. r401B.R. Cola and D.A. Caplin. The electronic structure of solids (Arnold, London. 1976) pp. 44. r411W. Bauhofcr and A. Simon, Z. Anorg. Allgem. Chem.. to be published. II421S.P. Kowlczyk. L. Ley. F.R. McFeeley. R.A. Polluk and D.A. Shirley. Phys. Rev. US (1973) 3583. [431 E.A. Stern and R.A. Ferrell. Phys. Rev. 1’70(1960) 130. rw D. Pines. Elementary excitation in solids (Benjamin. New York, 1963). 1451U.S. Whung. E.T. Arakawa and T.A. Callcott. J. Opt. Sot. Am. 61 (1971) 740. 1461U.S. Whim;. E.T. Aroknwii and T.A. Callcotr. Phys. Rev. B5 (1972) 2118.
c471 C. Kunz, 2. Physik 196 (1966) 31 I.
II481M.G. Burt and V. Heine. J. Phys. Cl I (1978) 961.