nonlinear dynamical systems, that of chaotic systems and fractal systems. We will
show ... The generation of limit cycles and chaotic signals from such network ...
17. NONLINEAR CIRCUITS, LIMIT CYCLES, CHAOS, AND FRACTALS
17.2 Circuits made of Nonlinear Elements 17.2.1 Nonlinear Circuits with only passive Elements driven by sinusoidal sources 17.2.1.1 Example 1 We will first consider nonlinear circuits formed from passive elements only and driven by a sinusoidal source. In particular, we will look at the possible responses from a second-order dynamics given by:
17.1 Introduction In this chapter, we consider certain classes of nonlinear networks and their response to initial conditions and or external forcing functions. Through a number of examples, we will examine the possible behaviors of such nonlinear networks. These discussions will lead into two important areas of research in nonlinear dynamical systems, that of chaotic systems and fractal systems. We will show how such systems can be interpreted from a nonlinear networks perspective. Also, such an interpretation will help us in building complex chaotic systems and control otherwise chaotic systems. The organization of the chapter is as follows. In section 17.2, we first consider circuits made of nonlinear passive elements only and driven by external sinusoidal sources and discuss the various possible responses. We next consider nonlinear circuits with no independent sources but consisting of nonpassive elements. We discuss two special cases, nonpassive elements with continuously differential characteristics and nonpassive elements represented by piece-wise linear models. The generation of limit cycles and chaotic signals from such network architectures are discussed. In section 17.3, we consider first-order discrete domain nonlinear dynamics with just one parameter and discuss how such systems can lead to chaos. We also consider continuous domain nonlinear networks that lead to such discrete domain dynamics and provide a different perspective on the behavior of such systems. In section 17.4, we introduce fractal systems and discuss their connection to nonlinear electrical networks and continuous domain dynamics. The discussions about chaotic systems, and fractal systems given here are in no way complete nor follow the conventional wisdom about such systems. The purpose here is simply to introduce the readers the ideas in a manner related to the nonlinear networks' concepts, the main thrust of this book.
mx˙˙ + εx˙ +αx + βx 3 = f(t)
(17.1)
The readers can notice that this dynamics is a simplified version of the dynamics used while discussing Lyapunov's direct method and correspond to a single degree of freedom system consisting of a mass m, a linear damper of value ε , and a nonlinear stiffness represented as a sum of a linear term α x(t) and a third-order nonlinear term with a gain constant of β {β x3 (t)} (Fig. 17.1a). For a physical system, all the four parameters m, ε, α, and β are positive and one can consider the response of this network for a given initial condition and or a specified forcing function, f(t). The electrical network equivalent of this dynamics is shown in Fig. 17.1b, and consists of a linear inductor, a linear passive resistor, and a nonlinear capacitor. The use of a third-order nonlinearity to describe the nonlinear stiffness goes well with our definition of nonlinear capacitors, and points to a nonlinear capacitor whose charge Vs voltage characteristics lies in the first- and third-quadrant, and passes through the origin (q = v c = 0) . That is, the capacitor has q = 0 as the only relaxation point, and the nonlinear dynamics will therefore have the origin (x = x˙ = 0 ) as the only equilibrium point. Thus, the free response {f(t) = 0} will exhibit oscillatory or decaying response (with highly damped or oscillatory behavior) depending upon the parameters' values (see Fig. Fig. 17.2 for examples of various possibilities). The corresponding phase plane orbits of the dynamics are shown in Fig. 17.3. From the simulation results, and the fact that the dynamics correspond to a passive nonlinear network, we can conclude that the dynamics is absolutely stable. In Fig. 17.4, we show the response in a phase plane representation for some initial conditions when the damping term is set to zero. With this constraint, the dynamics corresponds to a lossless net with a linear inductor and a nonlinear capacitor. The initial energy in the system is given by: E(0) =
1 α β m{x˙ (0)}2 + {x(0)}2 + {x(0)}4 2 2 4
(17.2a)
5
and the energy left in the system at any time t is given by: E(t) =
1 α β m{˙x(t)}2 + {x(t)}2 + {x(t)}4 2 2 4
(17.2b)
Since the system is lossless, we have E(t) = E(0) = constant. Thus, the response to various initial conditions will be periodic and appears as closed contours in the phase plane portrait. However, the response is not purely sinusoidal (pure sinusoidal response will be identified by a concentric circle in the phase plane plot). From Fourier series representation of periodic waveforms, we know that a periodic output can be represented as the sum of weighted and phase shifted sinusoids whose frequencies are integer multiples of the fundamental frequency. The number and strength of the higher harmonics will depend on the parameter values. Thus, an approximate solution involving, for example, the fundamental frequency, and the third harmonic (due to the cubic nonlinearity), can be assumed, and conditions on the parameters can be derived so that the assumption is true. Such an approach is known as the Harmonic Balance Method and has been widely used in nonlinear control.
x1(t)
0 t -5 0
5 (a1)
10
x 2 (t)
10 0 -10
t 0
5
5 (a2)
10
x1(t)
0
+ v L (t)
Nonlinear damper
+
Mass
x(t)
(a)
εΩ
mH
Nonlinear spring
t
-
i L (t) = q˙ c (t) + = x˙ (t) charge, q c = x(t) i c (t) = q˙ c (t) v s (t) = f(t) v c(t) = αx +βx 3 -
-
(b)
-5 0
5
(b1)
10
x 2 (t)
10 0 -10
t 0
5 (b2)
10
Figure 17-1. a) A mechanical system leading to a second-order nonlinear dynamics; b) Nonlinear passive electrical network equivalent of the system in figure a. Figure 17-2. Transient response of the nonlinear dynamics in (17.1). The two state variables, x1 (t) = x(t) & x 2 (t) = x˙ (t) for a) m = 1, ε = 1, α = 1, & β = 1; b) m=1, ε = 0.5, α = 1, & β = 1 (damping reduced); and c) for m=1, ε = 0.1, α = 1, & β = 1 (damping reduced further). The response takes more time to die out.
x˙ (t)
5
x˙ (t)
10
x1(t)
0
10
0
0
t -5
-10
0
4
8
(c1) 12
16
x(t) -10
20
40
-5
x2 (t)
-2 (a)
0
2
x(t) -5
5
-2
0
2 (b)
5
40 x˙ (t)
0 20
t -40 0
4
8
(c2) 12
16
0
20 -20 x(t) -40
Fig. 17-2 (Contd.)
-5
-2
0 (c)
2
5
Figure 17-3. Phase plane plots of the dynamics in (17.1) with the parameter values as given in figure 17.2. Only one trajectory is shown for the third set of values as the response takes long time to die out.
We can excite this network (with the damping element present) with a sinusoidal source resulting in two additional parameters (or degrees of freedom), 'A' the amplitude and ' ω ', the frequency in radians per second, and study the network response. The resulting response x(t) will be the solution of mx˙˙ + εx˙ +αx + βx 3 = Acos[ωt]
(17.3a)
and will depend upon the parameters' values. If β the parameter corresponding to the nonlinear term is very close to zero, the dynamics will correspond to a linear dynamics and hence the output will be a sinusoid of the same frequency. Otherwise, the response will not be sinusoidal.
As we did in the case of approximating the free response of the un-damped system using the harmonic balance method, we can assume the approximate solution or the output x(t) to be periodic either a pure sinusoid or the sum of two weighted sinusoids, one of the fundamental frequency, and the other third harmonic (due to the presence of the cubic nonlinearity) or the sum of the fundamental, the third harmonic, and a sub-harmonic of one-third of the fundamental frequency, and derive conditions on the parameters such that the assumption turns out to be valid. For example, to find the condition when the output x(t) will be a sinusoid of the same frequency as the input but perhaps with different phase, and its amplitude {that is, x(t) = a cos(ωt) where ω is the
input frequency, and 'a' is the output amplitude to be determined 1}, we can let α and m =1 (basically to reduce the number of parameters to be dealt with by two), and modify the forcing function to include a phase shift. The dynamics will then be given by: ˙x˙ +ε x˙ + x + β x3 = Acos[ωt + φ]
(17.3b)
10
0
-5
x1 (t) 0
5
Figure 17-4. Phase portrait of the nonlinear dynamics of equation (17.1) with the damping term ε equal to zero and the rest of the parameters equal to one. Oscillatory response that depends on the initial conditions can be observed.
1
We will incorporate the unknown phase shift with the input signal.
(17.4a)
1
2
(17.4b)
(17.3c)
We can now substitute x(t) = a cos(ωt) , x˙ (t) = −aω sin(ωt) and x˙˙ (t) = −aω 2 cos(ωt) (the assumed solution and its derivatives) in equation (17.3b) and obtain an expression involving A, a, β, ε and ω by setting the coefficient corresponding to the third harmonic on the right-hand side of (17.3b) to zero as:
x 2 (t)
2
which contains the variable ω on both sides of the expression. Moving the terms of ω to one side and simplifying the expression, we get: 2
0 1 x(t) 0 ˙x(t) x˙ ≡ = + 2 ˙ x1 (t) −1 −β 1 x (t) −ε x1 (t) Acos[ωt + φ]
1
3 ε 2 A 2 3 ε 2 ω = 1+ βa 2 − ± − ε 2 1+ βa 2 − 4 2 a 4 4
Or, in terms of a state-space representation:
-10
A 2 3 2 ω = 1+ βa 2 ± − (εω ) 4 a 2
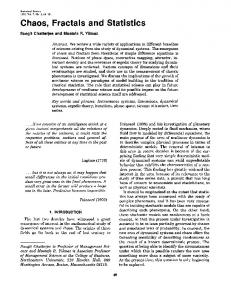
The details on this derivation can be found in the references given at the end of the chapter. We can see that the amplitude of the output, 'a', depends on the input frequency ω as well. Its value can be calculated as a function of the frequency ω by fixing the other variables A, β and ε , and plotted. Because of the quadratic equation, we get one or more (with a maximum of three) values for the amplitude a for a given value of ω as shown in Fig. 17.5. Though all the three amplitudes are possible according to equation (17.4), it turns out that solutions on the portion of the amplitude response curve between the points A and B (corresponding to frequencies ω A and ωB ) on the lower branch are unstable. Thus, for any frequency that lie between ω A and ωB , we find that the response will be sinusoidal with the steady state amplitude given either by the upper branch, or the portion with negative slope on the lower branch. Thus, these amplitudes can be considered as the stable attractors and the amplitudes on the portion with positive slope on the lower branch as the unstable attractors for the periodic response. Which of the two stable attractors will be reached or observed will depend on the initial conditions. In Fig. 17.6, we show the forced response for two sets of initial conditions and the same input frequency of ω = 2 . It can be noted that the resulting steady-state amplitude in one case is around 0.3 (a = 0.3) and around 2 for the other case. Now, we may question if the forced response of this system will always be periodic? Earlier, when approximate and closed-form solutions were the only way to go, the thinking was that the steady-state forced response of such systems when the input was periodic will also be periodic. When computers and computer simulations became common, it was observed that the response can be aperiodic, and for certain parameter values, can exhibit characteristics that were highly sensitive to initial conditions. In Fig. 17.7, we show two responses of the dynamics given by (17.1) corresponding to two initial conditions that are close to each other. It can be observed that the responses are aperiodic and diverge from one another and become uncorrelated though both started from nearby points. The aperiodic nature of the signal can be observed from the broadband nature of the spectrum of the signal, also shown in the figure. Systems leading to such signals are known as chaotic systems and the resulting dynamics chaotic dynamics.
a
A
3
2
Upper branch Lower branch
1
B
ω
0 0
1
2
3
Figure 17-5. The amplitude of the sinusoidal response of the nonlinear dynamics of equation (17.1) with m = 1, ε = 0.1, α = 1, & β = 1 , as a function of the frequency of the input sinusoid. The amplitude is calculated using the Harmonic balance method (assuming that the output will have a sinusoidal response with the output frequency same as the input frequency).
What can we say based on this example? It appears that, perhaps from hindsight, we can state with confidence that in most circumstances, the solution to the nonlinear dynamics in equation (17.1) or for that matter any nonlinear dynamics need not be periodic even if the input is a simple sinusoidal function. We can work the other way; that is, assume the output to be a sinusoid and find what kind of periodic input (not necessarily a simple sinusoid) will lead to that output. In the case of equation (17.1), a periodic signal made of the fundamental to the third harmonic mixed in correct proportion will lead to a sinusoidal output. Finding the inverse solution is not easy as we are trying an inversion. The harmonic balance method gives only an approximate solution which is valid only if the assumed assumptions hold good. Thus, it becomes clear that we need to expect an aperiodic solution. However, the linear system theory (or the technology that existed not long ago) that we have had so far doesn't define such a signal. We have either a periodic signal with finite power, or an aperiodic signal with finite energy (one that is zero or of insignificant value beyond certain limits of the independent variable). Here, we have an output signal that is not going to zero as long the input sinusoidal excitation is present. Further, the output is from a passive or a dissipative system with a linear resistor that consumes power proportional to the second power of the current through it , and driven by an ideal source whose power output is controlled not by the source,
but by the network dynamics. Thus, we do not have to worry about the output amplitude becoming infinite. Thus, we end up with some kind of a bounded oscillation which is not necessarily periodic. Added to this situation, is simulation on a machine in which we represent coefficients of the dynamics in finite precision, and the results of all calculations are truncated or rounded to finite precision. Under normal circumstances, the use of the floating-point representation 2 (used in most simulations), should lead to results that can be considered to be equivalent to the one obtained using infinite precision. However, we are dealing with dynamics that cannot be called normal. Also, simulation on a digital computer implies we simulate a discrete dynamic system rather than the original continuous dynamic system. Thus, it is no wonder that at times we end up with signals that are not only aperiodic and bounded, but signals that exhibit other properties such as randomness, sensitive to initial conditions etc. The degree of randomness is evidenced by a broadband spectrum (see Fig. 17.7 c & d for the spectrum of the chaotic signal resulting from the dynamics in equation (17.1)). At the same time, the signals exhibit some underlying structure (that is more evident from a phase portrait as shown in Fig. 17.7b) representing the chosen nonlinear dynamics and the sinusoidal excitation. The continuous aperiodic nature of the signal can be inferred by plotting the values of the state variables [x, x˙ ] (as a phase plane plot) taken once and at the same time at each period of the input waveform . That is, we plot [x(t 0 + nT), x˙ (t 0 + nT)], n = N 0 ,N 0 + 1,LL where T is the period of the input sinusoid, t 0 is any value in the range 0 to T seconds, and N 0 is a fairly large value to allow for the effect of the initial transient response to die out. An example is shown in Fig. 17.8 corresponding to the dynamics given by (17.1). If the signal were to be periodic, we will find the same point repeated in this phase portrait, also known as the Poincare' map. Of course, we don't see this happening in Fig. 17.8, indicating the aperiodic nature of the signal. However, as we can see from the figure, there is a well-defined structure to the signal indicating some probability distribution for the points in the Poincare' map visited by the dynamics. In fact, it can be noted that certain regions of the phase plane are not at all visited by the dynamics indicating a set of points that are preferred by the dynamics (chaotic attractors).
2
exponent
For example, a representation of the form mantissa times 2 mantissa and e bits for the exponent as discussed later.
with m bits for the
0.5 x1 (t)
x1 (t) 2 0
0
t
-2
t
-0.5 40 1
60
(a1)
40
80
5
x 2 (t)
0
60
80
(b1)
x 2 (t)
0 t
t
-1 40
60
(a2)
80
Figure 17-6. The forced response of the nonlinear dynamics of equation (17.1) with m = 1, ε = 0.1, α = 1, β = 1, and ω= 2 for two initial conditions: a) for x(0) = x˙ (0) = 0 . The result is a sinusoidal oscillation with an amplitude of approximately 0.3 as predicted by the Harmonic balance method, figure 17.5; b) The response when x(0) = 3 & x˙ (0) = 0 . The resulting amplitude is around 2 now; c) Phase plane plots corresponding to the two initial conditions. The absence of a clean single closed contour is due to the inclusion of the transient portion of the response in the plotting.
-5 40
60
80
(b2) x 2 (t)
x 2 (t)
4
1 2 0 0 -2 -1 -0.8
x1 (t) -0.4
0
-4
0.4
x1 (t) -2
(c)
Figure 17-6 (Contd.)
0
2
2
x(t)
X(j ωN )
1
30
0
20
-1 t -2 31200
31260
(a1)
31300
10
2 x˙ (t) 1
0
0
-10
-1 t -2
0 31200
31260
(a2)
0.1
0.2
0.01
0.02
31300
(c1)
0.3
ω N = ω ω Sampling
0.5
X(jω N )
2 x˙ (t)
30 1
20 0
-1
10 x(t)
-2 -2
-1
(b)
0
1
2
0 0
Figure
17-7.
Response of the nonlinear dynamics (17.1) with α = 0, m = β = A = 1 , ε = 2π 140 for two initial conditions close to each other & driven by a sinusoidal source { A = 1, ω 0 = 2π 14 }. a) The two state variables as a function of time; b) Phase plane plot corresponding to one initial condition; c1) Magnitude spectrum of the state variable x(t); c2) Expanded view of the spectrum. A sampling frequency of 4 Hz is used .
(c2)
0.03
Figure 17-7 (Contd.)
ω N = ω ω Sampling 0.05
0.5
x˙ (t)
0
x(t) -1
-0.5
0
0.5
1
(a1) x˙ (t) 1
0
Another interesting feature often cited for chaotic signals is the similarity of the structure in the Poincare' map when a small segment of that map is enlarged. For example, we can select a small region of the state values in Fig. 17.8a of the Poincare' map of the dynamics of equation (17.1) and expand to plot that region as shown in Fig. 17.8b. The conventional wisdom is that the expanded plot should look similar to the original plot. This is not so obvious from our simulation results and is perhaps because we didn’t carry the simulation for a long, long time as others have done. Later we will also raise the question (not considered by many and may be disputed) if this is more due to the underlying structure in floating-point representation used and has less to do with chaotic signals per se. In summary, we have seen an example of a nonlinear dynamics corresponding to a passive, nonlinear network and its response to a sinusoidal input. We find that the response need not always be periodic as we would have generally expected, and for certain combinations of the parameters in the dynamics, can look more like a random signal leading to the terminology 'chaotic signal'. However, the fact that the response is from a well defined nonlinear dynamics or system (with few coefficients or terms) has lead to the enormous interest in chaotic systems.
-1 x(t) 1 -0.4
1.5
x˙ (t)
-0.8
-0.5
17.2.1.2 Example 2: Duffing's Equation 2
(a2) x˙ (t)
Duffing's equation is another well known equation used to demonstrate limit cycle and chaos. The dynamics is given by: 0 1 x(t) 0 x˙ (t) y˙ (t) = −x 2 (t) + 1 −ε y(t) + rcos[ω t] 0
-1
(17.5a) 0 0 1 x(t)(x (t) − 1) = + y(t) −1 −ε r cos[ω 0 t] 2
x(t)
-0.6 -0.7
(b1)
-0.6
-0.5
x(t)
-1.2 1.3
(b2)
1.4
1.5
Figure 17-8. Phase plane plot of the forced response (to a sinusoidal input) of the dynamics of equation 17.1. (with the linear term in x(t) set to zero) with only one point per input period plotted {Poincare’ map}. a1) Plot corresponding to one fixed time within the period; a2) Plot corresponding to another fixed time within the period; b1) & b2) Expanded view of some segments from figures a1) and a2) respectively.
where ε is some positive constant. Thus, Duffing's equation can be thought of as representing a nonlinear, autonomous system driven by an external source r cos[ω 0 t] as we interpret in this book, or as an example of an non-autonomous nonlinear system as done before by other authors. The dynamics (with out the source) has three equilibria, [0 0], [1 0] and [ −1 0] . By equating x(t) to the charge in a capacitor and x˙ (t) to the current in a series circuit, we obtain a passive network representation of the Duffing’s equation involving a linear inductor, a linear passive resistor, and a nonlinear capacitor driven by a voltage source r cos[ω 0 t] as shown in Fig. 17.9a. The voltage across the nonlinear capacitor v c (t) in terms of the charge q c (t) = x(t) is given by:
v c (t) = x(t)(x 2 (t) − 1)
i L (t) = q˙ c (t)
(17.5b)
4
εΩ
2E c[q c] = q c (0.5q c − 1)+ 0.5 2
2
L=1
+
-
+ -+ +v L (t) = q˙˙c i c (t) = q˙ c (t) v s (t) = rcos( ωt) v c (t) = qc (q 2c −1) -
0
-4
1
x(t) 1F
2
-2
(a)
1 i1 (t) + + v c = v (t)
v c[q c] = q c (q c − 1)
4-port lossless nonlinear gyrator 0 0.5x 2 YG = −1 −1
1 1 1 −1 0 0 0 0
−0.5x 2 0 −1 1
4' -v (t) + 4 i 4 (t) 4 0.25(2 − x ) Ω 2
-1
0
i 2 (t)
2
qc
(b) 1
2
+ i s (t) = - r cos(ω 0 t)
+ + v (t) - 2 c=1 -
ε mho
- v (t) + 3 3
i3 (t)
0.25(x − 2) Ω (c) 2
(1− 0.5x ) υ i 2 (t) 2
i 1 (t) +
+
v1 (t)
v c = x(t) 1F (0.5x 2 − 1) υ
Two-port lossless nonlinear gyrator 0 YG = 2 x 2
+
+
v2 (t)
− x 2 0 2
-
+ i s (t) = r cos(ω 0 t)
1F -
-
(0.5x − 1 +ε ) υ 2
(d)
Figure 17-9. Electrical network equivalents of the Duffing’s equation. a) A nonlinear network involving a linear resistor, linear inductor, and a nonlinear capacitor; b) The voltage Vs charge and stored-energy Vs charge characteristics of the capacitor; c) A network involving time-varying resistors and other linear, nonlinear elements; d) Another time-varying net.
which is shown in Fig. 17.9b. We also show the waveform for the stored energy in the nonlinear capacitor as a function of the charge in the same figure. From the figure, we can note that q c (t) = x(t) = ± 1 happen to be the points of zero stored energy or the relaxation points for the capacitor and q c (t) = x(t) = 0 corresponds to a local maxima for the stored energy. Since the other storage element is a linear inductor with its relaxation point at i L (t) = x˙ (t) = 0, we can conclude that the two equilibria, [-1, 0] and [1, 0] of the dynamics will be absolutely stable and the third equilibrium, [0, 0] will be unstable. We can also obtain Alternate electrical network equivalents of the Duffing's equation as shown in Fig. 17.9 c and d. The architecture in figure c involves a 4port lossless, nonlinear gyrator terminated at the last tow ports (ports 3 and 4) with time-varying resistors and linear passive elements at ports 1 and 2. Figure d shows a variation of this architecture using a two-port nonlinear gyrator. From these figures, it can be noted that certain time-varying resistors become passive or lossy when the others are active and vice versa. Thus, we cannot draw any conclusion about the stability of the three equilibrium points based on these equivalent circuits as we did using the nonlinear network equivalent3. In Figs. 17.10, we show the response of the Duffing’s equation with a) some damping and b) no damping when r = 0 (no forcing function) for two initial conditions. In figures a1 and a2, we show the two state variables, x(t) and y(t), as a function of time and the phase plane plot in figure b. We can note that the response indeed reaches one of the stable equilibrium points when some damping is present. When they is no damping in the circuit, the response oscillates as one would expect (figures c and d). Looking again at the phase plane plot (figure b), we can observe another interesting phenomena: The attractive regions for the two equilibrium points are not well defined separate regions as we have seen before for other nonlinear systems. For example, the initial values [4.25, 0] and [3.65, 0] lead to [-1, 0] where as the initial value [3.95, 0] which lie in between those two values leads to [1, 0]. This behavior can be explained qualitatively by considering the energy left in the reactive elements in the network corresponding to the Duffing’s equation and comparing with the (analytically) known behavior of LTI secondorder under-damped systems. For the later, the stored energy function takes the 3
From this example, we can observe that it is much easier to associate a given nonlinear dynamics with a network architecture that involves linear reactive elements only and the rest of the elements time-varying and or nonlinear. In fact, all earlier approaches based on analytical techniques lead to Lyapunov functions that are based on such architectures. However, a network architecture involving nonlinear (and perhaps time-varying) reactive elements makes it easier to analyze a given dynamics.
shape of a bowel which is monotonically increasing as we move away from the origin. Or in terms of equi-valued contours plotted in increasing order of magnitude, the energy function leads to concentric circles of increasing radii. Therefore, when the system is under-damped, we end up with a spiraling phase plane response that keeps moving towards reduced energy points, eventually reaching the origin.
5
x(t) y(t)
10 0 t -50 0
10
(a1)
20
30
y(t) 10 -10 0
-5
(b)
x(t) 5
0
-10 5
t x(t)
0
10
(a2)
20
30
Figure 17-10. Response of the Duffing’s equation. a) The two state variables when the 0 damping term ε is set at 0.25; b) The phase plane plot. we can see that the state variable x(t) reaches +1 or -1, the two relaxation points for the nonlinear capacitor. However, we can notice that the regions of attraction are not well defined. t We can -5 start0the dynamics with two initial(c1) conditions 5 that are close to each other and10find the response corresponding to one of them going to one equilibrium point where as the response corresponding to the other initial condition going to the second equilibrium point;y(t) c) The two state variables with the damping term ε set to zero; d) Phase plane 10 plot corresponding to some initial conditions. We can see sustained oscillation from the lossless dynamics; e) The stored energy as a function of the state plotted as equi0 valued contours. We also show a phase plane trajectory starting from one initial condition. We can note that the trajectory is such that the energy is continuously -10 depleted. t 0
(c2) 5
Figure 17-10 (Contd.)
10
The stored energy function E s [ x(t), y(t)] for the Duffing’s equation is more complicated and can be written easily as the sum of energy left in the two reactive elements in the equivalent network of Fig. 17.9a:
y(t) 10
{
}
E s [ x(t), y(t)] = 0.5 x 2 (t) 0.5x 2 (t) − 1 + 0.5 + 0.5 y 2 (t) 0
-10 x(t) -5
(d)
0
5
1 y(t)
0.5
Contours of increasing value 0
-0.5
-1 -1.5
-1
-0.5
0 (e)
Figure 17-10 (Contd.)
0.5
1
x(t)
1.5
(17.6)
In Fig. 17.10e, we show this energy function as equi-valued contours as a function of the state variables, x(t) and y(t). We can note that the energy function is not monotonically increasing as is the case for LTI systems. Here the energy function has two global minimas (at the two stable equilibria points) and exhibits some un-usual or complex behavior at the origin (The origin is a local maxima only if we consider along the x direction). The energy function is monotonically increasing in all directions for only very small regions around the two stable equilibrium points and these two regions become the clear regions of attraction for the two equilibria. However, the presence of the partial local maxima at the origin makes the total energy function more complex as can be seen from the contour plot. The complex energy function in combination with the nonlinear dynamics (that define the stored energy as well as the rate of dissipation of energy, given by ε y 2 (t) ) leads to strange regions of attraction for the equilibrium points 4. In fact, the simulations indicate that the state can change in such a way that the energy is continually depleted (a must) while moving closer to and away from both the stable equilibrium points until it falls into a closed region which is a region of attractor for one and only one equilibrium point. This point is again illustrated in figure 17.10e where we show one phase plane trajectory. The phase plane trajectory keeps cutting the equi-valued energy contours (indicating that the energy left is indeed getting smaller) and moves to one equilibrium point even though it originated from a point closer to the other equilibrium point. Given such a stored energy function, it is difficult even to predict what the response of the circuit will be when the source r cos[ωt] is connected. However, a number of things are obvious from the series R, L, C equivalent circuit. First, the response will be bounded as long as some damping is present in the circuit. Second, the points [-1, 0] and [1, 0] will be preferred by the dynamics (attractors) where as the origin will not be. On the other hand, the sinusoidal source will take the total voltage from positive territory to negative territory and back and a smaller value of ‘r’ will keep it near the origin. Also, note that the charge amplitude, x(t) = 0, ± 1, maps onto zero capacitor voltage. Finally, changing of the damping factor will lead to different kind of behavior as the power dissipation as well the dynamics itself changes. Having said all this, let us look at the simulation results to understand the behavior. The results of simulation for one set of parameters are shown in Fig. 4
Look once again at figure b to identify the regions of attraction.
17.11. In Fig. 17.11a, we show the two state-variables x(t) and y(t) and the capacitor voltage vc (t) = x(x 2 −1) as a function of time and all of them are periodic. In Fig. 17.11b, we show the phase plane plot (x Vs y = x˙ ) . The phase plane plot is in the form of a single closed trajectory, also known as period-1 trajectory. The spectrum of the signal x(t) is shown in Fig. 17.11c. Since the signal is periodic, the spectrum is discrete with powers only at integer multiples (harmonics) of the fundamental frequency f r = ω 0 2π , and since we have a third order nonlinearity and elements with antimetric characteristics { v c [− q] = − v c [q], for example}, we find only odd harmonics in the spectrum. The solution to Duffing's equation for another set of parameters is shown in Fig. 17.12. For this simulation, only one parameter ( ε ) value has been changed to 0.21875 (from 0.15625). An increase in ε corresponds to increasing the power consumption capacity of the resistor and hence the dynamical system. The plots of x(t) & y(t), ( v c (t) not shown) are shown in Fig. 17.12a & b respectively and indicate that the response is still bounded and periodic. The limit cycle in the phase plane (figure c) has three closed contours or a period-3 trajectory , indicating that the signal has sub-harmonic (f < f f ) frequency components. This is confirmed by the presence of power for f < f f in the spectral plot. Again, the spectrum is a line spectrum with only odd harmonics. In Fig. 17.13, we show the response of the nonlinear dynamics for another set of parameters. Again, only the damping term is changed (increased to 0.25). Now the response becomes chaotic as can be seen from the phase plane plot. The signal has a continuous broad-band spectrum. We should note that in all the three simulations, the input amplitude of the total voltage across the three elements is kept small (r = 0.3). As the damping is increased, the response starts hovering near the two stable equilibria [1, 0] and [-1, 0] of the dynamics (where the energy left in the reactive elements is minimal and the voltage across the elements are zero) more and more and jump from one to another once in a while. Thus, the two stable equilibria become the attractive points under sinusoidal excitation as the damping is increased. Increasing the value of r to say one and above will eliminate the chaos. Finally, in Fig. 17.14, we show the response the same set of parameters used for Fig. 17.13 for two initial conditions close to each other. We can observe that the responses deviate from one another as time progresses. In summary, we looked at two examples of dynamics corresponding to passive nonlinear networks and showed that under certain conditions the forced response of such networks under sinusoidal excitations can look chaotic. We will now look at other means through which limit cycles and chaotic signals can be generated.
{
}
2
x(t)
1 0 -1 t 300
-2 220
240
(a1)260
280
y(t) 1 0 -1
t 220
4
240
(a2)260
280
300
Voltage, x(x 2 −1)
2
0
-2
-4 220
(a3)260
t
300
Figure 17-11. Forced response of Duffing’s equation for r = 0.3, ω 0 = 1 and
ε = 0.15625 . a) State variables x(t), y(t) & the nonlinear function x(x 2 − 1) as a function of time; b) Phase plane plot showing period-1 trajectory; c) Spectrum of x(t) showing one dominant frequency, ω 0 ω sampling = 1(2 π× 50) = 0.003183 and some harmonics; d) Expanded view of the spectrum.
x(t)
y(t)
1
1 0
0
-1
t 220
240
220
240
(a1)
260
280
300
260
280
300
-1 x(t) -2 40
-1
(b)0
1
2
X( jω N )
1
y(t)
0.5 0 -0.5 t
20
-1
ωN = ω ω
0 0 40
0.1
0.2
(c)
0.8
(a2)
y(t)
Sampling
0.3 0.4
X( jω N )
30 0
20 10 ωN = ω ω
0 0
0.1
0.2
(d)
-0.4 Sampling
0.3
x(t) -0.8 -1
(b) 0
1
Figure 17-11 (Contd.) Figure 17-12. The forced response of the Duffing’s equation for another set of parameters { ε = 0.218755 & rest same as in the last figure}. A period-3 trajectory can be observed in the phase plane plot. a) The two state variables as a function of time; d) Phase plane plot; c) Spectrum of the state variable x(t); d) Expanded view of the spectrum.
x(t) 1
X( jω N )
30
0
20 -1
t
10 120
0
1
0
0.1
0.2
(c)
0.3
160
200
(a1)
240
280
y(t)
ωN = ω ω Sampling 0
X( jω N )
30
t -1 120
20
160
200
(a2)
240
280
y(t) 0.8
10 0
0.01
0.02
(d) 0.03
ωN = ω ω
Sampling
0.4
Figure 17-12 (Contd.)
0
-0.4 x(t) -0.8 -1
0 (b)
1
Figure 17-13. The forced response of the Duffing’s equation for yet another set of parameters { ε = 0.265625 & rest same}. The presence of chaos can be observed in the phase plane plot. a) The two state variables as a function of time; b) Phase plane plot; c) Spectrum of the state variable x(t); d) Expanded view of the spectrum.
2
x(t)
X( jω N )
30
0
20 t -2
10
0
0
20
40
(a1) 60
80
y(t)
0
0.1
0.2
(c)
0.3
ωN = ω ω Sampling
X( jω N )
1 0
30 -1
20
t 0
40
(a2) 60
80
y(t)
10 0
20
0
0.01
0.02
(d)
0.03
Figure 17-13 (Contd.)
ωN = ω ω
1 Sampling
0
-1 x(t) -2
-1
0
(b)
1
2
Figure 17-14. Forced response of Duffing’s equation using the same parameters as in the last figure for two initial conditions close to each other. The responses deviate from each other as time progresses. a) The two state variables; b) Phase plane plot; c) Spectrum of x(t) corresponding to the two initial conditions; d) Zoomed in view
X( jω N )
30 20 10 0 -10
0
0.1
0.2
(c)
0.3
(d)
0.03
ωN = ω ω
Sampling
ωN = ω ω
Sampling
X( jω N )
30 20 10 0 0
0.01
0.02
elements themselves start delivering power to the rest of the elements in the network. In fact, this power-transfer-mechanism is more complex than what is possible using an ideal, independent source. To see the difference, consider fig. 17.16a, where we show a passive load driven by an ideal, independent source, assumed to be a voltage source v s (t) . By definition, the voltage level at any time is completely determined by the source. However, the current i s (t) drawn from the source will be solely dependent on the load (for a given v s (t) ), and hence the ideal source just delivers what ever current and hence power is requested from it. In Fig. 17.16b, we show a passive load that is connected to a nonpassive resistor which is assumed to be a voltage controlled. It should be noted that at any given time, for a given value of the voltage, v R (t 0 ), across the resistor, the current i R [v R ] from the nonlinear resistor depends on the nonlinear resistor as well as the passive load. Thus, the voltage has to change so that the current satisfies the conditions imposed by the resistor as well as the load. However, a change in the voltage changes the value of the current that is possible from the resistor, and hence the power consumption or power delivery capacity of the resistor. The network dynamics will thus keep on changing until an equilibrium state where all conditions are satisfied is reached. Such an equilibrium state may not exist at all. Thus, networks with nonlinear, nonpassive resistors and other linear, and nonlinear passive elements can give rise to dynamics that is not possible from LTI systems, or passive, nonlinear systems. We will now look at a number of examples to illustrate the behavior of such networks.
Figure 17-14 (Contd.)
v R = sin[i R ]
8 +
i R (t)
pR = i R v R = i R sin[i R ] 4
v R[i R ]
17.2.2 Networks with nonlinear, time-varying nonpassive elements.
0 -4
In this section, we will consider networks with nonpassive elements to our element box and learn of a different approach to generate limit cycle oscillations and or chaotic signals. We have seen earlier, the various categories of nonlinear resistors. One category that is of use here is that of the memoryless, nonlinear, nonpassive resistors. Such elements consume power for certain ranges of the input variable and generate power for other ranges of the input variable (see Fig. 17.15). Networks composed of such elements can give rise to complicated responses even in the absence of an external sources(s) since, at times, the nonpassive
iR 0
(a)
2
4
6
8
10
(b)
Figure 17-15. A nonlinear nonpassive resistor, its voltage-current and power-current characteristics.
+
i S (t)
v S (t)
resistance energy will be released forcing v c (t) to increase in amplitude. Thus, depending on the initial value v c (0) , v c (t) will settle permanently at (2k + 1)π , the values covered by active regions on the left and passive regions on the left (see Fig. 17.17b). These values are the stable equilibrium points, or the attractive points. The other equilibrium points v c = 2kπ which are unstable are the repulsive points as the system cannot stay their permanently. Thus, we find that nonpassive resistors with exotic v-i characteristics can be used to obtain nonlinear dynamics with multiple attractive and repulsive points.. This example illustrates that the transient response will reach a stable, zero or non-zero valued equilibrium point when a nonpassive element is present in the circuit. This statement of course applies to first-order systems only. In the case of higher-order systems, complex periodic oscillations or limit cycles will result as we will learn from the following examples.
+ i R [v R ] Passive Load
-
v R (t)
Passive Load
-
(a)
(b)
17.2.2.2 Example 2 Figure 17-16. a) A passive load connected to an independent ideal voltage source. For a given value of v s , the resulting current (and hence the power delivered by the source) is solely determined by the load and not by the source; b) Same passive load connected to a nonpassive resistor. The current through this resistor, a controlled source, depends both on the passive load as well as the voltage-current characteristic of the resistor.
Consider a network with one linear capacitor, one linear inductor, and a nonlinear, nonpassive resistor as shown in Fig. 17.18. The resistor is a current controlled one with a v-i characteristics defined by the 7-th order Chebyshev polynomial 5:
i R = − sin[v R ]
0.8 + vc = qc
+ i R [v R (t)] i c (t) v R (t)
0.4
Active
c=1
17.2.2.1 Example 1
(17.7)
and has equilibrium points given by [v ce , i e ] = [kπ, 0], k a real integer. From the v-i characteristics of the resistor, we can note that the resistor acts as a passive resistor when (2k − 1)π ≤ v c < 2kπ and as a negative resistor when 2kπ ≤ v c < (2k +1)π . Therefore, when v c (0) is in range corresponding to passive behavior, energy will be consumed by the resistor forcing v c (t) to decrease in amplitude and when v c (0) is in the range corresponding to negative
Attractive point
-0.4
Active Repulsive v R point
-0.8
Consider a simple network with one linear, unit-valued capacitor with initial stored energy v 2c (0) 2 , and a nonlinear resistor with characteristics as shown in Fig. 17.17. The dynamics corresponding to this network is given by: v˙ c = sin[v c ]
-
-
Passive
0
0 (a)
4
8 (b)
Figure 17-17. a) A simple nonlinear circuit with a nonpassive resistor; b) The voltage-current characteristic of the resistor and the resulting equilibrium points for the nonlinear dynamics.
5
We use the Chebyshev polynomial here to provide a waveform that goes from positive value to negative and vice versa for a number of times in a limited range for the independent variable.
3 R
= 64i R (i 2R − i21 )(i 2R − i 22 )(i 2R − i23 ); i1 =; i2 =; i 3 =.
+
(17.8)
v L = φ˙ (t)
i L (t) =
-
v R [i R ] = 64i −112i + 56i − 7i R 5 R
+
L=1 7 R
q˙ c (t)
v s (t)
+ v R[i R (t)] vc = qc -
-
and as shown in Fig. 17.18b. From the figure, it can be noted that the resistor becomes passive for values of the current in the range i1 ≤ i ≤ i2 , i ≥ i3 and a negative resistor for i ≤ i1, i2 ≤ i ≤ i 3 .That is, for current values in the vicinity of zero, the resistor will be generating power and for large values of current ( i > i3 ), the resistor will start consuming power. Hence, the current in the circuit will never become zero or infinite. If this resistor is connected to only one reactive element (which has to be an inductor since the resistor is a current controlled element), we will find i = i1 and i3 to be the stable equilibrium points. The dynamics of the second-order network in the figure is given by: v˙ c (t) 0 1 v c (t) 0 ˙i (t) = −1 0 i (t) + v [i ] L L R L
v R[i R ]
2 0 -2 iR
-4 -1
-0.6
(b) 0
0.6
(17.9)
+
i C1 (t)
(17.10)
Thus, the oscillation amplitude is directly proportional to the initial values. Though we have used the values L =C = 1, it should be remembered that the values L and C affect the frequency of oscillation ( ω o = 1 Lc ).
c=1
1
i G2 (t)
v c1 (t) v G1 (t)
vc (t) cos[t] sin[t] v c (0) i (t) = −sin[t] cos[t] i (0) L L
c=1
(a) 4
i G1 (t)
where we have written the right hand side of the expression as a sum of linear and nonlinear terms. From the above expression, we can obtain an equivalent network realization as shown in Fig. 17.18c. When the current in the circuit reaches the attractors for the nonpassive resistor, the effect of the nonlinear resistor is removed from the network, and what is left is a linear, lossless, second-order circuit with a oscillatory response with a frequency of oscillation ω o = 1. In fact, the closed form solution when the resistor is removed (for figure c and shorted for figure a) is given by:
i c (t) = q˙ c (t)
+
-
A lossless twoport gyrator 0 YG = 1
−1 0
+
i C2 (t)
v G1 (t) -
+ i = C [v ] R 7 c2 v c2 (t)
c=1 -
(c) v R[i R ]
1
0.6 0 -0.6 -1 -1
-0.6
(d) 0
0.6
iR
1
Figure 17-18. a) A series RLC network with a nonpassive nonlinear resistor; b) The voltage-current characteristic of the nonlinear resistor, a seventh-order Tchebyshev polynomial; c) Equivalent circuit with a gyrator and capacitors instead of an inductor; The voltage-current characteristic as a 129-th order Tchebyshev polynomial.
The characteristics of the nonlinear, nonpassive resistor makes the situation little more complex and interesting. It is neither going to let i L (and hence v c ) go to zero nor to infinity. Further, it keeps adding or draining power from the network that depends on the current i L . On the other hand, the possibility of the network settling at iL = i1 and i 3 (when the resistor neither generates nor consumes any power) is prevented by the lossless sub-network. The result is a sustained, complex oscillation as compared to the simple sinusoidal oscillation of the linear, second-order, lossless sub-network. In figure 17.19, we show the results of simulation using the 7-th order Chebyshev polynomial. We can note from the phase plane plot and the spectrum, that the resulting response is not a simple periodic function. Also, the responses for different initial conditions become identical as time increases. That is, the transient response of the network is independent of the initial conditions, completely opposite to what we have seen for the case of LTI systems. This should not be a big surprise or a shock if we realize that a nonpassive resistor can also be represented by a completely active, controlled (voltage or current) source in series or parallel with a completely passive resistor (In Fig. 17.20. we demonstrate this using a different, simpler, nonlinear, nonpassive resistor).Thus, it can be argued that we have calculated is equivalent to the response of a passive, nonlinear network with external excitation and hence the initial conditions need not necessarily have any effect in the long run. Finally, another interesting question that arise is what if we use higher-order Chebyshev polynomials (or similar representations) to represent the v-i characteristic of the nonlinear resistor. We can see that the number of zero crossings is equal to the order of the Chebyshev polynomial. Further, it is known that all the zeros of all Chebyshev polynomials are real and have magnitudes less than one. Thus, as we increase the order of the polynomial, the zero crossings get cluttered in that very small range, -1 to +1 and the regions corresponding to passive behavior and active behavior get packed closer. (In Fig. 17.18d, we show an example corresponding to 129-th-order Chebyshev polynomial). Under such scenario, the finite-precision effects on simulation also start affecting the behavior, leading to unexpected results. For example, we observed instability (result becoming unbounded) while simulating a first-order dynamics with the 129-th order Chebyshev polynomial. As we discussed earlier, this is not possible from the network perspective. We will consider this further under the section, " Chaos due to numerical imprecision in computer simulation".
1 v c (t) 0
t
-1 0
20
40
(a1)
60
80
1 i L (t)
0 -1
t 0
20
40
(a2)
60
80
i L (t)
1
0
-1 v c (t) -0.8
-0.4
0
(b)
0.4
0.8
Figure 17-19. a) & b) The response of the series RLC nonlinear nonpassive network for one initial condition; c) & d) The spectrum of one state variable.
X(jω N )
30
v cS = −G0 i + -
v R[i R ]
+
20
i R (t)
slope = G1 > 0
v R (t)
10 0
-
+
βp −β p
iR
βp
v R1 -
0.1
0.2
(c)
0.3
ω N = ω ω Sampling
slope = G0 < 0 (a)
X(jω N )
30
(b)
i = i R1 −β p
-10 0
v R1[i R1 ]
(c)
i R1
slope = G1 − G0 > 0
(d)
Figure 17-20. a & b) A nonlinear nonpassive resistor and its voltage-current characteristic; c & d) An equivalent circuit with a controlled source and a passive resistor, and the voltage-current characteristic of the passive resistor.
20 10 0 0
0.01
0.02
(d)
0.03
ω N = ω ω Sampling
Figure 17-19 (Contd.)
17.2.2.3 Example 3 We have seen the Van der Pol equation: m˙x˙(t) + 2c(x 2 (t) − 1)x˙ (t) + kx(t) = 0
(17.11a)
or, in state space representation: x˙ (t) 0 m x˙ (t) = − k 1
1 x(t) −2c{x 2 (t) −1} x1 (t)
(17.11b)
(where the parameters m, c, k are assumed to be positive) and its equivalent network representation in chapter # 5, and reproduced as Fig. 17.21. Thus, the dynamics correspond to a nonpassive network with either a time-varying resistor (Fig. 17.21a) or a nonlinear resistor (Fig. 17.21b). In both cases, the resistances become negative (or active) when the charge or the current magnitude is small implying that the origin, the equilibrium point of the dynamics, will not be stable. However, the resistors become passive for large values of the state variable indicating that the response will not go to infinity either. Therefore, what we will see is limit cycle oscillation. The response of the Van der Pol dynamics is shown in Fig. 17.22 (A and B) for some initial conditions and two values of c. The limit cycle behavior is obvious from the figures. We also show the results when a sinusoidal forcing function is added (Fig. 17.22 C). What we find is a oscillation around the limit cycle or a quasi-periodic solution that is a combination of the natural period of the limit cycle oscillation and the period of the forcing function.
mH
v R = 2Ci R{
i 2R − 1} 3
2
+
-
0
m H R(t) = 2C(x 2 (t) − 1) +
v L (t) -
i(t) = x˙
+
Charge = x(t) i c (t) = x˙ (t) + v c = kx(t)
(a)
1 F k
i(t)=x(t)
vR
v DC = 2m x˙ (t) + x 2 (0) } 2Cx(0){1 − 3 -
v c (t)
+
-
1 F k
(b)
-2
t 10
30
(a1)
40
50
i L (t)
2
Figure 17-21. Network equivalent of the VanderPol dynamics: a) Using a timevarying resistor; b) Using a nonlinear resistor.
20
0 -2
t 10
20
(a2)
30
40
50
i L (t)
2
17.2.2.4 Example 4
0
Let us consider another example used to demonstrate limit cycle behavior (we have seen similar models in chapters 4 and 8). The dynamics is given by: x˙ 1 (t) x 2 (t) − x71 (t){x14 (t) + 2x 22 (t) − 10} x˙ (t) = −x 3 (t) − 3x 5 (t){x 4 (t) + 2x 2 (t) − 10} 2 1 2 1 2 1 x1 (t) x17 (t){x 41 (t) + 2x 22 (t) − 10} 0 = 2 − −x1 (t) 0 x2 (t) 3x 52 (t){x14 (t) + 2x 22 (t) − 10}
v c (t) -2
-1
0
(b)1
2
Vc (jω N )
(17.12a)
30 20
A nonlinear, time-variant network representation of this dynamics is shown in Fig. 17.23a. The network consists of a 2-port nonlinear network with the admittance matrix: 1 0 Y= 2 −x1 (t) 0
-2
(17.12b)
10 0
0.01
0.02
(c)
0.03
ωN = ω ω
Sampling
Figure 17-22. Response of the VanderPol dynamics for some initial conditions, parameter values, and forcing function.a) to c). Response for c=0.5 and no forcing function; d) to f) Response when c=5; g) to i) With sinusoidal forcing function {amplitude=0.25}.
v c (t) 2
v c (t) 2
0
0
-2 10
20
30 (d1)
40
t
-2
t
20
50
40
(g1) 60
80
100
i L (t)
10
i L (t)
2 0
0 -10
t
10
20
10
30
40
(d2)
t
-2 20
50
40 2
i L (t)
(g2) 60
80
100
i L (t)
0
0 -2
-10
v c (t) -2
-1 (e) 0
1
-2
20
10
10
0
0
0
0.01
0.02
(f)
0.03
Figure 17-22 (Contd.)
0 (h)
1
2
Vc (jω N )
30
20
-10
-1
2
Vc (jω N )
30
v c (t)
ωN = ω ω
Sampling
0.01
0.02
(i)
0.03
Figure 17-22 (Contd.)
ωN = ω ω
Sampling
+
+
i C1 (t)
+
v c1 (t) = x1 c =1 -
0 YG = 2 x1 (t)
-
-
+
A two-port nonlinear net
i C2 (t) +
varying resistors behave as negative resistors and as passive resistors for larger values of x1 and x2 . Hence, we can expect stable limit cycle oscillations from the system for transient response (and quasi-periodic and or chaotic response when a forcing function is added). In fact, the dynamics in (17.12a) has probably been obtained through clever mathematical hand-crafting such that the condition x14 (t) + 2x 22 (t) = 10 for which the two nonlinear, time-varying resistors become open circuits also happen to be the solution of the rest of the network with the dynamics:
+
v c2 (t) = x 2 c =1
−1 0
-
-
iR2 =
i R1 = x17 (x 14 + 2x 22 − 10)
3x52 (x 41 + 2x 22 − 10)
(a)
1 x1 (t) x˙ 1 (t) 0 x˙ (t) = −x 2 (t) 0 x (t) 2 1 2
− R1 (t)
3 1 +
-
+
i R1 =
i C1 (t)
+
G 1 0 v c1 (t) = x1 − G 0 1 c =1 −1 1 0 1' - −1 −1 0 G(t) = 0.5(x21
x17 (x 14 + 2x22 − 10)
Therefore, we get a limit cycle oscillation described by x14 (t) + 2x 22 (t) = 10 as response for the dynamics of equation (17.12a). In Fig. 17.24, we results of simulations of this dynamics.
- 3' 2
A lossless fourport gyrator + YG =
+
i C2 (t) +
1 v c2 (t) = x 2 −1 c =1 0 0 2' + 1)
4
4'
(17.13)
+
x 2 (t)
2 x1 (t) 2
iR2 =
0
0
3x (x + 2x − 10) 5 2
4 1
2 2
+ 2 R1 (t) = 0.25(x1 − 1) (b)
-2
t
-2 0
2
4
t 0
6
2
4
6
(b)
(a) x2 2 (t)
Figure 17-23. a) A network realization of the dynamics of example 4 with linear and nonlinear time-varying resistors ; b) An alternate architecture.
1 0 -1 x1 (t)
-2 -2
which is obviously non-lossless except when x1 = 1 (more on this block in the next paragraph) and two nonlinear, time-varying resistors. The nonlinear terms x17 (t)and x 52 (t) in the resistor equations give rise to passive behavior for all x1 , x 2 and hence only the time-varying term {x41 (t) + 2x 22 (t) − 10} needs to be studied. We can observe that this function becomes negative in a region defined by x14 (t) + 2x 22 (t) ≤ 10 that includes the origin and positive when x14 (t) + 2x 22 (t) > 10 . Thus, for smaller values of x1 and x2 , the nonlinear, time-
-1
(c)
0
1
2
Figure 17-24. Response of the nonlinear dynamics of example 4 illustrating limit cycle behavior.
17.2.2.5 Example 5: Predator-Prey Model We will now look at a dynamics that corresponds to a network with nonlinear and time-varying elements. In their present form they do not lead to chaos, but can be changed to one producing chaos by adding forcing functions at strategic locations. The nonlinear dynamics is one used to model prey and predator populations given by: −0.5x(t) x(t) x(t){x(t) − 1}{x(t)− 3} x˙ (t) 0 y˙ (t) = y(t) y(t) − 0 2.1y(t)
+
+
+
i C1 (t)
v c1 (t) = x
-
c =1
-
-
+
A two-port time-varying element 0 Y= −y
i C2 (t)
+
+
v c 2 (t) = y
0.5x 0
-
2.1 mho
c =1
-
-
i R1 = x(x − 1)(x − 3)
(17.14a)
.25(2y − x) υ
or, x˙ (t) 0 y˙ (t) = 0
−0.5x(t) x(t) x(t){x(t) − 1}{x(t)− 3} y(t) − 0 y(t){2.1 − x(t)}
(17.14b)
where x(t) is the population of the prey and y(t) is the population of the predator. The underlying principle behind the model is as follows: If a significant portion of the prey population is eliminated perhaps by the sheer number and aggressiveness of the predator, only very few will be left alive ( x(t) → 0). This situation, i.e., lack of sufficient food for the predator, will in turn lead to (after some time lag) a decrease in the predator population (y(t) → 0). This in turn will lead to an increase in the population of the prey (x(t) → ∞ ). We can expect this cycle to continue in such a way that the state variables do not become exactly zero or infinity. Thus, the idea here is to represent the complex relationship that exists between the prey and the predator population by a simple nonlinear (and perhaps time varying) model since we can’t represent such behavior using LTI models. The architectures corresponding to the two different state variable representations are shown in figures 17.25a and 17.25b respectively. Both the architectures have nonlinear and or time-varying resistors as should be expected. From the dynamics, we can see that there are four equilibrium points given by t [x e ye ] = [ 0 0] t , [ 2.1 1.98 ] t , [1 0 ]t and [ 3 0]t of which the first two are locally stable6. In Fig. 17.26, we show the results of simulation for initial values of the state variables in the range -1.00 to 4.00. Figs. 17.26a and 17.26b show x(t) and y(t) for some initial values. We can see that they move towards the values given by the stable equilibria. In Fig. 17.26c, we show the results as a phase portrait. The trajectories move away from the two equilibrium points t [x e ye ] = [1 0 ]t and [3 0 ]t and move towards the two stable equilibrium 6
x − 2y υ 4
We can not infer the stability of the equilibrium points from the network representation as we started with the dynamics first. We can use the linearization technique to prove the local stability of the two equilibrium points.
x + 2y 4
0 YG = x + 2y − 4
0
x − 2y υ 4
(a)
+
-
+
-
i C1 (t)
+
v c1 (t) = x c =1 -
A two-port time-varying element
+ i C2 (t)
0 0.5x Y= 0 0
v c2 (t) = y -
+ c =1
2.1-x mho
-
i R1 = x(x − 1)(x − 3)
−0.25x υ
+ + 0.25x υ
-
-
0.25x 0 YG = −0.25x 0
0.25x υ
(b)
Figure 17-25. Two electrical networks corresponding to the prey-predator dynamics.
points [x e ye ] = [ 0 0] and [2.1 1.98 ] . As indicated before, we can produce chaotic responses from this dynamics by adding forcing function(s), not just as additive terms but in more complex way. For example, we can introduce two external forcing functions as: t
x(t)
4 2 0
t
t
−0.5x(t) x(t) d1 (t)x(t){x(t) − 1}{x(t)− 3} x˙ (t) 0 y˙ (t) = d (t) y(t) − 0 y(t){2.1 − x(t)} 2
-2
(17.14c)
t
-4 0 4
0.5
1
(a)
1.5
y(t)
2 0 t 0 4
0.5
1
(b)
1.5
y(t)
2
0 x(t) -1
0
1
(c)
2
3
4
Figure 17-26. Response of the prey-predator dynamics: a & b) x(t) and y(t) as a function of time for some initial conditions; c) Phase portrait.
Naturally, we will see exotic responses even if we restrict the forcing functions to sinusoidal signals. Readers with sharp eyes would have noticed from above that we have used initial values which are negative and or the intermediate values in the simulation becoming negative. This doesn't go well with the definition of the two state variables, x(t) and y(t), which are supposed to represent the populations of the prey and predator (negative population?). Further, we can question the existence of stable equilibria (is the nature so simple to lead to the same population year after year regardless of what happens?) and in particular, two stable equilibria (How meaningful is it to have the origin as a stable equilibrium when it implies that for certain range of initial values of the population, the prey and the predator will disappear from this earth!). All these problems occur because we are trying to model a complex phenomena with a) simple models since even such models overwhelm our ability to analyze and or design and b) models derived from a purely mathematical approach. The building block approach offers some hope to overcome the difficulties faced. For example, the population values becoming negative can be avoided by the use two state variables x, y as before, and defining nonlinear mappings of these state variables, where the mappings are constrained to be nonnegative, as representations for the populations. For example, using the logistic signal function (as is known in the neural nets literature and defined below) as the nonlinear mapping, we can write the general form of a new prey-predator model as: X0 1 + e − ax(t) Y0 Y(t) = 1 + e − by(t) x˙ (t) f 1 [X(t),Y(t),d 1 (t)] y˙ (t) = f [X(t),Y(t),d (t)] 2 2 X(t) =
(17.15)
where a, b, X 0 and Y 0 are positive scaling constants (a and b are used to control the slop of the mappings and X 0 and Y 0 are used to ensure that the maximum values of the to represent the time varying effects and f 1 [• ] and f 2 [ •] are two nonlinear functions. Further, network based considerations can be used
a) to prevent x(t) = y(t) = 0 {X(t) = X 0 2 , Y(t) = Y0 2 } becoming a stable equilibrium point, b) to position a stable non-zero valued equilibrium point (when d 1(t) and d 2 (t) are constants) at the value of interest, and c) to model d 1(t) and d 2 (t) so that a desired deviations and or oscillation around the equilibrium point is achieved. Based on the above discussions, we can derive a suitable network architecture and the corresponding dynamics as follows: We assume that x(t) and y(t) correspond to the charge in two nonlinear capacitors with a voltage to charge characteristics given by: v c1 (t) = tanh[c 1 x(t)],
y12 > Max[ X(t) + d(t) , Y(t) + d(t) ] = Max [ X 0 + d(t) , Y 0 + d(t) ]
to ensure that the two-port network is nonpassive. The power generation capability of this two-port linear nonpassive network (when the state variables are close to zero) can easily be made much greater than the power that can be consumed by the passive resistors by adjusting the parameters G 1, G 2 c1 , and c 2 7. The resulting network is as shown in Fig. 17.27 and the dynamics from the network is:
(17.16a)
v c2 (t) = tanh[c 2 y(t)], c1 , c 2 > 0
A two-port timevarying element = y˙ +i C2 (t) + + + y11 −(y12 + d(t)) , Y= v (t) = c2 v c1 (t) = y22 tanh[c y] −(y12 + d(t)) 2 tanh[c1 x] y = X (1+ e −ax ), X constant 11 0 0 − by y 22 = Y 0 (1+ e ), Y 0 constant i R1 (t) = y12 > Max[y11 + d(t) , y22 + d(t) ] i R2 (t) = tanh −1[v c1 ] = c1x = Max[X 0 + d(t) ,Y 0 + d(t) ] tanh −1[v c 2 ] = c 2 y
A nonnegative transformations of the charge variables given by: X(t) =
X0 , 1 + e − ax(t)
Y(t) =
Y0 1+ e −by(t)
(17.16e)
a, b > 0
+
(17.16b)
are used to represent the populations. Two passive nonlinear resistors with a current-voltage characteristics:
+
i C1 (t) = x˙
+
(a)
i R1[v c1 (t)] = G1 tanh [v c1 ], −1
i R2 [v c2 (t)] = G 2 tanh −1[v c2 ], G1 , G 2 > 0
G(t) = (y12 + d(t)) mho > 0
(17.16c) +
are assumed to be connected across the capacitors. These passive resistors dominate (in terms of power consumption) when the magnitudes of the state variables increase to very large values thereby preventing the state variables becoming unbounded. We will connect these two capacitor-resistor combinations to the two-ports of a two-port nonpassive resistive network. The nonpassivity will make the origin an unstable equilibrium if the two-port net’s power generation capacity when the state is close to the origin is much higher than the power absorption capacity of the passive resistors across the capacitors. The admittance matrix of the two-port resistive network can be written as: X(t) −( y12 + d(t) ) Y admmaatrix = Y(t) − ( y12 + d(t) )
+
+ -
(y11 − y12 + d(t)) mho < 0
(y 22 − y12 + d(t)) mho < 0
-
(b)
Figure 17-27. A nonpassive network architecture leading to a new prey-predator dynamics. X 0 = Y 0 = 10, c1 = 2, c 2 = 1, a = b = 1, d(t) = 0, y12 = 12.725 + abs(x) = y, G 1 = 2.556, and G 2 = 5.825 leads to a stable equilibrium point at [X e , Y e ] = [2.1, 1.9] or [x e , ye ] = [−1.325, − 1.4] .
(17.16d)
where we have introduced the two populations as parameters of the two-port network, the forcing function d(t) to represent any time-varying phenomenon and the condition:
7
We discuss further the simultaneous use of passive and active resistors and their effect on the resulting dynamics etc. when we consider the design of recurrent neural networks based on the building block approach in the chapter on neural networks. Also, the readers might notice that the two architectures given are based on R, C elements only and does not involve both kinds of reactive elements. The reason for such a choice is also discussed in that chapter.
X(t) − ( y12 + d(t)) v c1 [x] iR1[v c1 ] x˙ (t) y˙ (t) = − −( y + d(t) ) − (17.17) Y(t) 12 vc2 [y] iR2 [v c2 ] where all the variables are as defined in equation (17.15) and (17.16) The values a, b, c1 , c 2 , G1 and G 2 are chosen properly to force a stable equilibrium point corresponding to the steady state population of X e (t) = 2.1 and Y e (t) = 1.98. The corresponding parameter values and the results of simulations are shown in Fig. 17.28. As can be seen from the phase portrait, the origin is not a stable equilibrium point, and in addition to the desired equilibrium point, we have one another equilibrium point due to the nature of the dynamics (the dynamics is unchanged for x → k 1y and y → k 2 x where k1 and k 2 are some constants). Such equilibriums can be avoided by using more complex expressions as we will see in the chapter on neural nets. We can also make sure that there is one and only stable equilibrium point through the use of a passive, nonlinear architecture that has the origin as the only stable equilibrium point, and choose the coefficient values such that the steady state population values (represented as positive mappings of the state variables) are reached at the origin. One possible network architecture is shown in Fig. 17.29. The dynamics corresponding to this network is given by: y11 − ( y12 + d(t)) tanh[x] x x˙ (t) y˙ (t) = − −( y + d(t) ) − y 22 12 tanh[y] y x
2 x(t)
2 y(t)
0
0
-2
-2
t 0
2
(a)
4
6
t 0
2
4
(b)
6
2 y(t) 0
-2 -2
(c) 0
x(t)
2
Figure 17-28. Results of simulation of the new prey-predator dynamics.
(17.18)
y
where y12 + d(t) > 0, X = 2.1e 128 , Y = 1.9e 128 , y11 = X + y12 + d(t), y 22 = Y + y12 + d(t) will ensure that the network is passive with the stable equilibrium point at [x e , y e ] = [0, 0 ] or [ Xe , Y e ] = [ 2.1, 1.9 ] . The results of simulation of this dynamics using d(t)=0 and y12 = 2 are shown in Fig. 17.30. We now have only one stable prey-predator population. We can make the stable point itself move (perhaps due to some time varying phenomena) by associating those time varying functions directly with the mappings for X and Y. For example, the choice X = 2.1e {x+d(t) } 128 , Y = 1.9e {y− d(t) } 128 will force X e to go up and Y e to go down as d(t) increases in value. We can observe that the building block approach makes the design problem much simpler.
G(t) = (y12 + d(t)) υ > 0 +
+
i C1 (t) = x˙ +
+ +
+
i C2 (t) = y˙ +
-
v c2 (t) = tanh[y] -
v c1 (t) = tanh[x] -
-
-
-
i R1 (t) (y11 − y12 − d(t)) υ > 0 (y 22 − y12 − d(t)) υ > 0 −1 = tanh [v c1 ] =x
+
-
+
-
i R 2 (t) = tanh −1 [v c2 ] =y
Figure 17-29. A passive time-varying network architecture leading to another preypredator dynamics.
17.2.3 Networks with nonlinear, nonpassive elements with piecewise linear characteristics
200 x(t) 100
Let us consider a third-order nonlinear, time-invariant dynamics known as the double scroll equation or Chua-Matsumo-to dynamics:
0 -100 t -200 0
4
(a)
8
12
200 y(t) 100 0 -100 t -200 0
4
(b)
8
12
x˙ (t) α ˙y(t) = z˙ (t) β
0 1 0
1 0 x(t) h[x(t)] 0 1 y(t) − y(t) −1 0 z(t) 0
(17.19a)
where α and β are two positive constants (the values α = 9 and β = 100/ 7 are commonly used) and h[x(t)] is a nonlinear mapping of the first state variable. We can obtain two network representations corresponding to this dynamics as shown in Fig. 17.31. The first architecture involves a linear gyrator, three LTI capacitors, a linear resistor and a nonlinear resistor. The second architecture involves two linear inductors, one capacitor, one resistor (all LTI elements) and a nonlinear resistor. In both cases, the nonlinear resistors are the same and have a current-voltage relationship given by: i R [ vR ] = h[v R (t)]
(17.19b)
8
The mapping h[x] is chosen to be a piece wise-linear function:
Y
m1x(t) + (m 0 − m1 ), h[x(t)] = m 0x(t), m x(t) − (m − m ), 1 0 1
4
0 0
4 (c)
8
X
Figure 17-30. Simulation results of the new prey-predator dynamics of fig. 17.29: a) & b) The state variables as a function of time for some initial values; c) Phase portrait in terms of the transformed state variables, X(t) and Y(t), representing the prey and predator populations respectively. We have only one stable equilibrium, [2.1, 1.9], now.
for x(t) ≥ 1 for x(t) ≤ 1 for x(t) ≤ −1
(17.19c)
where m 0 = −1 7 and m1 = 2 7 . The mapping {along with its first- and secondderivative) is shown in Fig. 17.32} from which we can observe that the nonlinear resistor is a nonpassive one with negative resistance for magnitude of the voltage less than 1.5V and positive resistance for voltage magnitude greater than 1.5V. Thus, the Chua's dynamics corresponds to otherwise simple LTI network with just one nonlinear, time-invariant resistor. From the characteristics of the resistor, we can infer that the origin will be a unstable equilibrium point and the state variable x(t) will keep hunting near ±1.5 V since the resistor keeps changing from passive to active and vice-versa (and x(t) cannot exactly settle at ±1.5 since for those values the rest of the network becomes lossless). Thus, we should expect as a minimum limit cycle oscillations from the dynamics. The presence of the discontinuity in fact leads to a messy chaotic waveform that hunts between +1.5 and -1.5 in terms of x(t) (see figure 17.33).
i p1 (t)
+
i R1
i p2 (t)
1 = h[x] i C1 (t) +
A three-port device with the admittance matrix
2 i (t) + C2
1 F α
0 −1 0 Y = −1 0 −1 0 1 0
v c2 (t) =y -
v c1 (t) =x -
-
1'
3 +
+
i R2
1Ω
1F
0
-2
z
- 1 F β
0
(a)
x(t)
1Ω
x˙ (t) α 1 F α
z˙ (t ) β
+
-
-
+
-
+
x(t)
-
y(t)-x(t) i R1 = h[x] +
2
y˙ (t)
40
80 (a1)
120
t 160
40
80
(a2)
120
t
40
80 (a3)
120
0.4 y(t) 0.2 0
1 H β
y(t)
1F
-
z(t)
-0.2 -0.4 0
(b)
Figure 17-31. a) A network equivalent corresponding to the Chua-Matsumoto dynamics involving a three-port gyrator; b) Another network using RLC elements.
160
2 0 -2 0
− m0
h[x] = iR
dh[x]
d 2 h[x]
dx2
m1 vR
-1
dx
1 1.5
=x
m0 slope = m 0 < 0 slope = m 1 > 0 (a)
(m 1 − m 0 )δ(x − 1)
vR =x 1 1.5
-1 m0
vR -1
1 1.5
=x
−(m 1 − m0 )δ(x + 1) (b)
(c)
Figure 17-32. a) The piece-wise linear function used as the current-voltage characteristic of the nonlinear resistor of Chua-Matsumoto circuit; b) The first differential of the characteristic {has two discontinuities}; c) The second differential.
t 160
Figure 17-33. The response of the Chua-Matsumoto circuit {calculated using sampling frequency of 100 Hz}: a) Plot of the state variables x(t), y(t) and z(t) as a function of time; b) 3-D plot of the state trajectory; c) Spectrum of x(t) ; d) The state variables and e) the spectrum of x(t) corresponding to two initial conditions close to each other.
x(t)
2 3
0
z(t)
2
-2
1
t 0
0 -1
20
40
(d1)
60
0.5 y(t)
-2 -3
0
y(t) 0.2 0 -0.2 -0.4
-2
-1
1
0
x(t) 2
t -0.5
(b)
0
20
40
(d2)
60
z(t) 2
X(jω N )
0
30 -2
t 0
20 ωN = ω ω
10 0
0.01
(c)
0.02
40
20
40
(d3)
60
X(jω N )
Sampling
30 20
Figure 17-33 (Contd.)
10 0
0.01
0.02 (d4)
0.03
Figure 17-33 (Contd.)
ωN = ω ω
Sampling
Let us manipulate the state equations to see if we can get some insight from a design perspective. Differentiating the first equation once and using the first and second state equations, we get: ˙x˙ (t) = α y˙ (t) −α dh[x(t)] dt dh[x] dx(t) dx dt dh[x] ˙ = α x(t) − x˙ (t) − α h[x(t)] +α z(t) −α x(t) dx dh[x] ˙ = −{1+α }x (t) + αx(t) −α h[x(t)]+ α z(t) dx = α{x(t) − y(t) + z(t)} −α
(17.20)
Differentiating the above equation once again and using state equations two and three, we get:
(17.21a) or
dh[x] d2h[x] dh[x] ˙x˙ (t) + {1+ α }x˙˙ (t) + α x˙ (t) + − 1 + β x˙ (t) + α β h[x(t)] = 0 2 dx dx dx (17.21b) Thus, we have a third-order nonlinear differential equation involving only one variable, x(t) (which is possible only in special cases as we noted in earlier chapters). We can see the potential for problem from this differential equation. We have terms such as dh[ x ] dx which has two discontinuities (at x(t) = ±1.0 ) and d 2 h[ x] dx2 which becomes infinite at those values of x(t) and zero elsewhere. We can certainly expect unusual behavior from the circuit implementing the dynamics (to say the least) if not complete blow-out of the circuit 8. Therefore from a design perspective, we should avoid nonlinear functions such as this. Further the use of such functions don't seem to add anything from a practical perspective.
8
17.3 Chaos from one-parameter Nonlinear Discrete Systems & Interpretation from Electrical Nets (Continuous Systems) Perspective. Consider the first-order nonlinear discrete-domain dynamics given by:
2
dh[x] d h[x] dh[x] x˙ (t) +α z˙ (t) }˙x˙ (t) −α{x˙ (t)}2 + α ˙x(t) −α 2 dx dx dx 2 dh[x] x˙ (t) dh[x] 2 d h[x] = − {1+ α x˙ (t) −αβ { }˙x˙ (t) −α{x˙ (t)} + α ˙x(t) −α + h[x(t)]} dx α dx2 dx
˙˙x˙(t) = − {1+ α
Earlier results concerning this dynamics have come from simulation on a computer. That is, we are approximating this nonlinear continuous-domain dynamics with a nonlinear discrete domain-dynamics which leads to obviously different results than what we will see if we implement the dynamics in the continuous domain. Further, the discrete-domain dynamics is implemented on a system in which the coefficients of the dynamics and results (of multiplication, additions etc.) are represented using finite precision arithmetic. Thus, we end up with additional problems. We will come look at some of these issues as we study another way to produce chaos.
In a physical circuit with limitations on peak power, energy etc. the signals will get pulled to saturation, but by that time the resistor will become passive forcing the signals to become small.
x(n + 1) = 4λx(n){1 − x(n)} = f [ x(n)]
(17.22)
where f [ • ] represents the nonlinear mapping, a quadratic map, and λ is the only parameter that can be varied. The above equation falls under the category known as functional iteration since: x(n) = f [ x(n − 1)] = f [ f [ x(n − 2) ]] M
(17.23)
= f [ fLLf [ x(0) ]] = f n [ x(0) ] where the superscript n denotes not the power but repeated application of the function f [ • ] n times. That is, the n-th sample is obtained by applying the transformation f [ • ] n times {n iterations} on x(0). Note that the dynamics uses a normalized sampling interval of one second. We can ask how this dynamics will evolve as a function of the time index n for a given value of λ and x(0). In particular, if the response will have a fixed steady state value(s) or equilibrium points (known also as the fixed points of f [ • ] or period 1 oscillation), if that fixed point is stable or unstable and if unstable, will the response oscillate, or exhibit chaotic response or become unbounded. We can set x(n+1) = x(n) for all n to find if any real value for x(n) exists to qualify as the fixed point of f[.]. From (17.22), we find that there are two equilibrium points {or fixed points} x1e and x2e given by:
x1e = 0, x2 e =
4λ −1 1 =1 − 4λ 4λ
1
Steady state value(s)
(17.24)
We can plot the value of the equilibrium points as a function of λ as shown in Fig. 17.34. Also from the dynamics, we can see that for x(0) > 1, the term x 2 (n) in the dynamics dominates so that the response becomes unbounded. The response also becomes unbounded when −1 ≤ x(0) < 0 . Thus, both the fixed points are unstable for values of x(0) in that range and we need to be concerned only with values of x(0) in the range 0 to 1. We can see through simulation that for 0< x(0) < 1 and 0 < λ < 0.25 , the system response settles at x1e { x1e is a attracting fixed point or attractor of period 1, 0 ≤ x(0) < 1 is the basin of attraction of the attractor and x 2e is a repelling fixed point} and settles at x 2e for 0.25 ≤ λ < 0.75 {x 2e is a attracting fixed point and x1e is a repelling fixed point} Thus, the system has one stable equilibrium and one unstable equilibrium for the variable λ in the given range. The real action from our perspective starts when λ > 0.75 . For λ = 0.75 + δλ where δλ is some small positive value, we can see the response becoming periodic with a period of two {period 2 oscillation}. This is shown in the figure 17.34 {showing the fixed points as a function of λ } as two points. We can note in the figure the range of λ for which the period 2 oscillation continues. The value of λ = 0.75 where the transition from period 1 to period 2 {in general, from period (n-1) to period n} occurs is known as the bifurcation point.. The plot in figure 17.34 which shows the fixed point behavior is known as the bifurcation diagram of the nonlinear mapping f [ • ] . If we increase λ further, the period 2 oscillation gives way to a period 4 oscillation, period 4 oscillation to period 8 oscillation, and so on. See the figure for the exact values of λ at which the transitions take place. The doubling starts happening much faster {in terms of increase in the value of λ needed} that the bifurcation diagram becomes completely littered with very large number {approaching infinity} fixed points with in the range 0 to 1 for a fixed value of λ . Thus the bifurcation diagram becomes completely dark as can be seen in figure 17.34 for λ > 0.9. The waveform x(n) plotted as a function of n starts appearing as a chaotic waveform with all properties such as dependence on the initial condition and so on (Fig. 17.35). Therefore, we have an example of a first-order discrete-domain dynamics that leads to chaos.
0.8 0.6 0.4 0.2 0
0
0.2
0.4
0.6
0.8
λ
1
(a)
Steady state value(s) 0.8
0.4
0.7
0.8
(b)
0.9
λ
Figure 17-34. a) The bifurcation diagram of f[x] = 4λ(1− λ) ; b) Expanded view of the bifurcation diagram for 0.7 ≤ λ ≤ 0.95λ .
1
x1e is unstable is for λ = 0.5 can be explained away by looking at the slope of f[x] or the derivative df [ x ] dx at the two fixed points. At x1e , the absolute value of the derivative is greater than one and at x 2e , the absolute value of the derivative is less than one. To be a stable fixed point, the absolute value of the derivative has to be less than one.
x(n) − xˆ (n)
0.5
0
-0.5 n
-1 100
x, & f[x] = 4 λ(1 −λ ) λ = 0.0.2
x, & f[x] = 4 λ(1 −λ ) λ = 0.0.35
200
Figure 17-35. The difference in the response of the first-order discrete domain nonlinear dynamics of equation 17.22 for λ = 0.98 and two initial values close to each other. We can observe the difference is large and becomes chaotic indicating that even the calculations started with two seed values close to each other diverge completely.
0.8
0.8
0.4
0.4
f[x]
f[x]
0 0
0.5
x
1
0
0
x
0.5
(a)
1
(b)
x, & f[x] = 4λ(1− λ ) for λ = 0.0.5
x, & f[x] = 4λ(1− λ ) for λ = 0.0.725
0.8
0.8 f[x]
17.3.1 Graphical Interpretation of Function Iteration The discrete domain dynamics involving function iteration given in equation (17.22) can alternatively be analyzed using a graphical approach. Since the fixed point is obtained by setting x(n+1) = f[x(n)] = x(n), we can graph y = f[x] together with y = x for a fixed value of λ as shown in Fig. 17.36. The points at which the two lines intersect are the fixed points since only at those points both the equations are satisfied. As can be seen from the figure, for λ < 0.25, x1e is the only point of intersection and is a attractor as we saw before. Considering the figure for λ = 0.5, we find that there are two intersections indicating the existence of two fixed points. For a given value of x(0), the functional iteration implies moving vertically from x(0) to the graph y = f[x]. From there, we move horizontally to the graph of y = x. The new x co-ordinate value gives x(1) and we repeat the process of moving vertically and horizontally. As can be seen from the figure, for λ = 0.5, this process ends at the second fixed point x 2e , which therefore is the new attractor. We can see from the figure that any other initial condition will also lead to this attractor. The reason that x 2e is stable and
f[x]
0.4
0.4
0 0
0.5 (c)
x
1
0
0
0.5
x(0)
xˆ (0)
x 1
(d)
Figure 17-36. A graphical interpretation of the nonlinear discrete dynamics of equation 17.22 for some values of λ .
We can calculate the derivative of f[x] as a function of λ to find the stable attractor value. Thus, df[x]
˙ dx = f [x] = 4λ(1− 2x)
(17.25a)
the points of oscillation. Since the number of stable fixed points start growing very fast { 2 0 , 21 , 2 3 , 2 7 , 215 etc.} that are confined to a small, fixed region {0 to 1}, we reach a point fast where the effects due to numerical imprecision takes over and makes the time series look chaotic. Let us look at this issue little bit further.
and f ' [x] x =x
1e =0
= 4λ, and f ' [x] x =x
(4λ−1) 2e= 4λ
= 2 − 4λ
(17.25b)
from which we find that x1e is stable for -0.25 < λ < 0.25 and x 2e is stable for 0.25 < λ < 0.75 . The next question is what happens when λ > 0.75 when the derivatives for both fixed points are greater than one in magnitude. The period 2 {or higher} oscillations that we obtain are in fact the stable fixed points of f 2 [x] {and higher functions}as can be explained using Fig. 17.37 where we show the plots of f[x], f 2 [x] , and f 4 [x] for λ = 0.7, 0.75, 0.825, and 0.9. Looking at the plot for λ = 0.7 (Fig. 17.37a), we find that the functions f[x] and f 2 [x] intersect the line y = x at the same two fixed points and the second fixed point becomes the stable fixed point. In figure a we can also see two humps {derivative equals zero} for the function f 2 [x] and the fixed points fall in between the valley and the second hump. As λ increases to 0.75 (Fig. 17.37b), the move to the fixed point takes more number of iterations {as can be seen from the move vertically, move horizontally rule} and at the stable fixed point, the function f 2 [x] becomes tangential to y = x. As we increase λ further, say 0.825 (Fig. 17.37c), we find that the function f 2 [x] intersects the function y = x at four points and the period 2 oscillation that we see happens to be two points from these four points. The slope of the function f 2 [x] at these two points can be shown to be less than one in magnitude and the slope at the other two intersections to be more than one in magnitude. Therefore, what we see as the period 2 oscillation are in fact two stable fixed points of the function f 2 [x] . We can thus interpret the equation (17.22) as the evaluation of: x(n + 2) = f [x(n)], n = 0, 2, 4 etc. 2
(17.26a) and
x( ˆn + 1) = f 2 [x( nˆ )], n =1, 3 etc.
(17.26b)
with the help of the function f[x(n)] applied twice leading to the intermediate sample values. The same process continues as λ increases. That is, we start seeing respectively 8, 128, 32768, etc. stable fixed points of f 4 [x], f 8 [x], f 16 [x] etc. as
x, f[x], f 2 [x] for λ = 0.7
x, f[x], f 2 [x] for λ = 0.75
1
1
0.8
f 2 [x]
f 2 [x]
0.8
f[x]
0.6
0.6
0.4
0.4
0.2
0.2
f[x]
x
x 0
0
(a)
x
0.5
1
0
0
x, f[x], f 2 [x], &f 4 [x] for λ = 0.825
0.8
x
0.5
(b)
1
x, f[x], f 2 [x], &f 4 [x] for λ = 0.9
0.8 2
f [x]
f[x] f 4 [x]
0.4
0.4
f[x]
f 4 [x] f 2 [x]
0
0 0
0.4
0.8
0
0.4 (d)
(c)
[
0.8
]
Figure 17-37. The plot of f[x] = 4λ(1− λ)and f [x] = f f[ x ] for some values of 2
λ to illustrate the move from one stable fixed point for the dynamics of equation 17.22 to period-2 oscillation. The period-2 oscillation corresponds to the two stable 2 fixed points {out of 4 fixed points} of f [x] when λ > 0.75 .
31 30
22 21
0
s 8 bit exponent
23 bit mantissa (a)
±2
−2
−1
±2
± 2 =1
±2
0
1
±2
2
Magnitude
∆=2
22 Quantization 2 levels in each range
−24
∆ = 2−23
∆ = 2−22
∆ = 2−21 (b)
Figure 17-38. a) A typical floating point representation for numbers; b) The quantization step size, ∆ , and the number of quantization levels.
In Fig. 17.38a we show a typical representation for a number in modern day computers using floating point arithmetic. Using a 4 byte {32 bit} representation, we use 23 bits for the fractional part, 8 bits to denote the exponent and one bit for sign. It is normally assumed that the fractional part will be normalized so that the values will lie in the range 0.5 to1 − 2 −23 to avoid the possibility for multiple binary representation for the same numerical value. The exponent is used to represent powers of 2 and will be in the range -128 to 127 in a 2's complement or a similar notation. Therefore, a floating point representation allows us to represent a wide range of numbers {large dynamic range} from −2127 (1− 2 −23 ) to 2127 (1 − 2 −23 ) {or approximately from −1.7x10 38 to1.7x10 38 } and at the same time allowing good resolution for small (less than one in magnitude) as well as large numbers. This is illustrated in Fig. 17.38b. We have 2 22 = 4,194,304 quantization levels for each range (in absolute value) given by 2 n (0.5) to 2n (1− 2− 22 ) , n = -128, -127, ..., 127 and the quantization step size increases as the absolute value increases. Therefore we have more than sufficient number of quantization levels for normal problems. However, in problems such as the ones represented by the dynamics under consideration, the
number of intersections and the number of stable fixed points in the fixed range of 0.5 to 1.0 increase so fast { 2 0 , 21 , 2 3 , 2 7 , 215 etc.}that beyond some value for λ , what we see is not the exact fixed points but the ones representable by the machine precision. Thus, the results of simulation start looking chaotic with characteristics such as high sensitivity to initial values etc. However, as the results are coming from a well defined dynamics {with just one parameter} and simulation on a machine which has its own pattern in number representation, we see the same structure being repeated in the phase plane as we zoom into a particular region or form new series from the original by retaining one sample per n-consecutive samples and so on. The limited resolution that is available for plotting {300 to 1200 dots per inch} also adds to the structure coming out of the dynamics.
17.3.2 Interpretation from Continuous Systems' Perspective It is kind of intriguing to learn that a first order nonlinear difference equation with just one parameter can lead to varied and interesting results as that parameter is varied. Using the graphical approach we learnt that what we see are really the fixed points of the functions f[x], f 2 [x] etc. and thus, we move from one discrete domain system to another discrete domain system. We will now provide a new perspective for chaos generated by first order difference equations such as the one given in equation (17.22) connecting continuous domain systems and discrete domain systems. We learnt the effects of sampling {in particular, under-sampling} on a continuous waveform . For example, a number of continuous signals can lead to a single discrete waveform as given below: x 0 (t) = sin [ω 0 t]
2π x1 (t) = sin [ω 1t] = sin ω0 + T t x 2 (t) = sin [ω 2 t] = sin ω0 + 4π T t ⇒ sin [ ωˆ 0 t ], ωˆ 0 = ω 0 T M x k (t) = sin[ ω k t] = sin ω 0 + 2πk T t
[ [
] ]
[
]
(17.27)
A conceptually similar effect can be observed if we look at the impulse response {the response to initial stored energy and no external excitation} of linear electrical networks as obtained numerically using the forward difference equation d 1 = (D − 1[.] −1) dt T
(17.28)
for differentiation. In the above equation, D[.] stands for delay {by T seconds} operator and D −1 [.] for advance operator}. In Fig. 17.39, we show a simple case involving a number of capacitor-Resistor networks. It can be observed that if x1 (0) = x2 (0) = x3 (0) =L T T T 1 = 2 = 3 =L 2 4
then, all the waveforms x i(n) would be similar (one waveform under-sampled by factor of 2 of the waveform directly above it). Of course, these waveforms are not very complex to lead to any excitement on our part. They go down to zero exponentially for |b| < 1 (stable network; the resistance is a passive one and dissipates energy all the time) or go to infinity for |b| > 1 (unstable network; the resistance is in fact an active element that generates energy) as t → ∞ . However, the significance of this observation will become obvious as we look at the next case, that of nonlinear electrical networks. Let us now consider a number of simple first order RC networks with a linear unit valued capacitor and a nonlinear, nonpassive resistor with specific iR Vs v R characteristics as shown in Table 17.1. As can be seen in the table, the resistance characteristics are based on the quadratic parabolic expression seen in the previous example: f[x] = 4λx{1− x}
(17.30)
and expressions such as f[f[x]] = f 2 [x] , f 4 [x] etc. The resistance in the first circuit (first row) is characterized by the current-voltage relationship: i R1[v R1 ] = −{f[v R1 ]− v R1} = −{4λvR1 (1− v R1 ) − v R1} 4λ − 1 ) 4λ
= −{g[v R2 ] − v R2}
where g[v R2 ] ≡ f 2 [v R2 ]
= −{4λ(4λvR2 (1− v R2 ))(1 − (4λv R2 (1− v R2 ))) − vR2 } 4λ + 1 16λ2 −1 )v R2 − ( )} 4λ 64λ3 4λ− 1 2 4λ+ 1 4λ + 1 = −64λ3v R2 {vR2 − }{vR2 − ( )v R2 + } 4λ 4λ 16λ2 = −64λ3v R2 {v3R2 − 2v 2R2 + (
(17.29)
= 4λvR1 (v R1 −
i R2 [v R2 ] = −{f 2 [v R2 ] − vR2 }
;
(17.31)
a second order polynomial in the independent variable, the voltage; the resistance in the second circuit (second row) is characterized by the currentvoltage relationship:
= −64λ3v R2 {vR2 − {vR2 −
(17.32)
4λ− 1 4λ + 1+ (4 λ +1)(4 λ − 3) }{vR2 − }× 4λ 8λ
4λ + 1− (4 λ +1)(4 λ − 3) } 8λ
a 4th-order polynomial in v R2 ; the resistance in the third circuit (third row) is characterized by the current-voltage relationship: i R3 [v R3 ] = −{f 4 [v R3 ] − vR3 } = −{g2 [v R3 ] − v R3} =− {h[v R3 ] − vR3 }
(17.33) where h[v R3 ] ≡ g [v R3 ] 2
a 16th-order polynomial and so on. Thus, the polynomial order increases as the square of the polynomial order used in the previous resistor. The current-voltage characteristics of the various nonlinear resistors are plotted in column # 3 of the table. Assuming 0.25 ≤ λ < ∞ , we find that the characteristics of the first nonlinear resistor becomes zero at v R1 = 0 and vR1 = (4 λ −1) 4λ) , negative for 0 ≤ v R1 ≤ (4 λ− 1) 4λ and positive elsewhere. That is, the nonlinear resistor behaves as a negative resistor for −∞≤ v R1 ≤ (4 λ − 1) 4λ and as a positive resistor for (4λ − 1) 4λ ≤ v R1 ≤ ∞ . Therefore, if we construct the first-order network in row # 1 and observe its response for stored initial energy in the capacitor, we will find it settling at v R1 = (4λ − 1) 4λ for all values of λ in the range 0.25 ≤ λ < ∞ ; that is for all positive values of λ >0.25, there will be a stable attracting point for this first order continuous domain dynamics. Considering the current-voltage characteristics of the nonlinear resistor in row # 2 of the table, We find the possibility for more complex behavior. By setting i R2 [v R2 ] = −{g[v R2 ] − v R2} = 0 , we can find the steady state values of v R2 , the fixed points of the dynamics corresponding to the nonlinear network of row # 2. From (17.32), we find that the dynamics corresponding to this network has four fixed points given by:
v R2e = 0, v R2e
4λ −1 = , 4λ
v R2e =
4λ +1 + (4λ + 1)(4 λ− 3) , and 8λ
v R2e =
4λ +1 − (4λ + 1)(4 λ− 3) } 8λ
(17.34)
That is, when 0.25 ≤ λ < 0.75 , the characteristic has only two real-valued fixed points, v R1 = 0 and vR1 = (4 λ −1) 4λ) , and these two fixed points are the same as the ones found in the first network. Thus, the two networks will give the same steady state response even tough the resistors connected to the networks have different characteristics. When λ ≥ 0.75 , the second network has four real-valued fixed points as can be seen from equation (17.34). One of the new fixed point falls between the two original fixed points v R1 = 0 and vR1 = (4 λ −1) 4λ) and the other falls between v R1 = (4λ − 1) 4λ) and one as shown graphically in column # 3 of the table. From the graph we can identify the range of values of the voltage for which the resistor becomes passive or active. We find that the two new fixed points become the stable equilibria or attracting fixed points of the RC network of row # 2. Therefore, we will observe the response to initial energy settle at one of those two points depending on the initial condition. That is, the steady state response will be different from the steady state response of the RC network of row # 1 when λ ≥ 0.75 . Similarly we will find that the current-voltage characteristics of the nonlinear resistor in the RC circuit of row # 3 will have two real valued zero crossings for 0.25 ≤ λ < 0.75 and any where between 2 to 16 (and even number of) real valued zeros depending on the value of λ ( λ ≥ 0.75 ) and all less than one in value. Thus, the steady state response will correspond to that of the first and the second RC network or differ from the first or differ from both depending on the value of λ . Similar statements apply to the steady state dynamics of RC networks with nonlinear resistors having characteristics formed by the repeated application of the function f[.]9. Thus, we can conclude that we can have a number of nonlinear electrical networks or equivalently, a number of continuous domain
9 Of course, the transformations { f[.],
f 2 [.], f 4[.], f 8 [.], LL} applied lead to
exponentially increasing number of stable equilibrium points in a small range, zero to one, the domain of attraction for each stable equilibrium becomes much smaller, and quickly reach a point where we cannot realize such elements from a practical perspective. However, this example is intended to demonstrate some other important aspect as we will see.
dynamics that lead to the same non-zero valued steady state response for certain combinations of values for the parameters used. This is perhaps one important point that we need to remember from this example. Now let us consider what happens if we calculate the discrete domain equivalent of the various nonlinear RC networks shown in column # 1 by substituting the differential operator by the forward-difference operator and the response obtained using these nonlinear discrete domain equations. In column 4, we show the discrete domain system equivalent of the various networks obtained. The resulting discrete domain systems are the ones we saw in the previous section. In column 5, we show the relationship between the responses of the various discrete-domain expressions for the same initial stored energy. As shown there, the response corresponding to a particular expression is a downsampled (by a factor 2) version of the response from the expression above it. Thus, what emerges from the above discussion is that when we move from continuous domain systems (or networks) to discrete domain systems, the process of discretization can introduce distortion. First, many continuous domain systems (or their dynamical equations) get mapped onto a single or similar discrete domain systems (that is, the mapping is from many to one). This explains the earlier observation by researchers that a single parameter discrete domain system can lead to various signals, both stable and chaotic. Second and more importantly, certain continuous systems cannot be simulated using their discrete-time equivalents. An example of this situation is the first RC network in Table 17.1 for value of λ in the range 0.75 < λ < ∞ because what we see in simulation corresponds to that of the second (or higher, depending on the exact value of λ ) RC net in that table. Even though this may be shocking initially, it is well in line with what we have seen in signal representation (continuous domain signal to discrete domain signal) and linear system simulation. Summarizing our observations so far, if we can build RC networks of the form shown in Table 17.1, and examine their impulse responses (response to some initial stored energy), we will find the response settling at one of the many stable values depending on the initial value. Though the number of stable values will increase depending upon the resistor characteristics, we will not see chaos if the network elements are ideal and no noise is present. However, as we simulate the discrete-time equivalent of these RC networks, we first see all the stable fixed points of the network leading to the period two, period four etc. oscillations. However, as the value of λ increases, the second-effect -- that of finite-precision mentioned before -- enters the picture. If we were to use infinite precision (and of course there is no such thing) we will not see any chaos. However, all the simulations are based on a machine with finite precision. Floating-point (FP) and double FP representations which are normally used and sufficient for most problems, cannot simulate accurately systems having 128 or higher stable points in a small range 0 < v R [ n ]