Am. J. 52:1762-1770 (1988). 1976). Others have approximated the hydraulic prop- erties from soil textural, bulk density or other soil data. (Bloemen, 1980; Rawls ...
DIVISION S-6-SOIL AND WATER MANAGEMENT AND CONSERVATION Using Texture and Other Soil Properties to Predict the Unsaturated Soil Hydraulic Functions J. H. M. WOSTEN AND M. TH. VAN GENUCHTEN*
ABSTRACT The unsaturated hydraulic properties of soils are important but difficult to measure. Rather than measuring the hydraulic properties directly, we followed a different approach by fitting analytical expressions for the soil water retention and hydraulic conductivity functions to experimental data for a wide range of soils in the Netherlands. Analysis of the data shows the flexibility of the analytical expressions and also gives insight into how the different model parameters affect the calculated unsaturated hydraulic functions. Regression analyses are used to relate the estimated model parameters to more easily measured soil properties, such as bulk density and percentages silt, clay and organic matter. After calibration, the relations are used to predict the hydraulic functions of soils for which only the more easily measured soil properties are available. Accuracy of the predictions is analyzed in terms of functional criteria which are relevant to practical management problems. The predictive regression models are useful for estimating the unsaturated soil hydraulic properties of large areas of land, but need improvement for application to specific sites.
OIL HYDRAULIC BEHAVIOR is characterized by the S soil water retention curve which defines the volumetric water content (6) as a function of the soil water
pressure head (h\ and the hydraulic conductivity curve which relates the hydraulic conductivity (K) to water content or pressure head. These curves are crucial ingredients for predicting water flow and solute transport in the vadose zone, and for evaluating alternative soil-water-crop management practices. Even though new field or laboratory techniques for measuring the unsaturated soil hydraulic functions have been developed (e.g. Bouma, 1983; Klute, 1986), the methods have remained relatively cumbersome and costly, especially for the hydraulic conductivity. The measurement problem is complicated by results of studies (e.g., Nielsen et al., 1973; Russo and Bresler, 1981) which show that soils exhibit significant temporal and spatial variabilities in their hydraulic properties. This variability implies that numerous samples may be needed to properly characterize a given field. To partially circumvent the measurement problem, several investigators have proposed theoretical poresize distribution models that predict the hydraulic conductivity from more easily measured soil water retention data (Millington and Quirk, 1959; Mualem,
J.H.M. Wosten, Netherlands Soil Survey Inst., P.O. Box 98, 6700 AB Wageningen, The Netherlands; and M.Th. van Genuchten, U.S. Salinity Lab., USDA-ARS, 4500 Glenwood Dr., Riverside, CA 92501. Joint contribution from the Netherlands Soil Survey Institute and the U.S. Salinity Lab., USDA-ARS. Received 27 Nov. 1987. *Corresponding author. Published in Soil Sci. Soc. Am. J. 52:1762-1770 (1988).
1762
1976). Others have approximated the hydraulic properties from soil textural, bulk density or other soil data (Bloemen, 1980; Rawls et al., 1982; Haverkamp and Parlange, 1986). One of the proposed unsaturated hydraulic models is described by van Genuchten (1980) who combined an empirical S-shaped curve for the soil water retention function with the pore-size distribution theory of Mualem (1976) to derive a closed-form analytical expression for the unsaturated hydraulic conductivity. Except for the saturated hydraulic conductivity, Ks, the resulting conductivity function contains parameters that can be estimated from measured soil water retention data. An advantage of this model, like previous ones by Brooks and Corey (1964) and others, is that the hydraulic properties are expressed in the form of analytical (nontabular) functions, a feature that facilitates their efficient inclusion into numerical simulation models and also enables the rapid comparison of the hydraulic properties of different soils. Van Genuchten's unsaturated hydraulic functions have been shown in several recent studies (e.g., Stephens and Rehfeldt, 1985; van Genuchten and Nielsen, 1985; Hopmans and Dane, 1986) to give good descriptions of observed retention and/or conductivity data for a large number of soils. Hopmans and Overmars (1986) recently also demonstrated the applicability of those functions in a hydrological research project. The above studies rely on available soil water retention data for predicting the unsaturated hydraulic conductivity. Sometimes, as is the case in this study, directly measured unsaturated hydraulic conductivity data may also be available. To make use of all available data, we will apply in this paper nonlinear leastsquares parameter estimation techniques to fit van Genuchten's functions simultaneously to observed water retention and hydraulic conductivity data from a large number of soils in the Netherlands. Once estimated, the optimized model parameters will be used in a multiple regression analysis to investigate relationships between the fitted parameters and such more easily measured basic soil properties as bulk density, soil texture, and organic matter content. The regression model, in turn, is used to predict the hydraulic functions of three soils using only their basic soil properties. Rather than focusing on a statistical analysis of the fitted hydraulic functions, we will compare the predicted and the measured hydraulic functions in terms of functional criteria (Wosten et al., 1986) which relate directly to practical applications (e.g., travel time from the soil surface to the groundwater table). Specific purposes of this study are hence (i) to fit the analytical functions of van Genuchten (1980) to a large set of measured soil water retention and hy-
WOSTEN & VAN GENUCHTEN: PREDICTING UNSATURATED SOIL HYDRAULIC FUNCTIONS
draulic conductivity data, (ii) to explore the possibility of predicting the hydraulic functions from basic soil properties, and (iii) to compare measured and predicted hydraulic functions on the basis of functional criteria which are relevant to soil-water management
practices. MATERIALS AND METHODS Soil water retention and hydraulic conductivity curves were measured for a large number of soils in the Netherlands. The soils were classified according to soil texture (as used by the Netherlands Soil Survey Inst.), and type of horizon, being either topsoil (A horizon) or subsoil (B and C horizons). This classification resulted in 20 different soil groups (Table 1) comprising a total of 197 individual curves. Tabulated forms of the geometrically averaged curves for the 20 soil groups are given elsewhere (Wosten et al., 1987a). Because of wide ranges in soil texture, the individual curves within each group are quite variable. As a set, the curves form a unique data base covering a broad spectrum of soils in the Netherlands. Hydraulic conductivities were estimated using a combination of the following five methods: 1. The column method (e.g., Bouma, 1982) for the vertical saturated hydraulic conductivity, Ks. 2. The crust-test (an updated version of the method described by Bouma et al., 1983) for unsaturated conductivities when the pressure head, h, is between 0 and -50cm. 3. The sorptivity method (Dirksen, 1979) for conductivities of coarse-textured soils when h ^ —50 cm. 4. The hot-air method (Arya et al., 1975) for conductivities of medium- and fine-textured soils when h «£ — 50 cm.
1763
5. The evaporation method (Boels et al., 1978) for hydraulic conductivities when h is between 0 and — 800 cm. Soil water retention curves were obtained by slow evaporation of wet, undisturbed samples in the laboratory as reported by Boels et al. (1978) and Bouma et al. (1983). In this method, pressure heads are periodically measured with transducer-tensiometers while at the same time subsamples are taken to determine water contents, thus yielding points relating to h and 8. Water contents corresponding with pressure heads lower than —800 cm were obtained by conventional methods using air pressure (Richards, 1965). For relatively fine-textured soils, a staining technique was applied to record the effects of horizontal cracks on the upward flux of water from the water table to the rootzone (Bouma, 1984). DATA ANALYSIS The volumetric soil water content, 0, as a function of pressure head, h, is described with the following empirical equation of van Genuchten (1980)
(er < e where the subscripts r and 5 refer to residual and saturated values, and where a, n and m are parameters which determine the shape of the curve. The residual water content, 6n refers to the water content where the gradient d6/dh becomes zero (h ~» — °°). In practice, 6, is the water content at some large negative value of the soil water pressure head. The dimensionless parameter n determines the rate at Which the S-shaped retention curve turns toward the ordinate for large negative values of h, thus reflecting the steepness of the curve, while a (cm~') equals approximately the inverse of the pres-
Table 1. Number of individual curves, ranges in measured soil properties, and average values for the optimized parameters a, n and I for 20 soil groups. Soil
Number of curves
sat
2-50 p
Clay < 2 io
Organic matter
Bulk density
M50f
3
g/cm
Coarse-textured soils (105 samples) Topsoil Bl B2 B3 B4 Subsoil 01 02 03 04 Topsoil B7 B8 B9 Subsoil 08 09 010
5 11 9 5
4-7 11-17 19-29 37-49
49 7 14 5
1-9 10-16 21-32 37-47
5 10 3
10-12 12-16 18-22
7
9-11 12-16 18-22
12 6
140-170 130-170 130-165 130-160
0.0169 0.0203 0.0290 0.0157
1.83 1.52 1.44 1.58
0.826 -0.432 -0.152 0.225
0.1-2 1.4-1.8 150-180 0.3-2 1.5-1.7 150-175 0.2-2 1.4-1.8 130-170 1.4-1.7 0.3-1 130-165 Medium-textured soils (43 samples)
0.0551 0.0201 0.0278 0.0154
2.43 2.05 1.75 1.82
0.310
1.2-1.7 1.3-1.6 1.3-1.6
0.0347 0.0624 0.0536
1.27 1.25 1.15
-0.543
1.5-1.6 1.4-1.7 1.3-1.5
0.0316 0.0424 0.0400
1.32
-1.14 -2.43 -3.26
1.1-1.5 1.1-1.7 0.9-1.3
0.133
1.12 1.12
1.4-1.6 1.0-1.5 1.0-1.4
0.0510 0.0602 0.0740
1-4
3-10 4-13 2-5
2-6 2-3 2-8 0.4-1 0.3-1 0.1-1
1.4-1.6 1.3-1.5 1.1-1.5 1.1-1.5
1.28 1.21
0.666 0.229 0.153
-3.30 -4.59
Fine-textured soils (49 samples) Topsoil BIO Bll B12 Subsoil Oil 012 013
8 5 5
26-34 35-50 51-77
7 12 12
28-33 37-47 52-77
t Median sand particle size.
2-5 4-15 2-5
0.9-2 0.1-2 0.1-2
t Not included in the regression analysis.
0.138 0.141
1.08
-8.36 -7.66 -8.30
1.13 1.14 1.08
-5.50 -6.37 -9.38
1764
SOIL SCI. SOC. AM. J., VOL. 52, 1988
sure head at the inflection point where dd/dh has its maximum value. Assuming m = 1 — l/n, van Genuchten combined Eq. [1] with the following theoretical pore-size distribution model which was derived by Mualem (1976)
where / is an unknown parameter, x is a dummy variable, and S is relative saturation (0 < S < 1):
o, - er).
[3]
Combining Eq. [1] and [2] leads to (van Genuchten, 1980) K(S) = KSS' [1 - (l-S1"")'"]2 or in terms of the soil water pressure head
K(h) = Ks-
[4]
[5]
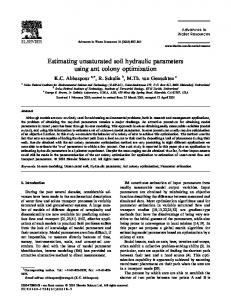
[1 + ahfl Equations [1] and [5] are the analytical functions describing the 6(h) and K(h) relationships, respectively. Although / is presumably a soil specific parameter, Mualem (1976) concluded from an analysis of 45 soil hydraulic data sets that / should be on the average about 0.5. In this study / is not fixed but considered to be one of the experimental unknowns. Figure 1 shows how the parameters n, a, 8r and / affect the shapes of the calculated soil water retention (Eq. [1]) and unsaturated hydraulic conductivity (Eq. [5]) functions. Unless noted otherwise, all curves were obtained with 6r = 0. 10, es = 0.50, a = 0.005 (cm-'), n = 2.5 and / = 0.5. Figure Ic shows that the parameter 8r affects only the shape of the retention curve while leaving the relative conductivity (Kr = K/KS) function unaffected. The parameter /, on the other hand, only affects the hydraulic conductivity and leaves the retention curve unchanged (Fig. Id). These properties; follow immediately from Eq. [1] and [5]. Figure 1 clearly 'demonstrates the flexibility of the analytical functions hi. generating different shapes of the soil water retention and hydraulic conductivity curves. We note that, except for the parameter /, similar plots of the hydraulic functions, with different scales and from different perspectives, have been presented and discussed also by Stephens and Rehfeldt (1985) and Hopmans and Overmars (1986). Van Genuchten and Nielsen (1985) in addition discussed the computationally more complicated case when the parameters m and n in Eq. [1] are independent. A nonlinear least-squares optimization program (SOHYP) was previously constructed (van Genuchten, 1978) to estimate the parameters 8n a and n from observed soil water retention data. The SOHYP code was modified to yield the RETC code (van Genuchten, 1986; unpublished) which allows some or all unknown coefficients (6n 6S, a, n, I and/or Ks) in Eq. [1] and [5] to be estimated simultaneously from measured soil water retention and hydraulic conductivity data. As before, the least squares parameter estimation process is based on Marquardt's maximum neighborhood method (Marquardt, 1963). The objective function, O(b), minimized in RETC is of the general form
i-M+ 1
Kb - \D.(KtJ>)]}2
where 6* and K* are the measured water contents and hydraulic conductivities, respectively, d,(b) and Kj(b) are the predicted responses for a given parameter vector [b] of un-
known coefficients, w, are weighting coefficients for the individual observations (set to unity in this study), M is the number of observed retention data and ./Vis the total number of observed retention and conductivity data. The parameters W , and W2 are also weighting coefficients. Parameter W2 is calculated internally in the program as follows
+ 1
**
m
which gives the water content data approximately the same weight as the ln(K) data. Parameter W\ is an independent input parameter which adds extra flexibility in assigning more or less weight to the water content data as compared to the water conductivity data. Because hydraulic conductivities often show more scatter than retention data, it is sometimes beneficial to assign a relatively small value to W:. In our study a value of 1.0 was assigned to W{, except for the sandy soils which required a much smaller value of 0. 1 to ensure visibly better fits of the typically steep part of the retention curve at the inflection point. In the most general case, the parameter vector {b} will contain all coefficients, i.e.: {b} = [Bn 0S, a, n, /, Ks}. The parameters ds and Ks in this study were fixed at their independently measured values, thus reducing the number of unknowns to four. The parameter Br was initially also considered to be an unknown. Since only a few soil water retention and hydraulic conductivity data points were available in the dry range, we restricted our analysis to pressure heads in the range from 0 to — 5000 cm. Because of this limited range in pressure heads, 0r was estimated to be zero, or close to zero, for a majority of the data sets. Following the example of Greminger et al. (1985), we consequently fixed 8r at zero for all soils, and then reanalyzed the data with only three unknown parameters: {b} = [a, n, /). After the parameter estimation step, multiple regression techniques were used to investigate the dependency of the estimated model parameters on more easily measured basic soil properties. Model parameters for the coarse-textured soils
were found to be correlated to the quantitative variables percent silt, percent organic matter, bulk density and median sand particle size (M50), and also to the qualitative variable "topsoil or subsoil." For medium- and fine-textured soils, the regressed variables were percent clay, percent organic matter, bulk density and again topsoil or subsoil. Linear, reciprocal and exponential relationships of these basic soil properties were used in the regression analysis, while also possible interactions among the soil properties themselves were investigated. Thus, the resulting regression model consisted of various basic soil properties, and their interactions, which contributed significantly to the optimized soil hydraulic parameters. Once established, the regression models were used to predict the unknown hydraulic parameters of three typical fine-, coarse- and medium-textured soils using their basic soil properties only. Finally, predicted and measured hydraulic functions of the three soils will be compared on the basis of functional criteria which have immediate relevance to managementtype applications Wosten et al. (1986) introduced for this purpose three functional criteria: 1 . Travel time, Tn of water from the soil surface down to a water table at depth L, assumed to be 1 m. The travel time is approximated by T = 6L/qd, where qd the average daily vertical downward_ flux for Dutch winter conditions (0.14 cm d~'), and 0_is the profile-averaged water content corresponding to qd as derived from the calculated or measured K(h\ff) curve. 2. Depth of water table, Lc, which can sustain a given upward flux of water to the soil surface or to the bottom of the root zone. As shown by Gardner (1958), this depth may be obtained by integrating Darcy's law
1765
WOSTEN & VAN GENUCHTEN: PREDICTING UNSATURATED SOIL HYDRAULIC FUNCTIONS
Kr
—_ __-t^
10°-: h(Cm)
-500-
n=4.53.5
1,5
2.5
1a
\ \ \ \ \ ^^ \ 'SA
\\ \ \\ \ \\ \ \\ \ \\ \
-400-
-300-
\
-200-
0-
OJOO
,
i
0.10
^^:sSs
•
X
10-'-
X ^\
10-2-
• 1 3
°~
:
X 1
-100-
I\
\S. ^ \N^ \\^\" \\" \
i5
\
\.
10-°- ——————— ,——————— ,——————— r ——————— ,——————— ,
-
0.20
0.30
0,40
0
0.50
-100
-200
-300
-400
-500
h(cm) Kr
"1!T\ 1b
10-'-
10'=-:
•
-400-
-300-
-200-
\
in\\\ \ \ \ \\\ \\\ \
c(=0.035V\rjj025XQ.015
'
v
\\ \ \ \\ \\ \ \ \ \^
io-«-
\
Q 005
\
\\ \ \ \\
-500-
\
\v\ \ ^\ '= \\ \ \ \
10-3r
h(cm)
11 111 \\
\\\
1O-6-
\
io-«-
v.
\
^^ oats
\
^^ \p.005
^^ 0.025
10-'^
-100-
0\ \ "--^^^
^^
OJ335
" ^ 0-, ——————— ,——————— ,—————
o.oo
0.10 a2o
OAO
ojo
0£o
0
-100
-200
-300
-400
-500
h(cm)
Fig. 1. Effect of the parameters n, a, 9, and / on the calculated soil water retention, 9(h), and relative hydraulic conductivity, Kj(h), curves (Fig. la, b, c, d, respectively). Continued on next page. to give
L-r Lc
i
Jo 1+5
7m
dh
[
$1
where hc is the imposed soil water pressure head (taken as — 500 cm) at the bottom of the root zone, and qu is the steady-state upward water flux density (assumed to
be 0.2 cm d~').
1766
SOIL SCI. SOC. AM. J., VOL. 52, 1988
3. Downward flux of water, qa, corresponding to a minimum soil air content, 6a (taken here to be 5%) which is required (FAO, 1985) to maintain adequate aeration in the root zone for maximum root activity and crop growth. The qa follows immediately from 3 the K(h$) function at a water content which is 0.05 cm cm~ 3 less than the saturated value.
We refer to Wosten et al. (1986) for additional discussions of the above functional criteria. Analysis of those criteria as calculated with the measured and predicted hydraulic functions yields practical information about the accuracy of the predictions.
Kr 10°-
h(crr
9r=0.0
\ -400-
-200-
0.1
0.2
0.3
\ \
\ \ \ \ \ \ \ \ \ \ \ \ \ \\\\ \\\\
-100-
^v
X ^\^
\
^
00JOO
:"~"^\
1c
0.10
0.20
OJO
0.40
-
0.50
()
-100
-200
-300
-400
-500
9 (cmVcm3)
h(cm)
Kr 10°-=
h(cm
\
-500-
1-
\
:
^^^^^•^•^ \\
~~^~——
10-' -
N^X^
\
: \
X^x
,0--
\
-300-
\^
-200-
-100-
\
\
10-' -
\
"~^~ ——~ -2.0
\x
-4OO-
-s
vVsi
\
0- ———————— I———————— i————————i————————i———————1 0.00 0.10 0.20 0.30 OAO OSO
10'B-
D
-100
-200
-300
-400
-500
h(cm)
Figure
9s
6r
n
1a
0.5
ai
0.005
1.5,2.5,3.5,4.5
0.5
1b
0.5
0.1
0.005,0.015,0.025,0.035
2.5
0.5
1c
0.5
0,0.1,0.2,0^
0.005
25
05
Id
0.5
0.1
0.005
2.5
0.5, -2.0, 2.0
n
Fig. 1. Continued.
t
WOSTEN & VAN GENUCHTEN: PREDICTING UNSATURATED SOIL HYDRAULIC FUNCTIONS
RESULTS AND DISCUSSION Table 1 summarizes results of the simultaneous fit of Eq. [1] and [5] to the measured soil water retention and hydraulic conductivity data. Note that the data sets are divided into three soil textural groups (coarse, medium, fine) and also according to "topsoil versus subsoil." The table gives for each group of soil horizons the average2 value of the estimated parameters «, n and /. The R (R is the correlation coefficient) between measured and fitted data ranged from 0.94 to 0.99 for all individual curves. Figure 2 shows good agreement between measured and fitted curves for three typical soils selected from the three soil textural groups. The three soils were classified as a sandy, siliceous, mesic, Typic Haplaquod (01); a fine loamy, mixed, mesic, Typic Fluvaquent (B8); and a fine clayey, mixed, mesic, Typic Fluvaquent (013), respectively (Soil Survey Staff, 1975). The R2-values between measured and calculated data were 0.97, 0.99 and 0.99, respectively. Gupta and Larson (1979), Poelman and van Egmond (1979) and Rawls et al. (1982) previously presented several regression equations for predicting water contents at a limited number of pressure head values from readily available basic soil properties. Saxton et al. (1986) just recently derived three functions for the soil water retention curve covering the full range of pressure heads from saturation to- h = — 15 000 cm. Hence, they avoided the need to interpolate between (or extrapolate) tabular water contents and pressure head data. Saxton et al. (1986) found good agreement between their water retention functions and those calculated with equations of Rawls et al. (1982) A similar prediction of the hydraulic conductivity curve was less successful, however. Our study deviates from the above approaches in that the fitted parameters n, a and / are used for both the soil water retention and the hydraulic conductivity curves. Multiple regression of each of the model parameters with the basic soil properties yielded six different regression equations. The parameter / for the2 coarsetextured soils was found to be uncorrelated (R = 0.07) with the basic soil properties. Therefore, the average value of 0.22 for / was used for all coarse-textured soils irrespective of texture, bulk density or median sand particle size. The 95% confidence limits of/were —0.16 and 0.60, which indicates that the average value of 0.22 for these coarse-textured soils is in agreement with Mualem's (1976) finding that / could be fixed at 0.5. For the medium- and fine-textured soils / was clearly related to percent silt, bulk density, and topsoil or subsoil, with R2 = 0.68 and / for the individual curves ranging from —16.0 to 2.2. Fixing / at 0.5 in these cases did not result in acceptable fits of the experimental data (see also Fig. Id). The regression models for the parameters a and n revealed .Revalues which ranged from 0.42 to 0.76, which is much lower than the values of 0.99 reported by Saxton et al. (1986). This discrepancy is of course partly due to the fact that our model parameters pertain simultaneously to the water retention and hydraulic conductivity curves over a broad range of pressure heads. Still, the relatively low .Revalues indicate a need to improve the regression models. One possible way to achieve this is to use a much larger
1767
hydraulic data set involving a broader array of soils than used here. Alternative approaches to relate the hydraulic data to basic soil properties may also be needed. Possible approaches are indicated by Williams et al. (1983) who also included soil structure and clay mineralogy in their analysis, and by Haverkamp and Parlange (1986) who used the cumulative particlesize distribution instead of specific particle size classes such as percent sand, silt or clay. The regression models established in this study were used to predict the unsaturated soil hydraulic functions from soil texture and other properties in conjunction with the measured values of Bs and K^ Figure 2 shows the measured and predicted curves for three soils: 01, B8 and 013. The 90% confidence intervals for the predicted curves were calculated from the standard deviations of the differences between measured and predicted values of 8 and logATat 12 values for h. This was done for all soil hydraulic functions of both the coarse-textured soil group and the medium- and fine-textured soil group. Because these differences were normally distributed, and because of the relatively large number of hydraulic functions in the two soil groups, the confidence limits could be approximated by taking the predicted values plus and minus 1.65 times the respective standard deviations. The calculated confidence intervals are relatively wide, indicating that predictions made with the regression models of this study will show considerable dispersion. Table 2 compares the values of the three functional criteria (Tn Lc, and qa) as calculated from the measured and predicted hydraulic functions. The hydraulic functions hence are compared in terms of specific management problems and the desired accuracy of the answers for these problems. For example, predicting the travel time Tr for the three soils with an accuracy of ± 8 wk (2 months) is often good enough for most management problems on relatively detailed scales (e.g., for scales of 1:10 000 or greater; Breeuwsma et al., 1986). Depth to water table (Lc) and downward flux density (qa) appear also accurate enough for most management problems on detailed scales in the case of coarse-textured soils. However, their accuracy for medium- and fine-textured soils may permit only answers on a more general scale (e.g., for scales of 1:50 000 or smaller; van der Sluijs and De Gruijter, 1985). This finding is consistent with the results of Fig. 2 which showed better agreement between measured and predicted hydraulic properties for coarsetextured soils as compared to medium- and fine-textured soils. Our contention that evaluation of the regression results should be based on their intended Table 2. Functional criteria as calculated from the measured and predicted hydraulic properties of three typical coarse-, mediumand fine-textured soils.
Travel time, Tr (day) Depth to water table, Lc, (cm)
Downward flux density, qa (cm d" 1 )
Coarsetextured soil
Mediumtextured soil
Finetextured soil
Measured
Predieted
Measured
Predieted
Measured
143
121
300
257
407
421
145
120
138
65
22
12
30
23
0.2
0.5
0.002
Predieted
0.010
1768
SOIL SCI. SOC. AM. J., VOL. 52, 1988
use is consistent with the conclusion of de long (1982) that water retention parameters of soil textural groups as derived by Clapp and Hornberger (1978) are useful for modeling large areas of soils but fail to accurately approximate soil water characteristics of specific sites.
In this respect we note a soil survey mapping study by Wosten et al. (1987b) who showed that the scale of application of a given model should depend on the accuracy by which answers must be known, and on the mapping costs involved. K(cm/day)
Coarse-texured soil: 01 silt organic manor bulk density M50
(%) 8.0 (%) 0.5 (g/cm3) 1.52 (Mm) 140
2a
10-"-
10-'° 0.00
0.10
0.20
0.30
0,40
0.50
-10°
0.60 3
8 (cmVcm ) K(cm/day)
Medium-textured soil: B8 clay (%) 12.8 organic matter (%) 3.5 bulk density (g/cm3) 1.39
2b
10°-
10-*-
h(cm)
10"
-102:
10-
-10°0,00
0.10
0.20
0.30
0.40
030
0.60
-10°
-10'
-10=
-103 h(cm
'
Fig. 2 Measured, fitted and predicted soil water retention, 6(h), and hydraulic conductivity, K(h), curves for three typical coarse-, mediumand fine-textured soils. Continued on next page.
WOSTEN & VAN GENUCHTEN: PREDICTING UNSATURATED SOIL HYDRAULIC FUNCTIONS
SUMMARY AND CONCLUSIONS The analytical hydraulic functions of van Genuchten (1980) were fitted simultaneously to observed soil water retention and hydraulic conductivity data for a wide variety of soils in the Netherlands. The parameter Br was fixed at zero without significantly affecting the accuracy of the results. Soil water retention data was weighted more than hydraulic conductivity data (W{ in Eq. [6] was set at 0.1) to provide acceptable fits of the retention curves for the coarsetextured soils. The hydraulic properties of these soils were not dependent upon the parameter /, yielding a constant value of 0.22 (± 0.38) which agreed well with Mualem's (1976) average value of 0.5. The conductivity and retention data for the medium- and finetextured soils were weighted equally, leading to /-values which varied between —16.0 to 2.2 as a function of soil texture and other factors. The optimization procedure resulted in reasonably accurate analytical approximations for the hydraulic properties, thus avoiding the cumbersome and computationally inefficient handling of tabulated data in mathematical models of unsaturated flow. An approach that relates the estimated parameters to easily measured soil properties is described. Once established, the resulting expressions allow prediction of the hydraulic functions of unsaturated soils for which only soil texture and other data (organic matter content, bulk density) have been measured. Predicted hydraulic properties were compared in terms of functional criteria which relate directly to practical management applications. We believe that any judgement about the accuracy of the predicted hydraulic func-
tions should be based on the desired accuracy of those criteria. Results indicate that the predictive regression models established in this study can be used to derive soil hydraulic functions for large areas of land when working on scales of 1:50 000 or smaller. The models need improvement for site-specific applications at scales of 1:10 000 or larger, however. The use of other data bases, or the inclusion of different soil textural properties such as the cumulative particle-size distribution (Haverkamp and Parlange, 1986) needs to be considered. ACKNOWLEDGMENT Soil hydraulic data used in this study included data made available by the Inst. of Land and Water Management Research, Wageningen. Their permission to use those data is appreciated. APPENDIX-SYMBOLS USED [b] = unknown parameter vector O = least-squares objective function given by Eq. [6] h = soil water pressure head (cm of water) hc = imposed soil surface boundary condition for the pressure head (cm of water) K = unsaturated hydraulic conductivity (cm d~') Kr = relative hydraulic conductivity Ks = saturated hydraulic conductivity (cm d~') / = parameter in Eq. [2] L = water table depth (cm) Lc = critical water table depth (cm) m = parameter in Eq. [1]: m = 1 — l/« M = number of soil water retention data in leastsquares fit Legend
K(cm/day) Fine-textured soil:013
measured
clay (%) 56.8 organic matter (%) 1.7 bulk density (g/cm3) 1.09
— ——
90% confidence interval
2c 10-' -
h(cm)
10-' -
-10*-
10"-
10-"
-10'-:
-
-10°
0.10
0.20
0.30
fitted predicted
10° -
0.00
0,40
0,50
1769
0.60
8(cm 3 /cm 3 ) Fig 2. Continued.
-10°
-10'
1770
SOIL SCI. SOC. AM. J., VOL. 52, 1988
M50 = median sand particle size Gtm) n = parameter in Eq. [1] AT = total number of data in least-squares fit qa = water flux density at given air content (cm d^ 1 ) qd = downward water flux density (cm d~') qu = upward water flux density (cm d~') S = reduced water content Tr = travel time in the unsaturated zone Wj = weighting coefficients in Eq. [6] Wt = Weighting coefficient in optimization process W2 = Weighting coefficient denned by Eq. [7] a = parameter in Eq. [1] (cm~'). 3 0 = volumetric water content (cm cm"3) 8 = profile-averaged water content 6a = volumetric air content of soil 8r = residual water content (cm3 cm~3) 6S = saturated water content (cm3 cm~3).