3Università di Udine, Dipartimento di Matematica e Informatica. 4Università di .... mal curvature, the normal displacement between the local point and the ...
Eurographics Italian Chapter Conference (2008) V. Scarano, R. De Chiara, and U. Erra (Editors)
3-SHIRT: Three-Dimensional Shape Indexing and Retrieval Techniques U. Castellani2 , G. Cortelazzo1 , M. Cristani2 , E. Delponte5 , A. Fusiello2 , A. Giachetti2 S. Mizzaro3 , F. Odone5 , E. Puppo5 , R. Scateni4 , P. Zanuttigh1 1 Università
di Padova, Dipartimento di Ingegneria dell’Informazione di Verona, Dipartimento di Informatica 3 Università di Udine, Dipartimento di Matematica e Informatica 4 Università di Cagliari, Dipartimento di Matematica e Informatica 5 Università di Genova, Dipartimento di Informatica e Scienze dell’Informazione 2 Università
Abstract This paper describes the work that has been done during the first year of the 3-SHIRT project, which aims at developing innovative solutions in all the phases of content-based 3D shape retrieval, namely: shape analysis and segmentation, design of shape descriptors, shape indexing and matching, and evaluation. Categories and Subject Descriptors (according to ACM CCS): I.3.5 [Computer Graphics]: Computational Geometry and Object Modeling; I.3.5 [Computer Graphics]: Curve, Surface, Solid, and Object Representations
Introduction In the past the proliferation of a specific digital multimedia data type was followed by emergence of systems facilitating their content based retrieval. With the recent advances in 3D acquisition techniques, graphics hardware and modelling methods, there is an increasing amount of 3D objects spread over various archives: general objects commonly used e.g. in games or VR environments, solid models of industrial parts, etc. On the other hand, modelling of high fidelity 3D objects is a very cost and time intensive process, a task which one can potentially get around by reusing already available models. Another important issue is the efficient exploration of scientific data represented as 3D entities. Such archives are becoming increasingly popular in the areas of Biology, Chemistry, Anthropology and Archaeology to name a few. Therefore, there has been a recent surge of interest in methods for retrieval of 3D models from large databases. Unlike text documents, 3D models are not easily retrieved. Attempting to find a 3D model using textual annotation and a conventional text-based search engine would not work in many cases. The annotations added by human beings depend on language, culture, age, sex, and other factors. They may be too limited or ambiguous. In contrast, content based 3D shape retrieval methods, that use shape properties of the 3D models to search for similar models, carry much potential for boost retrieval results with respect to text-based methods [MKF04]. c The Eurographics Association 2008. �
Most of work on content-based retrieval has focused on 2D data [Rem01]. Content based retrieval and classification systems [TV04, Rem01] have demonstrated their effectiveness in manipulating non-textual information (i.e., multimedia data types) such as audio, images, and videos [FMK∗ 03]. Extending these system to 3D surface models is nontrivial. In particular, the 3D retrieval strategy implies the studies of several further issues with respect to the 2D counterpart, such as the analysis of 3D shape instead of 2D images, the extension of the concept of descriptor from the 2D to the 3D domain, and the effective indexing and matching of 3D shapes. Moreover, the evaluation of the retrieval performances has been carefully explored for text but it is still in its infancy for what concern the 3D shapes. Some interesting examples of preliminary 3D model retrieval systems exist, at the National Taiwan University [3D a] and at the National Institute of Multimedia Education (Japan) [Ogd]. Furthermore, some prototypes of 3D search engine have been proposed at Princeton University [FMK∗ 03], at Utrecht University [3D c] and at the University of Konstanz [3D b]. The 3-SHIRT (Three-Dimensional Shape Indexing and Retrieval Techniques) project targets content-based 3D shape retrieval, aiming at developing innovative solutions in all the phases of the process, namely: i) shape analysis and segmentation; ii) design of shape descriptors; iii) shape in-
114
Castellani et al. / 3-SHIRT
dexing and matching; iv) evaluation. This paper describes the research that has been carried out during the first year of the project. The following sections will deal with each one of the above points.
mid-point of the segment connecting the vertex with the intersection will be counted for the voxel it is inside to build a density map of mid-points representing a suitable topological descriptor of the mesh, holding characteristics similar to its skeleton.
1. Shape analysis Shape analysis is performed off-line, as a pre-processing step aimed at improving retrieval performances. It includes skeletonization and segmentation. 1.1. Skeletonization The approach followed to find the 3D skeleton of a given mesh is fairly straightforward: embed the mesh in a regular discrete structure, then find which elements of the structure are crossed by the mesh and use a voxel-based approach to compute the skeleton. The chosen data structure was, quite naturally, an octree, which we implemented in the OpenMesh [Ope] framework. It is thus possible to convert any mesh in a voxel-based representation with the desired level of detail, based on mesh features (e.g., the shortest edge) or on the maximum number of voxels needed.
Figure 1: The voxelization and skeletonization plug-in developed for the OpenMesh visualizer: OpenFlipper We are designing two different strategies for skeleton extraction: • Following the approach originally described in [GS99] and then in [CSM07] the volume inside the mesh will be eroded (volume thinning) iteratively eliminating the voxels closest to the mesh until keeping only a one-voxel wide structure representing an approximation of the mesh’s skeleton (see Fig. 1); • Using a novel approach still under evaluation, we will shoot rays from the vertices of the mesh inside computing the first intersection of each ray with the mesh; the
1.2. Segmentation Segmentation is the task of partitioning a 3D mesh into connected regions or parts, thereby giving a high-level organization to the raw data. We propose three strategies. 1.2.1. Segmentation based on saliency This task has been addressed by introducing a new 3D saliency measure, able to extract perceptually meaningful regions of interest from 3D meshes [CCFM08]. The proposed approach is theoretically sound and it is inspired by the research on saliency measure on 2D images. In summary, the source mesh is decomposed in multiscale representations, and a saliency measure is defined by opportunely combining the results gathered at each scale level. The idea is to find robust variations in the mesh which are resolution invariant. The main steps of the proposed procedure are: • Scale maps computation: a scale map is computed by first applying the Difference of Gaussian filter at a certain scale σ to all the mesh vertices, and then projecting each of the 3D displacement vectors (caused by the 3D filter) to the respective vertex normal. By defining properly different σi several scale maps are computed. • Scale normalization: each scale maps is normalized by adopting the so called Itti’s approach [IKN98]. Basically, the normalization is carried out combining global and local maxima of the same map. In particular, this procedure allows an enhancement of peaks. • Adaptive inhibition process: from each vertex, we consider all the values of the scale map observed on the neighborhood. If such value is higher than the 85% of the values in its neighborhood, the value is retained, otherwise it is set to zero. This procedure allow ad adaptive delimitation of interesting regions. At the end, a saliency map is defined by simply adding the contribution of each inhibited scale map. It is worth noting that the proposed saliency based segmentation allows the detection of a small subset of regions which are particularly significant on the mesh. We therefore switch between region to single point detection by simply introducing a nonmaximum procedure on each salient region: a point is detected if it is a local maximum where the neighbourhood of a point is adaptively defined by expanding the local region while new non-zero points are found (see Fig. 2) 1.2.2. Segmentation based on triangular patches This application starts from the approaches proposed originally in [SAPH04] and [KS04]. These two methods are quite c The Eurographics Association 2008. �
Castellani et al. / 3-SHIRT
115
2.1. Geometric descriptors
Figure 2: The saliency map shows small regions (left), from which interest points are isolated (right). The most significant parts of the subject are detected such as the eyes, the nostrils of the nose, the fingers of the paws. similar and both present an approach to segmentation that is aimed to partition two or more different meshes with the same scheme in order to morph them into each other. Since the segmentation is intended to be the first step towards the comparison and the recognition of similarities among meshes extracted from a database, we thought that this could be a good idea to start with. The application starts letting the user choosing feature points on the mesh, selected among the vertices. It then generates a coarse mesh with the feature points as vertices building the edges as the minimal path connecting them. The faces of this super-mesh are triangles by construction. The algorithm (a compromise between the starting two) is already implemented in OpenMesh [Ope] and, presently, the focus is on increasing the performance accelerating the Dijkstra based procedure used for searching the shortest path among the feature points.
This issue has been addressed by focusing on a new robust geometric point descriptor. We have propose a statistical learning on the 3D domain [CCFM08]. Each detected point is modelled by a Hidden Markov Model (HMM), which is trained in an unsupervised way by using contextual 3D neighborhood information, thus providing a robust and invariant point signature. The goal is to build a compact description able to summarize information related to interest points and to their neighborhood area. More in details, once a point has been detected, the main steps of our approach are: • Neighborhood data collection: we build a clockwise spiral pathway connecting vertices which lie at 1-ring distance, then at 2-ring distance and so on, until a fixed geodesic radius is reached. Along this pathway, we extract several local point information such as the maximal and minimal curvature, the normal displacement between the local point and the detected point, shape index, and so on. • HMM learning: at n−dimensional each entry of the spiral a n-dimensional Gaussian is fitted to quantized the data in few values occurring repeatedly along the spiral. For this reason, modelling the spiral as a stochastic process, in which the different entities are thought as discrete states, is a reasonable choice. The HMM model parameters are extracted by obtained a statistical signature.
1.2.3. Segmentation based on fuzzy clustering Another different approach to the mesh segmentation under investigation is based on [KT03] and [KLT05]. Using this method, once more under development inside OpenMesh [Ope], the user is able to segment, in a totally unsupervised mode, a mesh iteratively partitioning it, or a patch, in two parts, each of them representing the neighborhood of one of two representative faces, chosen by the algorithm driven by several parameters set by the user. The development is in its early stage and the results of this approach are expected later on. 2. Descriptors One of major challenges in the context of data retrieval is to elaborate a suitable canonical characterization of the entities to be indexed. In the literature, this characterization is referred to as a descriptor. Since the descriptor serves as a key for the search process, it decisively influences the performance of the search engine in terms of computational efficiency and relevance of the results. We propose three types of descriptors: geometric, geometric plus texture and aspectbased. c The Eurographics Association 2008. �
Figure 3: The Viterbi path of two HMMs built on two different-length spirals. For visual clarity, a state-identifying number is positioned on the area which exhibits mainly the presence of that state. Note that similar states lie in corresponding areas. In this way, the HMM gives a statistical encoding of the point and its neighborhood, taking into account for the uncertainty in the data. Actually, each HMM state captures a particular geometrical aspect particularly evident near the point. In practice, the expressivity of such a characterization is robust to 1) rotation 2) irregular sampling (for example, due to holes in the mesh) and 3) resolution variation of the mesh over which the interest point lies (see Fig. 3). Finally, by adopting this approach, the matching among the points are carried out by evaluating a pairwise similarity measure among HMMs in a maximum likelihood principle. In particular, if we consider the similarity measures as
116
Castellani et al. / 3-SHIRT
weights that characterize links between points, the above final matching can be formally cast as a maximum weighted matching problem (MWMP). Roughly speaking, in this case MWMP translates in selecting for each point of one model only one weighted link to another point on the other model, such that the summation of all the weights is maximal. 2.2. Geometry and texture descriptors We have addressed the development of 3D model descriptors that are able to exploit both the geometric information and the texture data. Spin-images are a well-known descriptor for 3D models [JH99]. This descriptor is itself based on the concept of spin-map. Let us consider an oriented point at a surface mesh vertex defined as the pair formed by the 3D vertex coordinates p and the surface normal n at the vertex. We can assign to each point x on the 3D surface its coordinates pair (α, β) with respect to the reference system (p, n) associated to an oriented point: radial coordinate α is the perpendicular distance to the line through the surface normal at the vertex point, elevation coordinate β is the signed perpendicular distance to the tangent plane defined by vertex normal and position. The record of the (α, β) coordinates of all the points of the 3D mesh is the “spin-map”. Formally the spin-map is defined as: ! SI(x) → (α, β) = ( "x−p"2 − (n · (x−p))2 , n · (x−p))
(1)
A spin-image is a spatially discretized version of a spinmap, where the gray values are associated to the count of points of the spin-map falling in each discrete cell or bin. 1
0.9
0.8
0.7
Precision
0.6
0.5
0.4
0.3
0.2
0.1
0
0
0.1
0.2
0.3
0.4
0.5 Recall
0.6
0.7
0.8
0.9
1
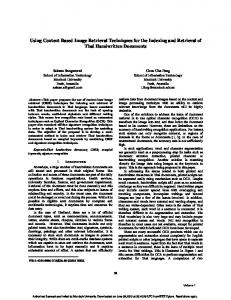
Figure 4: Left: Precision-recall plot for the retrieval on the Princeton Shape Benchmark database referring to the SpinImage technique (shape information only). Right: Example of spin-map taken from a vertex on the dog’s leg Spin-images have given satisfactory results in the retrieval of 3D models on the basis of their shape information (Fig. 4). The next step is the extension of this approach to the retrieval of textured 3D models. The first descriptor that we devised is inspired by a previous work on the registration of multiple 3D views [BAGC05]. We extended the concept of “spin-map” in the following way: Let I(x) denote the luminance value associated to the (R, G, B) chromatic values of the surface texture at x and let us quantize I(x) into L uniform gray level intervals li , i = 1, 2, ...L. The textured spin image is essentially the set of spin-images recording the (α, β) values associated
to each li gray level interval. A textured spin-map (TSI) with respect to an oriented point is the set of triplets determined by all the points x of the surface and their intensity I(x) in the following way: ! T SI(x) → (α, β, li ) = ( "x−p"2 − (n · (x−p))2 , n · (x−p), li ) (2)
A possible solution is to obtain the textured spin image from the textured spin map by accumulating in each bin just the number of (α, β) coordinates falling in it as in the case of standard spin-images. A better solution is instead to accumulate all the discrete gray level values li of the (α, β) coordinates falling in the bin. In this case a textured spin image is essentially the set of spin-images recording the (α, β) values associated to each li gray level interval, with an important difference with respect to the computation of spin-image: the bin value for each i = 1, 2, ...L is not the count of points of the spin-map falling in the bin as for the spin-images, but the sum of all the luminance values li falling in the bin. In that way, even a single-level TSI (L = 1) takes into account texture information. In principle, the larger is the number of intensity intervals L, the greater will be the texture information recorded by the textured spin-image. In practice we found that a sort of saturation takes place beyond L = 4. Another descriptor we experimented is a variation of Equation (2) which we called (R, G, B)-spin-image, given by the set of 3 spin-images, the first one recording the (α, β) coordinates associated with the R values, the second the (α, β) coordinates associated with the G values, and the third one the (α, β) coordinates associated with the B values. In the TSI case we obtain a set of spin-images for each considered sample (spin-vector), one for each quantization interval. During retrieval we perform PCA on the spinvectors and compare the more relevant eigen-vectors. At the moment the improvement obtained by including also texture data is still quite limited, the second year of the project will be spent on the study of other possible solutions for the inclusion of color information in the “spin-image” descriptor. This is linked also to a conceptual issue regarding how to consider the texture information in respect to the shape one, including if two models with the same shape and different texture should be considered similar.
2.3. Aspect-based descriptors The approach that we have explored [DNOV07c,DNOV07a, DNOV07b] aims at recognizing 3D objects of arbitrary complexity in real-world scenes, fully exploiting all the information available from video sequences. The approach that we follow is to adopt a view-based strategy and to describe the image content by means of local features: in order to reduce the information redundancy typical of image sequences and increase the robustness of the method to view-point variations, we mainly rely on features that are distinctive in space and stable w.r.t. view-point variations. c The Eurographics Association 2008. �
Castellani et al. / 3-SHIRT
117
3. Indexing and Matching The main objective of our work so far was to evaluate the use of statistical methods to improve effectiveness and efficiency of a classical retrieval system. In the next section we will briefly describe the preliminary studies and results. 3.1. T3.2 Statistical methods
Figure 6: Sample frames from the system output.
The method we have devised can be sketched as follows. We represent implicitly the 3D information from a video sequence by means of time-invariant features, i.e, local features that are distinctive in space and smooth and stable in time. To do so, we extract 2D scale-invariant local features (Harris corners in scale-space) from the images and track them along the video sequence by means of a Kalman filter, forming features trajectories. Dynamic filters, robust to temporary occlusions, allow us to deal with non convex objects, since, while rotating around a 3D object, selfocclusions may cause temporary interruptions in a trajectory. For a given trajectory we obtain a compact time-invariant feature by averaging descriptions for each keypoint belonging to the same trajectory. The overall procedure described so far is summarized in Figure 5 (left). In the training (modeling) phase we acquire a video sequence of an object of interest at a time, observing it in relatively controlled environments from different view-points — meaningful for recognition purposes. Figure 5 (right) shows a visual impression of the local regions of the video sequence that participate to modeling the object of interest. Observe that areas belonging to different time views are included. Also, the same part may appear more than once, if different views of it are important for recognition – in the figure Goofy’s left arm appears twice. In the test (recognition) phase a buffer of adjacent frames stored from a video stream is used to model the recently seen content of the observed scene of interest, similarly to training. Then the test model at time t is compared to the training models by means of a matching technique [DNOV07c] that exploits spatial and temporal coherence of time-invariant features: after computing a first set of robust matches with a simple NN strategy, the procedure is reinforced by analysing spatio-temporal neighborhoods and deleting isolated matches while adding weaker matches that are spatio-temporally close to robust ones. Finally, recognition is based on the matching procedure and it relies on an analysis of the recent content of the video which is compared with all the available models. c The Eurographics Association 2008. �
We propose a technique that is a combination of a classical retrieval methods with a classification approach typical of the learning from examples framework. We focus on the query by example (QBE) approach, very common on multimedia retrieval systems. In such a context, usually retrieval is based on the application of appropriate similarity measures between the example shape descriptor and all or some descriptors originated from the dataset. Therefore, most research in this direction focused on finding robust and discriminative shape descriptors. From the pattern recognition point of view, similarity matching is usually coupled with a nearest neighbour approach, that orders the available dataset according to the degree of similarity with respect to the shape used as a query. In this setting, the core problem is finding meaningful representations. It is easy to understand that this approach can suffer from the increase of the number of available shapes and in the case that the chosen descriptor is not discriminant enough the retrieval can easily fail. Here the use of an effective indexing method may be advantageous. We seek an alternative way to maintaining the retrieval efficiency and effectiveness as the database size grows. We investigate the appropriateness of using statistical learning tools for classification to improve retrieval performance. So far we have considered the well known SVM classifiers [CST00], but different regularized approaches could be applied as well. Let us assume that we have a dataset of labeled shapes divided in N classes. Then, given a test shape, we rank the output of the classifiers with a one vs all approach such that we obtain a sorted list of classes from the most to the least similar to the test shape. The idea that we pursue is to reduce the size of the dataset available, and therefore to save retrieval time, by using only shapes belonging to the k most similar classes to the test shape. We start off from a popular work proposed by Osada et al., based on statistical shape descriptors. We show how, with an appropriate use of the statistical learning tools we will, not only improve computational cost, but also improve the quality of retrieval. Following the work that we use as a reference in our experiments [OTCD02] we represent shapes by means of the socalled D2 descriptor, which is a measure of the distance between two random points on the surface. In [OTCD02] shape distributions of two different 3D models are compared with the L1 distance to obtain a dissimilarity measure. Thus, for a given test shape, its description is compared with all the descriptions available on the database, and the output returned by the retrieval system is a list of the n most similar shapes.
118
Castellani et al. / 3-SHIRT
Figure 5: Overview of our approach. Left: the construction of a time-invariant feature. Right: a visual representation of the local regions of the image sequence that participate to object modeling. Our variation of the original pipeline is to perform shape classification prior shape retrieval in order to reduce the size of the dataset of shapes to be analyzed. We evaluate the appropriateness of our choice in terms of nearest-neighbour performance, and retrieval indicators (we are currently using the so-called first tier and second tier). It is important to notice that our approach is flexible and can be implemented as a preprocess for many different kind of signatures or shape descriptions every time that an initial classification exists. The reminder of the section is devoted to present the dataset of shapes, the classification process and the retrieval procedure. 3.1.1. The dataset We are currently using the Princeton Shape Benchmark [SMKF04], or PSB, which is a publicly-available database of 3D models, containing 1814 polygonal models collected from the World Wide Web and classified by humans according to function and form. For our experiments we have used the PSB and the classes organization provided with the repository of shapes that splits the dataset in two parts: one for the training and another one for the test. The total number of shapes is 907 in both cases. According with the classification provided with the PSB, the dataset is split in 42 categories for training and 38 for test. It is important to notice that some of the training classes are not present in the test group of classes: moreover there are some of the categories which contains very few examples (less than 10) and there are some classes which contain very different objects. Indeed one of the main problem of the classification provided with the PSB is that some of the classes are clustered on a functional basis: this means they are grouped according with their use and not with their form of the 3D shape. Thus we considered subset of PSB classes, that fulfill re-
quirements of intra-class shape homogeneity and a threshold for cardinality. Table 1 shows the set of classes that we have chosen for our experiments with relative cardinality for the training and test sets that are used for classification procedure. Each training set contains the same number of positive and negative examples: the negative are randomly selected from all the other classes of shapes. Each test set contains the positive examples given by the PSB dataset and as negative examples we have chosen to use all the other 3D shapes belonging to the dataset. Class name Aircraft winged vehicle Plant Animal biped human Vehicle car Furniture table Furniture seat Body part head Liquid container Sea vessel Aircraft helicopter Display device Lamp Animal quadruped Furniture shelves Animal underwater creature Hat City Door
Training set Positive Negative 107 107 78 78 71 71 62 62 43 43 40 40 40 40 35 35 19 19 17 17 16 16 14 14 14 14 13 13 12 12 10 10 10 10 10 10
Test Set Positive Negative 135 772 60 847 78 829 51 856 35 872 37 870 38 869 24 883 26 881 18 889 24 883 8 899 17 890 13 894 23 884 6 901 10 897 18 889
Table 1: The set of classes that we have chosen for our experiments: each class is split in a training set and a test set which are exploited to train a SVM classifier.
3.1.2. Classification with SVM The preliminary experiments that we performed rely on the well known SVM classifiers. Once the dataset has been selected and labeled we train and tune a classifier for each of c The Eurographics Association 2008. �
119
Castellani et al. / 3-SHIRT Aircraft winged vehicle Plant Animal biped human Vehicle car Furniture table Furniture seat Body part head Liquid container Sea vessel Aircraft helicopter Display device Lamp Animal quadruped Furniture shelves Animal underwater creature Hat City Door
Training class cardinality 107 78 71 62 43 40 40 35 19 17 16 14 14 13 12 10 10 10
FT 0.52 0.26 0.49 0.36 0.29 0.25 0.37 0.17 0.28 0.15 0.11 0.5 0.16 0.11 0.11 0 0.1 0.06
ST 0.73 0.48 0.76 0.65 0.55 0.47 0.71 0.42 0.45 0.32 0.26 0.76 0.2 0.18 0.18 0.02 0.15 0.12
NN 0.63 0.45 0.74 0.47 0.31 0.43 0.5 0.25 0.46 0.56 0.17 0.75 0.35 0.15 0.04 0 0.3 0
Table 2: The results obtained for retrieval performed among the shapes of the classes selected with the classification tool described in Section 3.1.2. the classes: each training set is made of an equal number of positive and negative examples of the shapes, where the negative examples are extracted from all the other shapes of the dataset. As for the kernel choice, we are currently using the RBF Gaussian kernel, but other choices, including the design of appropriate kernels for a given shape descriptor, are possible. We tune the classifiers parameters (the regularization parameter c and the variance of the Gaussian kernel σ) with a leave-one-out approach. 3.1.3. Experimental results We conclude reporting some preliminary results that show how the retrieval quality increases when restricting retrieval to a subset of shapes, selected with shape classification. We compare the results with the ones obtained performing no classification — i.e., to the ones obtained with the original method by Osada. To evaluate the performances of the retrieval we use the well known evaluation methods proposed by previous works: First Tier : the percentage of models in the query’s class that appear within the top k matches where k is the size of the query’s class. Second Tier : the percentage of models in the query’s class that appear within the top 2k matches where k is the size of the query’s class. Nearest Neighbour : the percentage of closest matches that belong to the same class as the query. The results obtained for retrieval considering the selected number of class (four) are shown in Table 2. It is possible to notice that the performances of the retrieval drop down for those classes which have few shapes in the training set. It is possible to see that results are very different for different classes: those classes which have a more shapes for training classifier are retrieved better that other. c The Eurographics Association 2008. �
Our approach (first 4 classes) Osada (all classes)
1st Tier 33%
2nd Tier 55%
N.N. 47%
24%
39%
44%
Table 3: Comparison between applying or not a shape classification phase prior retrieval. Considering Table 2 it is apparent that our approach improve performances of retrieval. It is worth noticing that the training class cardinality and the intra-class similarity are fundamental for the performances of the retrieval: it is apparent that when the number of shapes drop down, also the first tier and the second tier decrease. With respect to the intra-class similarity, we have computed the L1 distance between all the shapes of each class and we have that, even if there is a high number of training shapes, the retrieval fails if the intra-class distance is high. 4. Evaluation We have built a test collection for the project and we have studied some important and foundational issues about evaluation: metrics and benchmarks. 4.1. Database of Textured 3D Models We added texture information to the models of the Princeton Shape Benchmark. This repository contains 1800 3D models and is one of the most used for the comparison of 3D retrieval systems. By adding texture information to it we obtained an effective way to compare the performance of descriptors using also color information with current state-ofthe-art systems. We also collected the 3D models available to our research group from previous and current research activity in an additional database. This database is particularly interesting because it contains also some high quality 3D models with complex geometry while most 3D models available in the free collections are rather simple. 4.2. Evaluation: Metrics and Benchmarks We analyzed the data provided by TREC test collection, the most used benchmark in the information retrieval community. We studied: • if it is possible to obtain correct and reliable results using less data (fewer topics, i.e., fewer test queries). The result is that, potentially, we could get the same evaluation results with just 10% of the topics, although it is not yet clear if these topics can be found a priori (before the evaluation takes place) and how to find them [GMR08]. • which topics are more informative. The results are still preliminary, but we have a strong indication that the current evaluation procedures concentrate too much on those topics for which most systems feature good performances, whereas the systems that have good performances on the
120
Castellani et al. / 3-SHIRT
most “difficult” topics are not rewarded enough [MR07]. Moreover, we have suggested to take inspiration from students assessment, rewarding the systems that perform well on difficult topics and punishing the systems that perform badly on easy topics [Miz08].
[GMR08] G UIVER J., M IZZARO S., ROBERTSON S.: A few good topics: Experiments in topic set reduction for retrieval evaluation, 2008. Submitted. 7
We have also continued some research on information retrieval effectiveness metrics. We are studying and categorizing the more than 80 metrics that have been proposed in the information retrieval field [DKM08].
[IKN98] I TTI L., KOCH C., N IEBUR E.: A model of saliencybased visual attention for rapid scene analysis. IEET Trans. Patt. Anal. Mac. Int. 20, 11 (1998). 2
These results will be taken into account during the evaluation phase of the 3-SHIRT project. Acknowledgments. The 3-SHIRT project is funded by PRIN 2006.
[JH99] J OHNSON A., H EBERT M.: Using spin images for efficient object recognition in cluttered 3D scenes. IEET Trans. Patt. Anal. Mac. Int. 21, 5 (May 1999), 433 – 449. 4 [KLT05] K ATZ S., L EIFMAN G., TAL A.: Mesh segmentation using feature point and core extraction. The Vis. Comp. 21, 8-10 (2005), 649–658. 3 [KS04] K RAEVOY V., S HEFFER A.: Cross-parameterization and compatible remeshing of 3D models. ACM Trans. Graph. 23, 3 (August 2004), 861–869. 2
References [3D a] 3D model retrieval http://3d.csie.ntu.edu.tw/dynamic. 1
system.
[3D b] 3D Model Similarity Search http://merkur01.inf.unikonstanz.de/cccc. 1
Engine.
[3D c] 1
[GS99] G AGVANI N., S ILVER D.: Parameter-controlled volume thinning. Graph. Mod. Im. Proc. 61, 3 (May 1999), 149–164. 2
3D shape retrieval. http://www.cs.uu.nl/centers/3dmatching.html.
[BAGC05] B RUSCO N., A NDREETTO M., G IORGI A., C ORTE LAZZO G. M.: 3D registration by textured spin-images. In Proc. 3DIM (Washington, DC, USA, 2005), IEEE Computer Society, pp. 262–269. 4 [CCFM08] C ASTELLANI U., C RISTANI M., FANTONI S., M URINO V.: Sparse points matching by combining 3D mesh saliency with statistical descriptors. Comp. Graph. Forum 27, 2 (April 2008). 2, 3 [CSM07] C ORNEA N. D., S ILVER D., M IN P.: Curve-skeleton properties, applications, and algorithms. IEEE Trans. Vis. Comp. Graph. 13, 3 (May/June 2007), 530–548. 2 [CST00] C RISTIANINI N., S HAWE -TAYLOR J.: An Introduction to Support Vector Machines and other kernel-based learning methods. Cambridge University Press, 2000. 5 [DKM08] D EMARTINI G., K AZAI G., M IZZARO S.: A survey and classification of information retrieval effectiveness metrics, 2008. Manuscript for submission. 8 [DNOV07a] D ELPONTE E., N OCETI N., O DONE F., V ERRI A.: Appearance-based 3D object recognition with time-invariant features. In IEEE Int. Conf. on Image Analysis and Processing (2007). 4 [DNOV07b] D ELPONTE E., N OCETI N., O DONE F., V ERRI A.: The importance of continuous views for real-time 3D object recognition. In Workshop on 3D Representation for Recognition (3dRR-07) (2007). 4
[KT03] K ATZ S., TAL A.: Hierarchical mesh decomposition using fuzzy clustering and cuts. ACM Trans. Graph. 22, 3 (July 2003), 954–961. 3 [Miz08] M IZZARO S.: The Good, the Bad, the Difficult, and the Easy: Something Wrong with Information Retrieval Evaluation? In ECIR 2008 (Glasgow, UK, 2008), pp. 642–646. 8 [MKF04] M IN P., K AZHDAN M. M., F UNKHOUSER T. A.: A Comparison of Text and Shape Matching for Retrieval of Online 3D Models. In ECDL (2004), pp. 209–220. 1 [MR07] M IZZARO S., ROBERTSON S.: HITS Hits TREC - Exploring IR Evaluation Results with Network Analysis. In SIGIR 2007: Proc. Int. Conf. on Research and Development in Information Retrieval (Amsterdam, The Netherlands, 2007), pp. 479– 486. 8 [Ogd]
Ogden IV. http://www.nime.ac.jp/motofumi/ogden. 1
[Ope]
Open mesh. http://www.openmesh.org/. 2, 3
[OTCD02] O SADA R., T.F UNKHOUSER , C HAZELLE B., D OBKIN D.: Shape distribution. ACM Trans. Graph. (2002). 5 [Rem01] State-of-the-art in content-based image and video retrieval, 2001. Dagstuhl Seminar, 5-10 December 1999, Deventer, NL. 1 [SAPH04] S CHREINER J., A SIRVATHAM A., P RAUN E., H OPPE H.: Inter-surface mapping. ACM Trans. Graph. 23, 3 (August 2004), 870–877. 2 [SMKF04] S HILANE P., M IN P., K AZHDAN M., F UNKHOSER T.: The Princeton Shape Benchmark. Tech. rep., Department of Computer Science, Princeton UNiversity, 2004. 6 [TV04] TANGELDER J. W. H., V ELTKAMP R. C.: A survey of content based 3D shape retrieval methods. In Proc. SMI (2004), pp. 145–156. 1
[DNOV07c] D ELPONTE E., N OCETI N., O DONE F., V ERRI A.: Spatio-temporal constraints for matching view-based descriptions of 3D objects. In Proc. Int. Work. on Image Analysis for Multimedia Interactive Services (2007). 4, 5 [FMK∗ 03] F UNKHOUSER T., M IN P., K AZHDAN M., C HEN J., H ALDERMAN A., D OBKIN D.: A search engine for 3D models. ACM Trans. Graph. 22 (January 2003), 83BV–105. 1 c The Eurographics Association 2008. �