cell dependencies, and a similar example is found in Chan's work [5]. However, these ... ftp://wilma.cs.brown.edu/pub/papers/compgeo/ gdbiblio.tex.Z, 1994.
3D Interactive Visualization for Inter-Cell Dependencies of Spreadsheets Hidekazu Shiozawa Ken-ichi Okada Yutaka Matsushita Department of Information and Computer Science, Keio University 3-14-1 Hiyoshi, Kohoku-ku, Yokohama, 223-8522 Japan Email: {shiozawa, okada, on}@mos.ics.keio.ac.jp
Abstract This paper proposes a new technique to visualize dependencies among cells in a spreadsheet. In this way, the system firstly visualizes a spreadsheet on a plane in threedimensional space, and draws arcs between interrelated cells. By allowing a user to select an arbitrary cell and lift it up with direct manipulation, the system utilizes the third dimension to ameliorate visual occlusion of crossing arcs. As the user lifts a focused cell up, the interrelated cells are lifted up together; thus hidden dataflow networks can be visually intelligible interactively. Because spreadsheets are aimed at calculation itself rather than appearances of outputs, their mechanism is relatively invisible and not obvious for ordinary users. Our visualization helps such users to understand structures and mechanism of spreadsheets. Keywords: information visualization, 3D user interfaces, spreadsheets, inter-cell dependencies, lifting-up operation, Natto View
1. Introduction Spreadsheets are indispensable application software in our everyday work. They help users calculate numbers that are interrelated such as balance sheets. A spreadsheet is organized as a matrix of cells arranged in rows and columns, and the value of a cell can be computed automatically as a function of the values of other cells. In addition, spreadsheet is considered one of the most popular programming interfaces. The metaphor of a financial spreadsheet is simple but enough powerful for practical calculation. Calculation processes are automatically ordered by their dependencies, so, unlike programming languages, users are usually not bothered by such calculation procedures. However, many people hardly utilize even the basic features. Although ordinary people might use various commercial templates, they are not good at programming their own sheets. Indeed, you can find office workers who add numbers with pocket calculators and enter the only results into
spreadsheets on their computers. As a reason of this, spreadsheets are relatively invisible software among office applications. Word processors and presentation tools are aimed at appearances of output information, but spreadsheets are aimed at calculation itself rather than appearances. So the processing outlines are not obvious for ordinary users. Therefore, visualizing dependencies of spreadsheet cells is helpful for users to intuitively understand the mechanism. Furthermore it will make the programming and debugging of spreadsheets much easier work. When users become able to see and learn dependencies of their sheets, they will understand the true benefit of spreadsheets and might take away their packet calculators. In this paper, we propose a new visualization technique for inter-cell dependencies of spreadsheets in threedimensional computer graphics. The visualization features the interactive lifting-up operation. Because an appearance of a spreadsheet is a two-dimensional table, the third dimension is remaining and can be utilized for displaying additional information such as dependencies.
2. The Basic Idea 2.1. Numbers, Formulae, and Dependencies In a spreadsheet, each cell can contain not only a number but also a formula for calculating the number. Although any conventional spreadsheet shows a single formula of a focused cell, this feature insufficiently useful for users to understand and program entire spreadsheet structures. Certain software can show also formulae of all cells simultaneously. However, such operation is often little intuitive and screens are too small to display all of the formulae. Furthermore, formulae derive the also invisible information of inter-cell dependencies. Each single formula can tell users what cells it is affected from, but cannot tell what cells it affects to. The latter is sometimes more important than the former, for example debugging existing sheets. Thus, even skillful users might not comprehend such dependencies intuitively.
2.2. Implicit Graph of Dependencies
3. 3D Spreadsheet Visualization
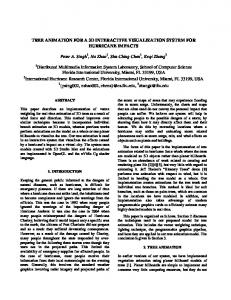
Inter-cell dependencies of spreadsheets can be represented as directed graph structures, so they may be drawn in graphical diagrams such as simple network diagrams. Indeed, certain software can draw inter-cell dependencies as arrows between cells on spreadsheets [5, 11]. Figure 1 depicts an example of such dependency visualization. To visualize graphs, many techniques have been already proposed [1]. Those techniques optimize layouts of nodes and arcs on two-dimensional planes, for example physical spring models. However, we should not use such graph visualization techniques as they are, because those visualizations yield new diagrams with much different appearances from original spreadsheets, and such diagrams are not helpful for ordinary users. Thus, we propose a three-dimensional visualization with interactive techniques to show graphs of spreadsheet structures. Although visualizations based on two-dimensional diagrams cannot maintain two-dimensional layouts of information, now, we can utilize the remaining third dimension for the same purpose. Moreover, researching into more techniques for interactive analysis is required in threedimensional information visualization [7].
3.1. Dependency Visualization
2.3. The Natto View Before describing our spreadsheet visualization, let us introduce the Natto View visualization system [14, 13], an interactive WWW space visualizer. The Natto View features the lifting-up operation to ameliorate visual occlusion of even ill arranged graphs. As a user lifts a focused node up, the nodes to which it links are lifted up together, thus complex networks can be untangled interactively. The lifting-up operation spatially separates related information from others without concerning initial information layouts. Therefore, the lifting-up operation provides both layout independence and spatial reflection of information relationship, though these two have been considered contrasting features. The Natto View proposes effective utilization of the third dimension: drawing diagrams in two dimensions and reminding the third dimension for interactive manipulation. We think this conception has a possibility of enhance many traditional charts and diagrams in two dimensions.
12.0
34.4
416.2
153.3
55.0
641.0
145.0
62.4
52.1
62.5
72.6
55.4
257.1
385.0
212.8
541.2
72.0
40.2
13.5
402.0
Figure 1. The conventional visualization.
We propose a set of techniques Spreadsheet Natto View that draws a spreadsheet in three-dimensional space and utilizes generated space above the sheet. In this way, two-dimensional cell coordinates are maintained always the same layouts as two-dimensional spreadsheets, and each cell now can have a new parameter of height. The system initially draws a spreadsheet on a plane in three-dimensional graphics and shows each dependency as an arc in form of an arch bridging between a referring cell and the corresponding referred cell. Each arch is drawn in color with gradation signifying its direction instead of an arrowhead. Each arch is also drawn in translucent to reduce visual occlusion caused by crossing arcs.
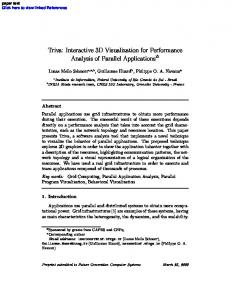
3.2. Interactive Lifting-up Operation The lifting-up operation is the most characteristic feature of interactive visualization systems. As the user lifts a focused cell up, its related cells are lifted up together; thus complicated dataflow networks are untangled dynamically. Figure 2 illustrates how the lifting-up operation is effective to view over and investigate the information structures. Users can interactively construct the customized views of inter-cell dependencies from various desirable viewpoints. Explaining in the algorithm, if a cell is lifted up to level , its related cells are lifted up to level and others related by following ones are to , and then this process is continued repeatedly until cells in level . The number of lifting steps is theoretically unlimited. In this way, the third dimension or -axis is given a role of indicating cell’s degree of interest (DOI), that is, the more interesting the cell is, the higher it is placed and thus the more visible its neighbors are. When users want to know detailed information around the focused cells, they may pick and lift the cells up higher and higher, then the information nearby the first cells becomes very intelligible. This appropriate semantic for the third dimension offers users less confusion than arbitrary three-dimensional operations. The system provides three different lifting-up operations according to three different inter-cell relationships: referring (back-flow), referred (flow) and both. In case of the referring mode, when a user lift a cell up, the cells that it refers are lifted up together, that is, lifting-up processes are traversed in a back-flow order. On the other hand, in the referred mode, or flow mode, the cells that are referred by the focused cell are lifted up together.
����
���� �
3.3. Dataflow Diagrams above Spreadsheet Tables The three-dimensional visualization also enables drawing formulae nearby the corresponding cells. The system
Figure 2. The lifting-up operation: In this example, as the user lifts the cell H14 up successively, the cell H13 on which H14 depends follows, and so on.
draws formulae nearly beneath the corresponding cells as long as the cells are lifted up, for lifted cells are considered interesting for users. Therefore users can select which cells draw formulae according to their relationships. This method brings less visual occlusion than two-dimensional display, which do not provided such semantic selection of viewable formulae. Viewing the same visualization from side, users can see a kind of dataflow diagrams concerning interesting cells, so users can easier understand spreadsheet dataflow than parallel display of the original spreadsheets and different dataflow diagrams (Figure 3). In addition, if the system finds any formulae that refer to blank cells, it warns users of illegal references with changing their colors (Color Plate).
3.4. Platform and Utilized Software We have developed the system by much modifying slsc, a free spreadsheet software for UNIX, with using OpenGL API for three-dimensional graphics. In the current prototype, when a user input data into the original text-based slsc
interface, the system synchronously refresh also the additional three-dimensional view.
4. Related Work 4.1. Spreadsheet Visualizations Microsoft Excel [11] can draw arrows according intercell dependencies, and a similar example is found in Chan’s work [5]. However, these techniques have fundamental problems of graph drawing as described in Section 2.2. Igarashi and others have applied a concept of Fluid User Interfaces [8] to visualize spreadsheet structures with dataflow animation and mouse-pointer-aware indication. Although their techniques are innovative and suitable for some auditing, they do not support static visualization of dataflow diagrams and display of formulae themselves. At least one three-dimensional spreadsheet Storeys [12] is released as a commercial product. Storeys features the three-dimensional data structure in row, column, and layer
users with sufficient visibility of inter-cell dependencies of spreadsheets in order to cope with users’ insufficient comprehension and little confusion of the spreadsheet functions. By utilizing the visual variable of height instead of size, the lifting-up operation enables both to maintain original matrix layout and to control views according to users’ degrees of interest. Thus, our spreadsheet visualization suggests that the lifting-up operation can re-visualize existing two-dimensional visualizations more intelligible with less occlusion. Figure 3. Users can investigate dependencies between even distant cells. coordinates. It does not support real three-dimensional graphics and visualization of inter-cell dependencies. There also exist some researches on new applications of the spreadsheet principles [6, 9], though these techniques do not intend to augment basic spreadsheet interfaces.
4.2. 3D Visualizations and Interaction Many three-dimensional information [3, 10] provide focus+context strategy with the perspective technique for users to approach their interesting data in information space. However, the perspective projection should keep a view compatible with the natural human sense, so it is difficult to freely control visual sizes of information like twodimensional nonlinear zooming techniques. We have proposed the way that uses the visual variable of position, or height. Because height is quantitative and such operation causes no disappearance of nodes, users can control node heights roughly in proportion to their interest. James Wen has pointed out us that he proposed the almost same idea to the lifting-up operation in 1992, and implemented a simple prototype of a graph visualization system [15]. He presented the basic principles whereby threedimensional graphics is used to extend two-dimensional graphics in an orthogonal manner thereby opening up a new channel of information. Carpendale and others exploited the three-dimensional pliable surfaces [4] to construct flexible distortion-based visualization in two dimensions. In VR-VIBE [2], Benford and others proposed a kind of picking or stretching operation in three dimensions. Users can explore the results of applying several simultaneous queries to a corpus of documents in a triangular pyramid.
5. Conclusion In this paper, we have presented a new set of threedimensional techniques for spreadsheet visualization featuring the interactive lifting-up operation. This provides
References [1] G. D. Battista, P. Eades, R. Tamassia, and I. G. Tollis. Algorithms for drawing graphs: An annotated bibliography. ftp://wilma.cs.brown.edu/pub/papers/compgeo/ gdbiblio.tex.Z, 1994. [2] S. D. Benford, D. N. Snowdon, C. M. Greenhalgh, R. J. Ingram, I. Knox, and C. C. Brown. VR-VIBE: A virtual environment for co-operative information retrieval. In Proc. Eurographics’95, pages 349–360, Sept. 1995. [3] S. K. Card, J. D. Mackinlay, and B. Shneiderman. Readings in Information Visualization – Using Vision to Think. Morgan Kaufmann, 1999. [4] M. S. T. Carpendale, D. J. Cowperthwaite, and F. D. Fracchia. 3-dimensional pliable surfaces: For the effective presentation of visual information. In Proc.ACM UIST’95, pages 217–226, Nov. 1995. [5] H. C. Chan. Spreadsheet visualization. http:// www.comp.nus.edu.sg/˜chanhc/spreadsheet/, Oct. 1998. [6] E. H. Chi, P. Barry, J. Riedl, and J. Konstan. A spreadsheet approach to information visualization. In Proc.IEEE InfoVis’97, Oct. 1997. [7] M. C. Chuah, S. F. Roth, J. Mattis, and J. Kolojejchick. SDM: selective dynamic manipulation of visualizations. In Proc.ACM UIST’95, pages 61–70, Nov. 1995. [8] T. Igarashi, J. D. Mackinlay, B. Chang, and P. T. Zellweger. Fluid visualization for spreadsheet structures. In Proc.IEEE Visual Languages’98, pages 118–125, 1998. [9] M. Levoy. Spreadsheets for images. In Proc.ACM SIGGRAPH’94, pages 139–146, 1994. [10] J. D. Mackinlay, G. G. Robertson, and S. K. Card. The Perspective Wall: Detail and context smoothly integrated. In Proc.ACM CHI’91, pages 173–179, Apr. 1991. [11] Microsoft Corporation. Excel. http://www.microsoft.com/. [12] ProFunda. Stroreys. http://www.profunda.dk/ spreadsheet_storeys/, 1998. [13] H. Shiozawa and Y. Matsushita. WWW visualization giving meanings to interactive manipulations. In HCI International ’97, pages 791–794, Aug. 1997. http://www.mos.ics.keio.ac.jp/NattoView/. [14] H. Shiozawa, H. Nishiyama, T. Soma, and Y. Matsushita. Visualization of WWW space from the viewpoint of information connection and multiuser access. IPSJ SIG Notes 96-GW-18, pages 61–66, 1996. (In Japanese). [15] J. Wen. Exploiting orthogonality in three dimensional graphics for visualizing abstract data. Technical report, Brown University, CS92-M16, May 1992.
Figure 4. Color Plate: The lifting-up operation and warning of deadlinks