Daniel F. Keefe et al. [13] proposes ..... Mike Eissele, Daniel Weiskopf, and Thomas Ertl, 2009. ... [13] Daniel F. Keefe, Marcus Ewert, William Ribarsky and.
MPGI National Multi Conference 2012 (MPGINMC-2012)
7-8 April, 2012
“Recent Trends in Computing”
Proceedings published by International Journal of Computer Applications® (IJCA)ISSN: 0975 - 8887
An Interactive Approach for Local and Remote 3D Visualization on Mobile Devices U. S. Junghare
R. V. Dharaskar
Brijlal Biyani Science College
V. M. Thakare S S. Sherekar
Amravati, MS. India
SGB Amravati University
MS. India
M.P.G.I., Nanded
ABSTRACT
2.2 Remote visualization
An interactive approach plays a vital role in 3D visualization. But to bring the interactive approach and their techniques on mobile device is not an easy task due to the limitations of mobile devices. But by considering the plus points of different properties of mobile devices i.e. network speed etc. it is possible to perform interactive visualization on mobile devices. This can be performed locally on mobile devices by considering local storage and can apply on remote concept by in view of mobile as client and server as storage. In this paper focus is given on various interactive techniques for local and remote visualization on mobile devices. Also discuss novel framework for 3D visualization on mobile devices.
In some situations data may come from remote side i.e. form server side and then it views on mobile devices, it is remote visualization.
Keywords Interactive techniques, local and remote approach, 3D visualization, mobile devices
1. INTRODUCTION Now day’s mobile devices are significant enough to handle large amount of data but still 3D visualization on mobile is challenging task due to the low resolution and small screen of mobile as compare to PCs. Also mobile devices have a capability like relatively small amount of memory, low computation power and low bandwidth performance throughout the system. As they are mobile devices so they have wireless network connectivity with varied ranges like low, middle and long. Large and complex data visualization on mobile device can performed by means of two approaches i.e. local and remote visualization approach. Interactive approach is applicable in both local and remote visualization. Interactive visualization act upon human interaction with computer or mobile devices and performs illustrations of information. In other way interactive visualization can refer as real time task. Here the discussion is on various interactive visualization techniques those are approachable to mobile devices.
2. LOCAL AND REMOTE VISUALIZATION APPROACH Large and complex data visualization on mobile device can performed by means of two approaches i.e. local and remote visualization approach.
2.1 Local visualization When the whole data is store on mobile device and then such data is visualized on mobile screen by means of some techniques, such kind of visualization is a local visualization.
For local visualization mobile devices must have large storage capacity while in remote visualization mobile devices can considered with given capability [15].
3. COMMONLY APPLICABLE DATA FOR INTERACTIVE VISUALIZATION Stompel et al. [1] proposed the visualization of multidimensional, multivariate volume data using various interactive illustrative techniques, after some period these techniques had been enhanced to support multi-field and timevarying data visualization. Jingshu Huang et al. [2] allows users to view interior structures of 3D models, display the annotations of parts, and visualize instructions, such as assembly and disassembly procedures for mechanical models using interactive illustration techniques. Multi field visualization using shapes and colors is applicable to identify split area. Interaction and illustration are effective during exploration which expresses meaningful feature objects [3]. In [4] author provides coordinated graph visualization (CGV) system whose main stress is on interaction and history mechanism for undo and redo of interaction. CGV can also be used to estimate clustering result, to navigate to neuronal system and to perform analysis of time varying graphs. Author [5] presents the multimodal user interface for the older users. In this users can select combination of modalities which satisfies their needs and capabilities. Here authors does the experiment that multimodal interfaces with touch, speech and motion control being superior to interaction with single modalities in mobile device. Interactive 3D visualization of outdoor environment can be useful to hold public consultation activity. Two visualization techniques has been compare those are interactive 3D visualization and static visualization [6]. It is possible to visualize image data interactively at client side from server at remote side. Server is a web server which provides images to client on its demand [7]. Authors [8] developed a general architecture for the visualization and navigation through 3D views on mobile devices by developing 3D museum applications in which various mobile clients can interact with each others. To visualize context gloss data on mobile interactive visualization method is available with client server approach. In this approach a heterogeneous mobile are connected with server and optimizes wireless transmitted data. Data comes from various sources are process at client side using appropriate technique [9]. For the navigation of large maps, social networks, long documents etc. requires zooming or pan strategy. But if there are a number of distant objects to study and compare then this
28
MPGI National Multi Conference 2012 (MPGINMC-2012)
7-8 April, 2012
“Recent Trends in Computing”
Proceedings published by International Journal of Computer Applications® (IJCA)ISSN: 0975 - 8887 strategy is not effective. Therefore authors [10] provide space folding distortion technique which folds mediating space for the visualization of multiple focus regions. Interactive navigation in large workspaces and also interact through different types of data like iso-surface geometry, volumetric, and image data etc. [11, 12]. Daniel F. Keefe et al. [13] proposes interactive technique to visualize complex 3D motion data. This interactive structure discovers relationship in high resolution biomechanical data set in time space and form function manner. Ambient intelligent environment can access by implementing, and evaluating a 3D-based user interface. With the help of 3D visualization and 3D UI a logical link has been created between physical devices and performs virtual representation on mobile devices [14]. Interactive rendering system has been proposed for direct lighting in dynamic senses with cosine lobes which can be generalized to visibility. It also shows the integration of cosine lobes product. A cosine lobe is one of the functions which reduce number of coefficients needed for any spherical radial basis functions (SRBF) [19]. Pietro Zanuttigh et al. proposed 3D framework for interactive browsing. It provides dynamic view of geometry and render image based on rate distortion principle and also proposed client sever approach based on band limited channel [20]. Jonathan Palacios et al. provide a texture based algorithm which provides an interactive representation of rotational symmetry fields on surfaces [18].
4. INTERACTIVE VISUALIZATION TECHNIQUES 4.1 Interactive and Illustrative multi field visualization Illustration makes a feature objects meaningful to identify during searching. Interactivity enables interrelated exploration. In interactive illustration system number of operation are performed such as preprocessing, selection, abstraction, generalization and filtering. Main goal of illustrative exploration approach is to take out similarity based feature objects from the data. Using similarity measures those points from the multi field are defined which are similar to the user defined point on the basis of user selected threshold. Here in [3] similarity is concert with feature space of multi field and for its representation similarity matrix is defined. Distance inside feature space is nothing but similarity. To give user control and modification based on example of similarity measures, original feature space is transformed using projection and scaling. To measure the distance in transformed space, p-norm is used as follows which also sets the application simple and attractive: N
d(a,b) = (∑ |ai-bi|p)1/p i=0
Here N is a set of point in feature space of N dimensions; value of all attributes of multi field is store in feature vector ‘a’ and ‘b’. These two feature vector are two points that are being compared after feature space transformation. ‘p’ is a parameter, its value is either 1 or grater than 1, which indicates the change in type of norm. Usually p=2 for Euclidean norm. After generation of similarity measures feature objects are extracted this process is called as filtering.For the illustrative visualization sparse style is used which gives insight into data
with sufficient details. This visualization style is move from schematic drawing. Stef Busking et al. developed technique using OpenGL in C++. Due to the interactivity authors test the performance for several dataset and find suitable presentation. Data sets are rendered on 600x600 resolution having average frame rates approximately 12 frames per second.
4.2 Coordinated graph visualization Christian Tominski et al. [4] mentions various coordinated and uncoordinated interaction like zooming, panning and fisheye magnification, identify locate, lock/unlock, brushing expand or collapse etc. Filtering is used to dynamically filter out irrelevant node. CGV can create composite filtering by combining elementary filter. If object follow all conditions then logical AND is used to generate filter otherwise logical OR is used. Visual interfacing is also possible in CGV. Graph leans are use to neat up clutter layout region and to generate local overview in graph.
4.3 Multimodal Interaction Touch modality generated graphical (visual) output; speech generates graphical and auditive (speech and sound) output while motion generates graphical and tactile output. Interaction mostly include navigation between menu option, messages etc. Each modality like touch, speech, motion also includes navigation by various means. It has been found that multimodal and touch modality conditions are more successful than motion and speech [5].
4.4 Interactive 3D visualization In interactive visualization two inputs speech and text are taken for remarking on symbolized environment. 3D model of redevelopment of the park was created in which existing object of park are based on modeled photo and new objects are based on discussion. Generally at the walking speed the navigation speed becomes restricted or slow but the interactive 3D visualization makes the navigation smooth during virtual park rather than stepping through a series of stills. A comment facility is included by [6] application that accept spoken and type comments. Static visualization provides spatial alertness, orientation, scales etc but it has some drawbacks. Static visualization does not provide 3D look so detail visualization is difficult. Static makes the planed complicated due to small size by cluttering. It doesn’t show the reality and it has restricted movement in the represented environment. In doesn’t provides interaction.
4.5 Interactive Context Aware visualization As the data is context aware therefore rapid changes occurs in their attributes. The data is used from augmented world schema (AWS) in XML description which contains various attributes, Meta data, their relations etc. Schema definition is then used to find sufficient visualization methods. Mike Eissele et al. [9] propose catching, preprocessing and matching techniques for interactive context aware visualization.
4.5.1 Catching and preprocessing concept Heterogeneous clients that connect with server are not of sufficient memory, computation power, and network bandwidth. Therefore it supports processing based on catching and preprocessing concept. Server acts as communicator to
29
MPGI National Multi Conference 2012 (MPGINMC-2012)
7-8 April, 2012
“Recent Trends in Computing”
Proceedings published by International Journal of Computer Applications® (IJCA)ISSN: 0975 - 8887 optimize transmitted data. Hierarchical data description in XML schema is responsible for the appropriate visualization methods. Preprocessing is used to execute selected template function which is based on context and send optimized visualization data to client.
4.5.2 Matching technique Matching technique is also based on XML schema so it is XML schema matching. Every element of the object steam is tube into matching process to visualize their demanded data type. Schema contains selected i.e. basic data types and visualization for this is also basic. So the quality and usability of result is only on selected visualization.
4.6 Image Tilling, Multi-resolution streaming, zoom and rotation Photographs or images are accepted by system as input. These images are preprocessed by an encoder to produce new subdivided (tile) multi resolution images. All streaming and encoding information is store into map and catalog files produce by encoder [7]. This is done at server side. Tile images visualized at client side with the help of view operations like zoom, rotations etc. Client also supports multi threaded pull model for multiple tiles.
4.7 Model View Controller The developed architecture is based on Model View Controller which consist of views like local and remote, device controller and M3G. M3G controls data and performance of the 3D graphical object. Views are M3G models observers so each view registers with M3G model. M3G model also check and responds on the collision of graphical objects. Graphics are mapped on device display with help of local and remote views. Remote view is responsible to render on remote mobile devices. Device controller act as interpreter between mobile devices and 3G model so that device users can interact with applications. Communication layer acts as data communicator with server. Once the connection is established server receive images from other devices in the ad hoc network and sends it to current mobile device. Therefore navigation and interaction is occurs in between multiple mobile clients. Author developed architecture to deal with fault tolerant aspect. This architecture is tolerant to failure to communicate with server by allowing 3D scene to be loaded from nearer device [8].
4.8 Space folding\ Space distortion In space folding method fold shows contextual information and support unfolding and paging interaction. Folding technique is generally used for geometry spaces. This technique is also known as space deformation which folds 1D or 2D space into 3D. Visual exploration approach has some design goals such as guaranteed focus and context visibility, intervening context and distance awareness. All these goals are accomplished by the presented techniques like navigation, split screen, space and semantic distortion. Space deformation technique also supports all four design goals. Main design goal of this technique is to join different portion of visual space so the focus point and their surrounding context are visible on screen. Focus points on visual space have related depth parameter therefore it supports zooming. It also supports interaction which enables the different parts of visual space to view at different scale [10].
4.9 Focus plus Context 4.9.1 Lens based focus plus context Emmanuel Pietriga et al. [11] propose a new interaction visualization technique for independent data. Focus plus context is also one interaction technique, which allow visualization and navigation of information in large space without using zoom. Author proposed new focus plus context interaction technique based on lenses which provides navigation in large workspaces but it applicable to the large screen resolution devices.
4.9.2 Pinhole camera based focus plus context Voicu Popescu et al. [12] proposes a pin hole camera concept which plays an important role in remote visualization because it allows zoom in at client side without moving more data from remote side i.e. server. Pinhole camera is also useful in focus plus context visualization. Different types of data like iso-surface geometry, volumetric, and image data etc moreover supports by pinhole camera.
4.10 Interactive coordinated 3D view To support spatial data analysis 3D interactive visualization is required while it is also found that for information visualization of spatial data, 2D visualization is also effective. Therefore [13] integrates 2D and 3D visualization techniques like overview (multiple and coordinated), zoom and filter and detail on demand.
4.10.1 Multiple and coordinated overview A small multiple view of images is a snapshot of 3D visualization generated by 3D rendering engine and to produce grid of multiple view textures planed on small rectangle. This view can render with high frame rates. This small multiple view in overview visualization technique divides into parallel coordinates visualization and xy-plot. Parallel coordinated view has some line direct as frame of motion data. To highlights the frames and data values in xyplot brushing technique is used.
4.10.2 Filter and zoom Filter technique in zoom provides interaction between parallel coordinated plot, 2D xy-plot and new interactive 3D view. Filter data then visualize in the tracer with 3D view. Tracer also marks up the path of point.
4.10.3 Details on demand Counter trends are easily detectable by overlay style visualization but it undergo from visual clutter. Side by side comparison is helpful to provide detail view because it is less responsive to visual clutter but it requires more space and time for visualization.
4.11 Ambient control and The Dynamic User Interface Creator Ambient control (AMCo) is implemented in [14] which uses automatic created 3D visualization model of environment and also built integrated user interface at server side. This identifies new devices and also can access identified devices. AMCo also have windows icon menu and pointing to access video, music, slides documents and also provides drag and drop facility. On a mobile device the Interaction Appliance (IA) runs this makes available the AMCO client and the user interface. The Dynamic User Interface Creator (DUIC) has been implemented as a built-in component of the Environment Manager for the dynamic 3D-Visualization. Environment manager has so many functions like device access, dynamic
30
MPGI National Multi Conference 2012 (MPGINMC-2012)
7-8 April, 2012
“Recent Trends in Computing”
Proceedings published by International Journal of Computer Applications® (IJCA)ISSN: 0975 - 8887 user interface creation, and context retrieval, interaction synchronization etc. In case of DUIC environment manager illustrate the current position of environment with the help of XML file in 3D user interface. Interaction synchronization manages simultaneous access to the current environment.
4.12 Distance based culling Mobile device like PDA are not allow large 3D model at acceptable frame rates due to their limitation. Therefore author proposed two culling algorithms i.e. hierarchical frustum culling and portal culling for interaction of large 3D model of building on mobile device. Large 3D model is subdivided into cells and portals having Meta data in X3D file. Along with X3D file there is an external file to collect compact cells, portals with their boundaries i.e. preprocessing. But both approaches Meta data and external files do not support X3D standards. Therefore architecture is proposed by Mulloni et al. for visualization of large 3D model on mobile device which supports X3D player and cell manager. X3D player is the current adaptation of MobiX3D system used in [16] which is then improved by portal culling algorithm based on distance with and without using fogs in [17]. It is found that rendering speed or frames per seconds are more of 3D system without using fogs as compare to using fogs. As the numbers of cells or triangles are increases in 3D model then number of frame rates per seconds reduces.
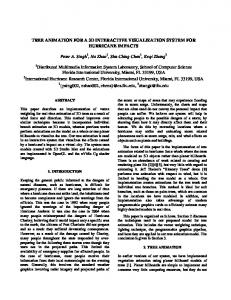
5. FRAMEWORK OF PROPOSED SYSTEM
between server and mobile client. In proposed visualization system,
Desktop application provides GUI
Connection occurs in between desktop source and server.
Image Data model transfers to server and store at particular location.
Server transfers image to mobile platforms on its request using URL.
Image is visualized in 3D form on mobile screen.
6. ANALYSIS Following table shows the commonly applied data for interactive visualization using general interactive techniques. Table1. Common data and techniques Category of visualization
Commonly applied data
Mostly utilized techniques
Interactive visualization
Multi level data like
-Zooming, panning, focus plus context
-Hierarchical or tree based data,
-Filtering
(Local Remote)
and
-Map based data
Proposed visualization system uses remote approach having image streaming communication with wireless network. Therefore this system considers various parameters like network bandwidth, frame rate, time interval, transmission time and delay.
-Searching -Catching
Volumetric image data
-Preprocessing
Etc.
-Matching -Navigation
From the above given applications and their techniques it has been found that the interactive approach is applicable for both local and remote visualization on mobile devices. According to both local and remote visualization techniques various aspects are categories as following fig 2.
7. CONCLUSIONS
Fig1: processing flow of proposed visualization system. In the above processing flow initial sequence (SEQ) number is sent by local system to remote port then remote server sends the acknowledgment (ACK) number to local system and then connection occurs. In the same manner connection is done in
Previously only the desktop systems were capable to support interactive graphics but today mobile devices have the ability to support interactive visualization. This paper show that interactive approach can perform by considering all local resources of mobile devices and by allowing remote visualization using client server. Local interactive approach regards all local aspects like threshold, detail view, time, scaling etc. while remote visualization holds wireless network related aspects. Interactive visualization provides the detail view of large data on small screen. In this paper we also proposed novel framework for 3D visualization on various mobile platform using client server concept.
Visualization techniques with following approach
Local visualization approach Global visualization approach
Information, interactive visualization and rendering Common aspects: -Threshold
Remote, interactive and rendering visualization Common aspects: -Screen and image Resolution
31
MPGI National Multi Conference 2012 (MPGINMC-2012)
7-8 April, 2012
“Recent Trends in Computing”
Proceedings published by International Journal of Computer Applications® (IJCA)ISSN: 0975 - 8887 -Projection and Scaling
-Bandwidth
-Relevant feature and similarity measure
-Threshold
-Distance
-Frame rates
-Time
-Throughput
-Multidimensional data
-Fetch time
-Detail visualization
-Latency
-Rendering
- Fault tolerant
Etc.
-Pixel rates - Decoder, encoder Etc.
Fig. 2: Common aspects in local and remote interactive visualization on mobile devices.
8. FUTURE SCOPE More innovative and complex interactive techniques could be used for complex data such as medical area for brain dataset. In future more aspects can be considered for local and remote interactive visualization such as visualization quality, color intensity, security etc.
[11]
Emmanuel Pietriga, Olivier Bau, and Caroline Appert, May/Jun. 2010. Representation-Independent In-Place Magnification with Sigma Lenses, IEEE Transactions On Visualization And Computer Graphics, Vol. 16, No. 3, pp 455-467.
[12]
Voicu Popescu, Paul Rosen, Laura Arns, Xavier Tricoche, Chris Wyman, Christoph M. Hoffmann Sep./Oct. 2010. The General Pinhole Camera: Effective and Efficient Non uniform Sampling for Visualization, IEEE Transactions On Visualization And Computer Graphics, Vol. 16, No. 5, pp- 777-790.
[13]
Daniel F. Keefe, Marcus Ewert, William Ribarsky and Remo Chang, Nov/Dec 2009. Interactive coordinated multiple view visualization of biomechanical motion data, IEEE Transaction on Visualization and Computer Graphics, Vol. 15, No.6.
[14]
Ali Asghar Nazari Shirehjini , Shervin Shirmohammadi, 2009. A Mobile 3D User Interface for Interaction with Ambient Audio Visual Environments, IEEE International Workshop on Haptic Audio Visual Environments and Games, Lecco, pp 186-191.
[15]
Joachim Diepstraten, 2006. Interactive Visualization Methods for Mobile Device Applications, http://elib.unistuttgart.de/opus/volltexte/2006/2757/pdf/diss_diepstrate n_electronic_version.pdf.
[16]
Daniele Nadalutti, Luca Chittaro, 2006, Rendering of X3D Content on Mobile Devices with OpenGL ES, Proceedings of the eleventh international conference on 3D web technology Columbia, Maryland, pp 19-26.
[17]
Alessandro Mulloni, Daniele Nadalutti, Luca Chittaro, 2007. Interactive Walkthrough of Large 3D Models of Buildings on Mobile Devices, Web3D Italy, April 15–18, ACM 978-1-59593-652-3.
[18]
Jonathan Palacios and Eugene Zhang, July 2011. Interactive Visualization of Rotational Symmetry Fields on Surfaces, IEEE Transactions on Visualization And Computer Graphics, Vol. 17, No. 7, pp 947-955.
[19]
Sylvain Meunier, Romuald Perrot, Lilian Aveneau, Daniel Meneveaux, Djamchid Ghazanfarpour, 2010, Cosine lobes for interactive direct lighting in dynamic scenes”, Computers & Graphics, Vol. 34, pp 767–778.
[20]
Pietro Zanuttigh, Nicola Brusco, David Taubman, Guido Cortelazzo, June 2006. A novel framework for the interactive transmission of 3D scenes, Signal Processing: Image Communication, Vol. 21 pp- 787–811.
9. REFERENCE [1]
Stompel A, Lum EB, Ma K-L., 2002. Visualization of multidimensional, multivariate volume data using hardware-accelerated non-photorealistic rendering techniques, In: Proceedings of 10th pacific conference on computer graphics and applications, pp 394–402.
[2]
Jingshu Huang, Brian Bue Avin Pattath , David S. Ebert, Krystal Thomas, 2007. Interactive Illustrative rendering on mobile device, IEEE Computer Graphics And Applications, Vol.27, No. 3, pp 48-56.
[3]
Stef Busking, CharlP.Botha, FritsH.Post, 2010. Examplebased interactive illustration of multi-field datasets, Computers & Graphics 34, pp 719–728.
[4]
Christian Tominski, JamesAbello, HeidrunSchumann, 2009. CGV—An interactive graph visualization system, Computers & Graphics 33, pp-660–678.
[5]
Anja B. Naumann, Ina Wechsung, Jorn Hurtienne, 2010. Multimodal interaction: A suitable strategy for including older users?, Interacting with Computers 22, pp 465–474.
[6]
Paul van Schaik, 2010. Using interactive 3-D visualization for public consultation, Interacting with Computers 22, pp 556–568.
[7]
Jerry Chen, Limi Yoon, E. Wes Bethel, Mar./Apr. 2008. Interactive, Internet Delivery of Visualization Via Structure Prerendered Multiresolution Imagery, IEEE Transaction on Visualization And Computer Graphics, Vol. 14, No. 2, pp 302-312.
[8]
Maria Andréia F. Rodrigues, Rafael G. Barbosa, Nabor C. Mendonça, 2006. Interactive Mobile 3D Graphics for On-the-go Visualization and Walkthroughs, ACM.
[9]
Mike Eissele, Daniel Weiskopf, and Thomas Ertl, 2009. Interactive Context-Aware Visualization for Mobile Devices, Proceeding of the 10th international symposium on smart graphics, ISBN 978-3-642—02114-5.
[10]
Niklas Elmqvist, Yann Riche, Nathalie Henry-Riche, Jean-Daniel Fekete, May/Jun. 2010. Me´ lange: Space Folding for Visual Exploration, IEEE Transactions On Visualization And Computer Graphics, Vol. 16, No. 3, pp 468-483.
32