7
AN ADAPTIVE PEDESTAL CONTROL ALGORITHM FOR THE NATIONAL WEATHER RADAR TESTBED PHASED ARRAY RADAR 1
1
1
2
David Priegnitz , S. M. Torres and P. L. Heinselman Cooperative Institute for Mesoscale Meteorological Studies, the University of Oklahoma 2 NOAA/OAR National Severe Storms Laboratory, Norman, OK
1. INTRODUCTION The National Weather Radar Testbed (NWRT) Phased Array Radar (PAR), located in Norman Oklahoma, consists of a single antenna array capable of electronically scanning a 90-degree azimuthal sector at any given moment (Zrnic et al, 2007). The antenna is mounted on a pedestal which can be commanded to move in any azimuthal direction, allowing researchers to follow areas of interesting weather. Since operations began in 2004, numerous data sets have been collected and analyzed. Forsyth et al. 2011 provide a summary of data sets that were collected during 2010; typical of data sets collected in 2011 and in previous years. From an operator perspective, many enhancements have been made to the Radar Control Interface to simplify the data collection process (Priegnitz et al. 2006, Priegnitz and Forsyth 2007, Priegnitz et al. 2009). Adjusting the antenna position to follow a particular storm has been one of the more challenging operations during data collection. The actual process of commanding the antenna to a new position is fairly straight forward. However, determining the most optimal antenna position can be challenging; especially when tracking fast-moving storms and those close to the radar. When frequent antenna-position changes are required, the focus of the operator can be detracted from the storm itself. This paper describes a new algorithm, implemented in the fall of 2011, which tracks a user-specified weather feature and automatically repositions the antenna to keep it in the field of view (90-degree sector). 2. ALGORITHM Changes to the computing infrastructure have greatly improved signal processing and data quality at the NWRT (Heinselman and Torres 2011). In addition, the signal processing architecture has simplified the process of adding algorithms. One such algorithm, WXTRACK, has been developed for tracking weather features. A weather feature is defined here as anything that Corresponding Author Address: David Priegnitz, NOAA/NSSL, 120 David L. Boren Blvd, Norman, OK 73072; email:
[email protected]
has a reflectivity signature; typically, a small storm, a cluster of storms, or a squall line. When the weather feature nears the edge of the field of view, the algorithm determines a new optimal position for the antenna and issues a command to reposition the antenna prior to starting the next volume scan. The algorithm takes into account the movement in both speed and direction of the weather feature in order to minimize the frequency of repositioning. Weather features are defined by the operator using the Radar Control Interface (RCI). Using the mouse and a reflectivity product as background, the operator defines a polar rectangle, or box, surrounding a weather feature (a polar rectangle was chosen to match the format of the radar data, simplifying data processing). This information, along with a reflectivity threshold and azimuthal tolerance, are sent to the signal processing software. The reflectivity threshold determines which gates inside the box are considered for tracking. The azimuthal tolerance determines how close the box is allowed to get to the edge of the field of view before the antenna needs to be rotated to a new position. The WXTRACK algorithm processes this information and computes the centroid of the reflectivity field for all gates inside the box at, or above, the threshold at the lowest elevation. In subsequent scans, a new centroid is computed and the box boundaries are adjusted to preserve the initial centroid position relative to the center of the box. If either azimuthal side of the box becomes too close to a scan window boundary (field of view minus the azimuthal tolerance), the algorithm computes a new optimal antenna position and commands the antenna to move at the end of the current scan. A small azimuthal tolerance will minimize the frequency of repositioning the antenna. However, one must consider data quality issues as well when defining an azimuthal tolerance. At broadside, the horizontal beam width of the antenna is 1.5 degrees, increasing to a value of 2.1 degrees at the edges (+/- 45 deg). If one is concerned about the effects of increasing sample volume as the weather feature moves away from broadside, then a larger azimuthal tolerance should be considered. Of course the width of the tracking box relative to the scan window must also be considered. The process of repositioning the antenna is more
efficient when performed by the algorithm. While tracking a weather feature, the maximum azimuthal distance the antenna can be repositioned by the algorithm is 86 degrees, requiring less than 6 seconds to complete. If this operation were performed manually by an operator, it would typically require more than 30 seconds to complete ( the exact time would depend on how fast the operator can input the new antenna position, issue the command, and restart scanning). Since the algorithm is considerably more efficient than the humanoperator, the frequency of repositioning the antenna shouldn’t be as much of an issue as it was previously.
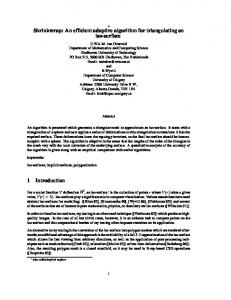
window is defined as the field of view minus the azimuthal tolerance. A graphical representation of the box and scan boundaries is illustrated in Figure 1.
2.1 Algorithm Description The following describes the actions performed by the WXTRACK algorithm. When a start-of-volume flag is detected in the reflectivity stream do the following: 1) 2)
Save the radial moment data until a new elevation cut is detected keep track of the leftmost and rightmost azimuths; these will define the field of view
When a new elevation cut is detected in the reflectivity stream do the following: 1)
2)
3) 4) 5) 6)
Compute the weighted centroid of gates inside the box at or above the threshold; the weight is determined by subtracting the threshold, squaring the result, and adding 1. Summarize the properties of the gates inside the box; the total number of gates, gates above threshold, gates above selected reflectivity levels, maximum reflectivity. Update the sector properties. Update the box position. Update the antenna position (if box reached a sector boundary). Send status to the RCI.
2.2 Algorithm Control There are only two commands that control the WXTRACK algorithm; “ON” and “OFF”. However, additional information is passed to the algorithm when tracking is turned on. These include: box coordinates (left azimuth, right azimuth, near range, far range), reflectivity threshold, and azimuthal tolerance. One complete scan is required to define the field of view once tracking is activated. The antenna is commanded to a new azimuthal position when one of the box sides touches or moves outside the scan window. The scan
Figure 1: Illustration of tracking box sides (Bl, Br, Bn, Bf), azimuthal tolerance (T), scan window (Wl, Wr), and field of view (Sl, Sr) The algorithm adds the tolerance, T, to the field of view left azimuth, Sl, and subtracts it from the field of view right azimuth, Sr, to determine the effective scan window, Wl, and Wr, respectively. If the box left azimuth, Bl, is less than or equal to Wl the pedestal is commanded counterclockwise to a new position where the box right azimuth, Br, is 4 degrees less than Wr (a value of 4 degrees was chosen to add cushion between Br and Wr). If Br is greater than or equal to Wr the pedestal is commanded clockwise to a position where Bl is 4 degrees greater than Wl. Tracking is terminated under the following conditions: 1) 2) 3) 4)
Bn < 10 km : Box-too-close rule (Br-Bl) >= (Wr-Wl): Box-too-wide rule (Br > Wr) | (Bl < Wl): Box-outsidewindow rule No gates above threshold: Threshold rule
3. TEST CASES Although WXTRACK was implemented late in the fall, the severe weather events on 7 November 2011 provided ample test cases for tracking different types of weather features. The most significant test was in the afternoon where a long lived tornadic storm was tracked. This storm produced the first EF4 tornado on record for the month of November in Oklahoma. A sequence of reflectivity images are presented for three different weather features. In each case, the azimuthal tolerance was set to 2 degrees and the reflectivity threshold to 20 dBZ. The track box, the centroid, and scan window boundaries are overlaid for reference. 3.1 Case 1
During the early morning hours a line of strong storms passed to the south of the NWRT PAR. The most intense section of the line was “boxed” and tracked as it progressed to the eastnortheast. A time sequence of 0.5 degree reflectivity images, showing the progression of this weather feature, is presented in Figure 2. The reflectivities at 13:01:33 UTC, after the feature was identified and tracking activated, are shown in Fig 2a. The most intense portion of the weather feature is skewed to the left (radar relative) of the center of the tracking box. Approximately 17 minutes later, at 13:17:20 UTC, the position of the weather feature and tracking box have shifted to the east-northeast (Fig 2b). The position of the weather feature relative to the box is very similar to that in the initial scan, although the intensity of the storms had diminished. About 7 minutes later, at 13:24:33 UTC, the weather feature moved far enough to the east-northeast for the left side of the tracking box to reach the left side of the scan window, causing the algorithm to command the antenna to a new position (Fig 2c). The new scan window boundaries, along with the new field of view, one scan later at 13:25:31 UTC is shown in Fig 2d. In general, the tracking algorithm followed the weather feature reasonably well in this case. 3.2 Case 2 Later in the morning, behind the initial line of storms, weaker and less organized showers and storms were widespread across western Oklahoma. One of the stronger storms was tracked. A time sequence of 0.5 degree reflectivity images, showing the progression of this weather feature, is presented in Figure 3. The reflectivities at 15:01:54 UTC, after the feature was identified and tracking activated, is shown in Fig 3a. The strongest reflectivities are skewed slightly to the right side of the tracking box. Approximately 10 minutes later at 15:11:24 UTC, as the storm moved to the north-northeast, new cell development was evident on the south edge of the storm. However, the storm was still
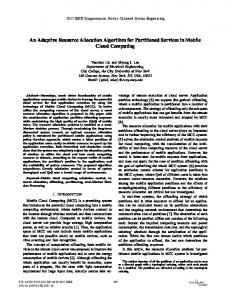
well contained in the tracking box. By 15:20:55 UTC, this was no longer true (Fig 3c). The new development to the south of the storm shifted the tracking box away from it. Less than 10 minutes later, at 15:30:25 UTC, the storm was located entirely outside the tracking box and a new storm was being tracked instead (Fig 3d). In this case, the tracking algorithm did not do a good job following the initial storm. The small size of the tracking box along with the rapid movement of the storm probably contributed to the poor performance. A larger box would have been less sensitive to the new storm development and most likely would have tracked it better. 3.3 Case 3 During the early afternoon hours a tornadic supercell developed in southwest Oklahoma. The WXTRACK algorithm tracked this storm for more than 3 hours. A time sequence of 0.5 degree reflectivity images, showing the progression of this storm, is presented in Figure 4. Superimposed on each image are the tornado tracks The reflectivities at 21:11:07 UTC, after the feature was identified and tracking activated, is shown in Fig 4a. At this time the storm was producing a strong tornado to the southeast of Altus. The northeastward movement of this storm 1 hour later at 22:11:25 UTC is shown in Fig 4b. The structure of the storm (still tornadic at this time) remained well defined and the position of the storm relative to the tracking box changed very little. At 22:11:29 UTC, the storm was still well defined and producing a tornado (Fig 4c). Although the orientation of the tracking box changed over time (due to being defined in polar coordinate space), it still captured the storm very well. As the storm reached the scan window boundary the antenna was repositioned (Fig 4d). In this case, the tracking algorithm did an excellent job of tracking the supercell. The good performance was likely due to the steady state of the storm and its isolation from other storms.
Figure 2: Sequence of reflectivity images of embedded storm being tracked in the morning of 7 November 2011: a) 13:01:33 UTC, b) 13:17:20 UTC, c) 13:24:31 UTC, d) 13:25:31 UTC.
Figure 3: Sequence of reflectivity images of small storm being tracked during the late morning of 7 November 2011: a) 15:01:54 UTC, b) 15:11:24 UTC, c) 15:20:55 UTC, d) 15:30:25 UTC.
Figure 4: Sequence of reflectivity images of tornadic supercell being tracked on 7 November 2011: a) 21:11:07 UTC, b) 22:11:25 UTC, c) 23:11:29 UTC, d) 23:22:35 UTC. Preliminary tornado tracks (thick white lines) are shown (courtesy of the National Weather Service Norman Forecast Office).
4. SUMMARY
REFERENCES
Initial testing of the WXTRACK algorithm demonstrated its usefulness during data collection on the NWRT PAR on 7 November 2011. The algorithm performed best while tracking an isolated supercell and poorest while tracking a fast-moving small storm in a region of more widespread precipitation. These are not unexpected observations as supercells tend to be more isolated and contamination from other storms is limited. Whereas, for embedded, smaller storms, contamination from other storms is more likely. In general, past data collection with the NWRT PAR has focused on the strongest and most severe storms. In most of these instances the tracking algorithm would have been expected to perform well if it had been available at the time. As we continue to evaluate and fine tune the performance of this algorithm, the challenge will be to see how it performs on larger scale phenomena such as squall lines.
Forsyth, D. E., J. F. Kimpel, D. S. Zrnic, R. Ferek, J. F. Heimmer, T. McNellis, J. E. Crain, A. M. Shapiro, R. J. Vogt, and W. Benner, 2011: What's new at the NATIONAL WEATHER RADAR TESTBED (PHASED th ARRAY). Preprints, 27 Conference on Interactive Information Processing Systems (IIPS) for Meteorology, Oceanography, and Hydrology, Amer. Meteor. Soc., Seattle, WA, 12B.2
Improvements to the WXTRACK algorithm are currently underway. The first generation of the algorithm has focused on using the centroid of the reflectivity field at the lowest elevation cut to reposition the track box. The next generation of the algorithm will provide the option of using the volumetric centroid of the reflectivity field from all elevation cuts in the scan volume to reposition the track box. This is expected to be implemented in the spring of 2012.
Heinselman, P. L. and S. M. Torres, 2011: High Temporal Resolution Capabilities for the National Weather Radar Testbed PhasedArray Radar. J. Appl. Meteor. Climatol., 50, 579-593. Priegnitz, D. L. and D. E. Forsyth, 2006: The Radar Control Interface for the National nd Weather Radar Testbed, Preprints, 22 International Conference of Interactive Processing Systems for Meteorology, Oceanography, and Hydrology, Atlanta, GA, Amer. Meteor. Soc., 8A.2 Priegnitz, D. L. and D. E. Forsyth, 2007: Update to the National Weather Radar Testbed rd Radar Control Interface, Preprints, 23 International Conference of Interactive Processing Systems for Meteorology, Oceanography, and Hydrology, San Antonio, TX, Amer. Meteor. Soc., 8A.2
ACKNOWLEDGEMENTS Support for this paper and research was provided by NOAA/Office of Oceanic and Atmospheric Research under NOAA-University of Oklahoma Cooperative Agreement #NA11OAR4320072, U.S. Department of Commerce. The statements, findings, conclusions, and recommendations are those of the authors and do not necessarily reflect the views of NOAA or the U.S Department of Commerce. We'd also like to thank Ric Adams, Eddie Forren, John Thompson, Chris Curtis, Igor Ivic, David Warde and Mike Jain for their contributions to the research, software design and implementation.
Priegnitz, D. L., P. L. Heinselman, S. M. Torres, and R. Adams, 2009: Improvements to the National Weather Radar Testbed Radar th Control Interface. 34 International Conference on Radar Meteorology, Williamsburg, VA, Amer. Meteor. Soc., P10.10 Zrnic, S. S., J. F. Kimpel, D. E. Forsyth, A. Shapiro, G. Crain, R. Ferek, J. Heimmer, W. Benner, T. J. McNellis, and R. J. Vogt, 2007: Agile-beam phased array radar for weather observations. Bull. Amer. Meteor. Soc., 88, 1753-1766.