diology, where the subjective quality of images is important for human interpretation ... limited by their linear and single scale properties, and less e ective for im-.
7 Contrast Enhancement by Multiscale and Nonlinear Operators Jian Fan and Andrew Laine
7.1 Introduction Image enhancement techniques have been widely used in elds such as radiology, where the subjective quality of images is important for human interpretation (diagnosis). Contrast is an important factor in any subjective evaluation of image quality. Many algorithms for accomplishing contrast enhancement have been developed and applied to problems in medical imaging. A comprehensive survey of existing methods can be found in [1]. Among them, histogram modi cation and edge enhancement techniques have been most commonly used along with traditional methods of image processing. Histogram modi cation techniques [2, 3] are attractive due to their simplicity and speed, and have achieved acceptable results for some applications. In general, a transformation function is derived from a desired histogram and the histogram of an input image. In general, the transformation function is almost always nonlinear. For continuous functions, a 1
2 lossless transformation may be achieved. However, for digital images with some nite number of gray levels, such a transformation results in information loss, due to quatization errors. For example, a subtle edge may be merged with its neighboring pixels and disappear. Attempts to incorporate local context into the transformation process have achieved limited success. For example, simple adaptive histogram equalization [4] supported by xed contextual regions cannot adapt to features of distinct sizes. Most edge enhancement algorithms share a common strategy implicitely: detection followed by local \edge sharpening". Unsharp masking is rare in that it has become a popular enhancement algorithm to assist radiologist in diagnosis [5, 6]. \Unsharp masking" sharpens edges by substracting a portion of a Laplacian tered component from an original image. Theoretically, this technique was justi ed as an approximation of a deblurring process in [7]. Loo et al. [8] studied an extension of this technique in the context of radiographs. Another extension based on Laplacian tering was proposed in [9]. However, these techniques of unsharp masking remain limited by their linear and single scale properties, and less e�ective for images containing a wide range of salient features typically found in digital mammography. In an attempt to overcome these limitations, a local contrast measure and nonlinear transform functions were introduced in [10], and subsequently re ned in [11]. Unfortunately, limitations remained in these nonlinear methods as well: (1) They operated on a single scale, (2) No explicit noise suppression stage was included (in fact noise could be ampli ed), and (3) Ad-hoc nonlinear transform functions were introduced without a rigorous mathematical analysis of their enhancement mechanisms or the possible introduction of artifacts. Recent advancement of wavelet theory has sparked researchers' interest in the application of image contrast enhancement [12, 13, 14, 15, 16, 17, 18]. These early studies showed promise, but were carried out at an experimental level. In this chapter, we give a detailed mathematical analysis of a dyadic wavelet transform, and reveal its connection to traditional techniques of unsharp masking. In addition, we propose a simple nonlinear enhancement function and analyze the problem of introducing artifacts, as a result of wavelet processing. Moreover, we describe an explict denoising stage that preserves edges using wavelet shrinkage [23] and adaptive thresholding. These techniques are discussed in the following sections of this chapter:
7.2. ONE-DIMENSIONAL DISCRETE DYADIC WAVELET TRANSFORM 3
-
E
b g(!)
b k(!)
`
E
b g (2!)
`
b g(4!)
b h(!)
E bk(4!)
b k(2!) b h(!)
`
b h(2!)
-
b h(2!) b h(4!)
b h(4!)
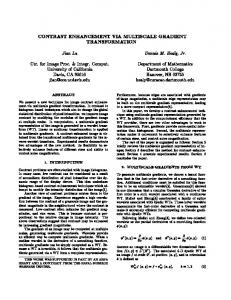
Figure 7.1: Computational structure for a one dimensional discrete dyadic wavelet transform (three levels shown). Section 7.2 presents a one dimensional dyadic wavelet transform. Section 7.3 analyzes linear enhancement and its mathematical connection to traditional unsharp masking. Section 7.4 analyzes simple nonlinear enhancement by point-wise functional mapping. Section 7.5 introduces denoising with wavelet shrinkage along with an adaptive approach for nding threshold values. Section 7.6 presents a two-dimensional extension for digital mammography and special procedures developed for denoising and enhancement that avoid orientation distortions. Section 7.7 presents some sample experimental results and comparisons with existing techniques. Finally, Section 7.8 concludes our discussion and proposes possible future directions of research.
7.2 One-dimensional discrete dyadic wavelet transform 7.2.1 General structure and channel characteristics A fast algorithm [20] for computing a 1-D redundant discrete dyadic wavelet transform (RDWT) is shown in Figure 7.1. The left side shows its decomposition structure, and the right, reconstruction. For an N-channel structure,
4
-
fb0 (!)
E
fb1 (!)
E
fb2 (!)
E
bi0 (!)
`
bi1 (!)
`
-
bi2 (!)
`
fb3 (!)
bi3 (!)
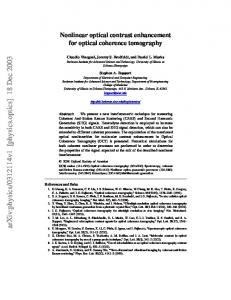
Figure 7.2: An equivalent multi-channel structure for a three-level RDWT. there are N ; 1 high-pass or band-pass channels and a low-pass channel. Thus, the decomposition of a signal, produces N ; 1 sets of wavelet coe�cients and a coarse signal. Since there is no down-sampling and up-sampling shown in Figure 7.1, our redundant discrete dyadic wavelet transform does not correspond to an orthogonal wavelet basis (see Chapter 1, Section 1.3.2). For simplicity of analysis, an equivalent multi-channel structure is shown in Figure 7.2. This computational structure also makes obvious the potential for high-speed execution by parallel processing. We shall refer to lters fbm (!) and bim (!) in Figure 7.2 as forward lters and inverse lters, respectively. Their relationship to lters gb(!), bk(!) and b h(!) are explicitly given by fb0 (!)
= gb(!); "
fbm (!) =
mY ;1 l=0
fbN (!)
=
#
NY ;1 l=0
b h(2l !);
b h(2l !) bg(2m !);
1 � m � N ; 1:
and b i0 (!) b im (!)
= bk(!); biN (!) = =
"m;1 Y
l=0
#
NY ;1 l=0
b h(2l !);
b h(2l !) bk(2m !);
1 � m � N ; 1:
7.2. ONE-DIMENSIONAL DISCRETE DYADIC WAVELET TRANSFORM 5 Since lters bh(!), bg(!) and bk(!) satisfy the condition 2 b g(!)bk(!) h(!) + b
= 1;
(7.1)
lters fbm (!) and bim (!) completely cover the frequency domain, X fbl (!)bil (!) = 1: l
Channel frequency responses bcm (!) can be written as
8 2 b > 1 > h(!) ; m = 0; > > > � � > < Qm;1 b l 2 b m 2 l=0 h(2 !) 1 h(2 !) > > ; 1 m (N 1); > > 2 > > QN ;1 : l l=0 bh(2 !) ; m = N:
;
cm (!) b
= fbm (!)bim (!) =
; � �
;
As an example, we consider an extension of the class of lters proposed by Mallat et al in [20] h � �i2n+p b ; (7.2) h(!) = eip ! cos !2 where p = 0, or 1. Let 2
"
�bm;q (!) = then we can show that and therefore cm (!) b
l=0
cos(2l;1 !)
#q
;
m;1 !) �q �bm;q (!) = sin(2 2m sin( !2 ) ;
8 < �bm;4n+2p (!)
=:
mY ;1
�bN;4n+2p (!)
�
; �bm+1;4n+2p (!) ; 0 � m � (N ; 1); ; m = N:
(7.3)
(7.4)
Note that �b0;n (!) = 1, and for 0 < m < N, b cm (!) = �bm;4n+2p (!) ; �bm+1;4n+2p (!) (7.5) 2nX +p;1 � ; � � �� cos 2m;1 ! 2l ; = sin2 !2 4m �bm;4n+2p+2 (!) l=0
6 n=1, p=0
n=1, p=1
1
1
0.9
0.9
0.8
0.8
0.7
0.7
0.6
0.6
0.5
0.5
0.4
0.4
0.3
0.3
0.2
0.2
0.1
0.1
0
0.5
1
1.5
2
2.5
3
0
0.5
1
(a)
1.5
2
2.5
3
(b)
Figure 7.3: Channel frequency responses for N = 6; n = 1 and (a) p = 0 and (b) p = 1. ; �
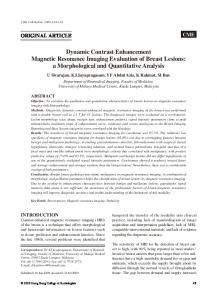
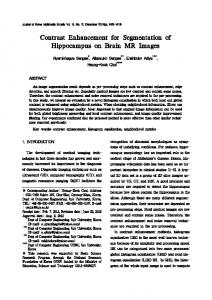
and sin2 !2 is the frequency response of the discrete Laplacian operator of impulse response f1; ;2; 1g. �bm;q (!) with even exponential q is an approximate Gaussian function, while the frequency responses of channels, 0 < m < N, are approximately a Laplacian of Gaussian. Figure 7.3 shows each distinct channel frequency response, and Figure 7.4 compares �b2;4 (!) and �b2;6(!) with related Gaussians.
7.2.2 Two possible lters In this framework, the possible choices of lters are constrained by Equation (7.1). For the class of lters de ned by Equation (7.2), we can derive +p;1 h � ! �i2l � � 2nX cos 2 : = sin2 !2 l=0 Under the constraint of both gb(!) and bk(!) being FIR's, there are two possible choices distinguished by the order of zero's in their frequency responses.
g(!)bk(!) b
1. Laplacian lter. In this case, bg(!) = ;4 sin !2 2 or g(l) = f1; ;2; 1g, which de nes a discrete Laplacian operator, such that (g � s)(l) = s(l + 1) ; 2s(l) + s(l ; 1). Accordingly, we can chose both �
; ��
7.2. ONE-DIMENSIONAL DISCRETE DYADIC WAVELET TRANSFORM 7 1
1
0.9
0.9
0.8
0.8
0.7
0.7
0.6
: Theta_2,4
0.6
0.5 0.4
: Gaussian exp(-2.8w*w)
0.4
0.3
0.3
0.2
0.2
0.1 0 0
: Theta_2,6
0.5 : Gaussian exp(-3.8w*w)
0.1
0.5
1
1.5
(a)
2
2.5
3
0 0
0.5
1
1.5
2
2.5
3
(b)
Figure 7.4: (a) �b2;4(!) compared with the Gaussian function e;2:8! . (b) �b2;6 (!) compared with the Gaussian function e;3:8! . 2
2
lters bh(!) and bk(!) to be symmetric, h � �i2n b h(!) = cos !2 and 2 2X n;1 h � ! �i2l 1 ; bh(!) b cos 2 : k(!) = gb(!) = ; 14 l=0 Both forward and inverse lters, 0 � m � N ; 1, can be derived by � � fbm (!) = ;4 sin(2m;1 !) 2 �bm;2n (!) (7.6) �!� = ;4 sin2 2 4m �bm;2n+2 (!) = bg(!)�bm (!) and n;1 � ; 1 2X m;1 !��2l = ;b m (!): bim (!) = ;�bm;2n (!) cos 2 4 l=0 Note that the forward lters fbm (!), 0 < m < N, can be interpreted as two cascaded operations, a Gaussian averaging of �bm;2n+2 (!) and � �2 ! the Laplacian ;4 sin( 2 ) , while the set of inverse lters bim (!) are low-pass lters. For an input signal s(l), wavelet coe�cients at the points \E" (as shown in Figures 7.1 and 7.2) may be written as wm (l) = �(s � �m )(l)
8 where � is the discrete Laplacian operator, and �m (l) is approximately a Gaussian lter. This means that each wavelet coe�cient wm (l) is dependent on the local contrast of the original signal at each position l. ; �
2. Gradient lter. In this case, gb(!) = 2ie;i ! sin !2 , or g(0) = 1, and g(1) = ;1, such that (g � s)(l) = s(l) ; s(l ; 1). Thus we select the lters h � �i2n+1 b h(!) = ei ! cos !2 and 2n h � ! �i2l X 1 i! b k(!) = ;e bg(!) 4 cos 2 : 2
2
l=0
We then derived the forward lters fbm (!) = bg(!)2m �bm;2n+2 (!) = bg(!)�bm (!) and inverse lters bim (!)
where
= ;ei! bg(!)b m (!);
2n � ; X �� cos 2m;1! 2l
bm (!) = 2m �bm;2n+2 (!) 14 l=0
is a low-pass lter. In this case, the associated wavelet coe�cients may be written as wm (l) = r(s � �m )(l) where r is a discrete gradient operator characterized by rs(l) = s(l) ; s(l ; 1).
7.3. LINEAR ENHANCEMENT AND UNSHARP MASKING
9
7.3 Linear enhancement and unsharp masking 7.3.1 Review of unsharp masking An early prototype of unsharp masking [7] was su (x; y) = s(x; y) ; k�s(x; y);
(7.7)
@ + @ is the Laplacian operator. However, this original where � = @x @y formula worked only at the level of nest resolution. More versatile formulas were later developed in two distinct ways. One way to extend this original formula was based on exploiting the averaging concept behind the Laplacian operator. The discrete form of the Laplacian operator may be written as �s(i; j) =�[s(i + 1; j) ; 2s(i; j) + s(i ; 1; j)] + [s(i; j + 1) ; 2s(i; j) + s(i; j ; 1)]� = ;5 s(i; j) ; 15 [s(i + 1; j) + s(i ; 1; j) + s(i; j) + s(i; j + 1) + s(i; j ; 1)] 2
2
2
2
This formula shows that the discrete Laplacian operator can be implemented by substracting from the value of a central point its average neighborhood. Thus, an extended formula [8] can be written as su (i; j) = s(i; j) + k [s(i; j) ; (s � h)(i; j)] ; (7.8) where h(i; j) is a discrete averaging lter, and � denotes convolution. In [8], an equal-weighted averaging mask was used: � 2; jxj < N=2; jyj < N=2 h(x; y) = 1=N 0; otherwise: Another way to extend the prototype formula [9] came from the idea of a Laplacian-of-Gaussian lter, which expands Equation (7.7) into su (x; y) = s(x; y) ; k�(s � g)(x; y) = s(x; y) ; k(s � �g)(x; y); (7.9) where g(x; y) is an Gaussian function, and �g(x; y) is a Laplacian-ofGaussian lter.
10 We mention for future reference, that both extensions shown in Equations (7.8) and (7.9) are limited to a single scale.
7.3.2 Inclusion of unsharp masking within RDWT framework
Next, we shall prove that unsharp masking with a Gaussian lowpass lter is included in a dyadic wavelet framework for enhancement by considering two special cases of linear enhancement . In the rst case, transform coe�cients of channels 0 � m � N ; 1 are enhanced (multiplied) by the same gain G0 > 1, or Gm = G0 > 1, 0 � m � N ; 1. The system frequency response is thus v(!) b
=
NX ;1 m=0
Gm bcm (!) + bcN (!) = G0
N X
m=0
cm (!) b
; (G0 ; 1)bcN (!)
= G0 ; (G0 ; 1)bcN (!) = 1 + (G0 ; 1) [1 ; bcN (!)] : This makes the input-output relationship of the system simply se (l) = s(l) + (G0 ; 1) [s(l) ; (s � cN )(l)] : (7.10) Since bcN (!) is approximately a Gaussian lowpass lter, Equation (7.10) may be seen as the 1-D counterpart of Equation (7.8). In the second case, transform coe�cients of a single channel p, 0 � p < N are enhanced by a gain Gp > 1, thus X v (!) = b b cm (!) + Gp bcp (!) (7.11) =
m6=p N X m=0
cm (!) + (Gp b
; 1)bcp (!) = 1 + (Gp ; 1)bcp (!):
Recall channel frequency response bcm (!) derived previously in 7.5, the input-output relationship of the system (7.11) can be written as se (l) = s(l) ; (Gp ; 1) � �(s � �)(l); (7.12) where �(l) is the impulse response of an approximate Gaussian lter. Similarily, Equation (7.12) may be seen as the 1-D counterpart of Equation (7.9). The inclusion of these two forms of unsharp masking demonstrates the
exibility and versatility of a dyadic wavelet framework.
7.4. NONLINEAR ENHANCEMENT BY FUNCTIONAL MAPPING 11
7.4 Nonlinear enhancement by functional mapping Linear enhancement can be seen as a mapping of wavelet coe�cients by a linear function Em (x) = Gm x. Therefore, a direct extension of this is a nonlinear mapping function Em (x) . The main challenges here are how to design a nonlinear function and how to best utilize multichannel information extracted from a dyadic wavelet framework to accomplish contrast enhancement.
7.4.1 Minimum constraint for an enhancement function
A major concern for our enhancement scheme was to introduce no artifacts during processing and reconstruction. For the dyadic wavelet framework adopted, this meant that we could not create new extrema in the channel outputs. This de ned a minimum constraint on any enhancement function, that is, such a function must be continuous and monotonically increasing.
7.4.2 Filter selection For linear enhancement, selection of lters bg(!) (and thus bk(!)) made no di�erence. However, this was not true for the nonlinear case. For this particular nonlinear approach, our analysis showed that a Laplacian lter should be favored. By selecting a Laplacian lter, we can be assured that positions of extrema will be unchanged and that no new extrema will be created within each channel. This is possible because: 1. Laplacian lters are zero-phase. No spatial shifting exists in the transform space. 2. A monotonically increasing function E(x) will not produce new extrema. (At some point x0 , E [f(x0 )] is an extrema if and only if f(x0 ) was an extrema).
12 15
10 8
10 6 4 5 2 0
0 -2
-5 -4 -6 -10 -8 -15 -5
-4
-3
-2
-1
0
(a)
1
2
3
4
5
-10 -5
-4
-3
-2
-1
0
(b)
1
2
3
4
5
Figure 7.5: (a) E(x) and (b) �(x), both with T = 0:5 and K = 20. 3. The reconstruction lters are simply zero-phase smoothing lters which will not create extrema. The major di�culty for using a gradient lter is that reconstruction includes another gradient operator. As a result, a monotonically increasing function E(x) alone will no longer guarantee new extrema will not be introduced in each output channel. Moreover, it is not di�cult to show that any nonlinear mapping will change the positions of original extrema. Therefore, we shall assume the choice of Laplacian lters in the remainder of this section.
7.4.3 A nonlinear enhancement function Designing a nonlinear enhancement scheme is made di�cult due to two reasons: (1) the problem of de ning a criteria of optimality for contrast enhancement. (2) complexity of analyzing nonlinear systems. We adopted the following guidelines in designing our nonlinear enhancement functions:
(1) An area of low contrast should be enhanced more than an area of high contrast. This is equivalent to saying that small values of wm [l] should have larger gains.
(2) A sharp edge should not be blurred.
7.4. NONLINEAR ENHANCEMENT BY FUNCTIONAL MAPPING 13 1.8
1.8
1.8
1.6
1.6
1.6
1.4
1.4
1.4
1.2
1.2
1.2
1
1
1
0.8
0.8
0.8
0.6
0.6
0.6
0.4
0.4
0.4
0.2
0.2
0.2
0
0
−0.2 0
50
100
150
200
250
300
350
400
450
500
(a)
−0.2
0
50
100
150
200
250
300
350
(b)
400
450
500
−0.2
50
100
150
200
250
300
350
400
450
500
(c)
Figure 7.6: 1-D contrast enhancement of a synthetic signal (a) by four-level dyadic wavelet analysis with (b) a linear operator with K0 = 2:3, and (c) a nonlinear operator with t = 0:1 and K0 = 7. Experimentally, we found the following simple function advantageous: 8 9 < x ; (K ; 1)T ; if x < ;T = E(x) = : Kx ; if jxj � T = x + �(x) (7.13) x + (K ; 1)T ; if x > T ; where K > 1 and 8 < ;(K ; 1)T; if x < ;T, �(x) = : (K ; 1)x; if jxj � T, (K ; 1)T; if x > T. The enhancement operator �m has two free parameters: threshold Tm and gain Km . In our experimental studies, Km = K0 ; 0 � m � N ; 1, and Tm = t � maxfjwm[n]jg, where 0 < t � 1 was user speci ed. For t = 1:0, wavelet coe�cients at levels 0 � m � N ; 1 were multiplied by a gain of K0 , shown previously to be mathematically equivalent to unsharp masking . Thus our nonlinear algorithm includes unsharp masking as a subset. Figure 7.6 shows a numerical example, comparing linear and nonlinear enhancement. Note the lack of enhancement for the leftmost edge, in the case of the linear operator. Speci cally, an enhanced signal se (l) can be written as se (l) = =
NX ;1 m=0 N X m=0
(Em [(s � fm )] � im )(l) + (s � fN � iN )(l) (s � fm � im )(l) +
NX ;1 m=0
(�m [�(s � �m )] � im )(l)
14 or, se (l) = s(l) ;
NX ;1
(�m [�(s � �m )] � m )(l):
m=0
(7.14)
For completeness, we mention that the formula of Equation (7.14) can be seen as a multiscale and nonlinear extension of the original unsharp masking de ned by Equation (7.9). We argue that multiscale unsharp masking as de ned by Equation (7.14) makes a marked improvement over traditional techniques in two respects: 1. The fast multiscale (or multimask) decomposition e�ciently identi es features existing within distinct levels of scale, eliminating the need for search. 2. The nonlinear algorithm enhances small features within each scale without blurring the edges of larger features, making possible the simultaneous enhancement of features of all sizes.
7.5 A methodology for combined denoising and enhancement The nonlinear enhancement methods proposed previously [11] did not take into account the presence of noise. In general, noise exists in a digitized image, due to the imaging device (acquisition) and quantization. As a result of nonlinear processing, noise may be ampli ed and may diminish any bene t of enhancement. Unfortunately, denoising a radiograph (or any medical image) is a very di�cult problem for two reasons. Fundamentally, there is no absolute boundary to distinguish a feature from noise. Even if there are known characteristics of a certain type of noise, it may be theoretically impossible to completely seperate the noise from features of interest. Therefore, most denoising methods may be seen as ways to suppress very high frequency and incoherent components of an input signal.
7.5. A METHODOLOGY FOR COMBINED DENOISING AND ENHANCEMENT15
(a) A
B
(b) A
A
(c)
B
B
A
(d)
Figure 7.7: (a) Signal with two edges. (b) 1st derivative (gradient). (c) 2nd derivative (Laplacian). (d) Shrunken 2nd derivative.
A naive method of denoising that is equivalent to low-pass ltering is naturally included in any dyadic wavelet framework. That is, simply discard several channels of highest resolution, and enhance channels con ned to lower frequency. The problem associated with this linear denoising approach is that edges are blurred signi cantly. This aw makes linear denoising unsuitable within a contrast enhancement scheme targeted for medical imaging. Figure 7.9 (c) shows an example of this approach. In order to achieve edge-preserved denoising, more sophisticated methods based on wavelet analysis were proposed in the literature. Mallat and Hwang [22] connected noise behavior to singularities. Their algorithm relied on a multiscale edge representation. The algorithm traced modulus wavelet maxima to evaluate local Lipschitz exponents and deleted maxima points with negative Lipschitz exponents. Donoho [23] proposed nonlinear wavelet shrinkage. This algorithm reduced wavelet coe�cients towards zero based on a level-dependent threshold.
16
7.5.1 incorporating wavelet shrinkage into enhancement The method of wavelet shrinkage can be incorporated trivially into our nonlinear enhancement framework by simply adding an extra segment to the enhancement function E(x), de ned earlier in Equation (7.13). 8 > > > >
> > > :
x ; (K ; 1)Te + KTn K(x + Tn ) 0 K(x ; Tn ) x + (K ; 1)Te ; KTn
; ; ; ; ;
if if if if if
x � ;Te ; Te � x � ;Tn jxj � Tn Tn � x � Te x � Te
(7.15)
However, there are two arguments which favor shrinking gradient coe�cients instead of Laplacian coe�cients. First, gradient coe�cients exhibit a higher signal to noise ratio (SNR). For any shrinkage scheme to be e�ective, an essential property is that the magnitude of a signal's components be larger than that of existing noise (at least most of the time). It is thus sensible to de ne the SNR as the maximum magnitude of a signal over the maximum magnitude of noise. For example, consider a soft edge model f(x) =� A=(1 + e;2� x ); A > 0. Its rst and second derivatives are f 0 (x) = A = 2 cosh2( x) and f 00 (x) = ;A 2 sinh( x)= cosh3( x), with pmagnitude of local extrema jf 0 (x0 )j = A j j =3 and jf 00 (x0 )j = 2A 2 =3 3, respectively. In this simple model, we can assume that noise is characterized by a relatively small A value and large value. Clearly, gradient coe�cients have a higher SNR than that of Laplacian coe�cients since contributes less. Figures 7.7 (b) and (c) show rst and second derivatives, respectively, for an input signal (a) with two distinct edges. In addition, boundary contrast is not a�ected by shrinking gradient coe�cients. As shown in Figure 7.7, coe�cients aligned to the boundary of an edge are local extrema in the case of a rst derivative (gradient), and zero crossings in the case of a second derivative (Laplacian). For a simple point-wise shrinking operator, there is no way to distinguish the points marked \B" from the points marked \A". As a result, regions around each \A" and \B" point are diminished, while the discontinuity in \B" (Fig. 7.7) sacri ces boundary contrast. In the previous section, we argued that nonlinear enhancement is best
7.5. A METHODOLOGY FOR COMBINED DENOISING AND ENHANCEMENT17
-
gm;1 (!) b
- ;C x ; ( )
gm;2 (!) b
-
E(X)
-
Figure 7.8: Incorporating wavelet shrinkage into an enhancement framework (one level shown). performed on Laplacian coe�cients. Therefore, in order to incorporate denoising into our enhancement algorithm, we split the Laplacian operator into two cascaded gradient operators. Note that gm (!) b
� ; �� = ;4 sin 2m;1! 2 = bgm;1 (!)bgm;2 (!)
where ; � � ; � gm;1 (!) = e;i!=22i sin !2 ;;bgm;2(!)� = ei!=2 2i sin !2 ; if m = 0; b gm;1 (!) = bgm;2 (!) = 2i sin 2m;1 ! b ; otherwise. Denoising by wavelet shrinkage [23] can then be incorporated into this computational structure as illustrated in Figure 7.8, where the shrinking operator can be written as � jxj > Tn; C(x) = sign(x) � jxj ;0 Tn ;; ifotherwise: Note that the shrinking operator is a piece-wise linear and monotonically non-decreasing function. Thus in practice, the shrinking operator will not introduce artifacts.
7.5.2 Threshold estimation for denoising The threshold Tn is a critical parameter in the shrinking operation. For a white noisepmodel and orthogonal wavelet, Donoho [23] suggested a formula p of Tn = 2 log(N)�= N, where N is the length of a input signal and � is the standard deviation of wavelet coe�cients. However, the dyadic wavelet we applied is not an orthogonal wavelet. Moreover, in our 2-D applications, a shrinking operation is applied to magnitudes of gradient coe�cients instead of wavelet coe�cients themselves. Therefore, a method of threshold estimation method proposed in [24] for edge detection may be more suitable.
18 In our \shrinking" operation, only the magnitudes of the gradient of a Gaussian low-passed signal are modi ed. As pointed out in [24], for white Gaussian noise, the probability distribution function of the magnitudes of gradient is characterized by the Rayleigh distribution: 8