C.-M. Tsai and Z.-M. Yeh: Contrast Enhancement by Automatic and Parameter-Free Piecewise Linear Transformation for Color Images
213
Contrast Enhancement by Automatic and Parameter-Free Piecewise Linear Transformation for Color Images Chun-Ming Tsai and Zong-Mu Yeh Abstract — Conventional contrast enhancement methods have four shortcomings. First, most of them need transformation functions and parameters which are specified manually. Second, most of them are application-oriented methods. Third, most of them are performed on gray level images. Fourth, the histogram equalization (HE) based enhancement methods use non-linear transform function. Thus, this paper proposes an automatic and parameter-free contrast enhancement algorithm for color images. This method includes following steps: First, RGB color space is transformed to HSV color space. Second, image content analysis is used to analyze the image illumination distribution. Third, the original image is enhanced by piecewise linear based enhancement method. Finally, the enhancement image is transformed back to RGB color space. This novel enhancement is automatic and parameter-free. Our experiments included various color images with low and high contrast. Experiment results show that the performance of the proposed method is better than histogram equalization (HE) and its six variations in non-over enhancement and natural clearly revealed. Moreover, the proposed algorithm can be run on an embedded environment (such as mobile device, digital camera, or other consumer products) and processed in real-time system due to its simplicity and efficiently1. Index Terms —Contrast enhancement, Image content analysis, Parameter-free enhancement, Piecewise linear transformation Color images.
I. INTRODUCTION Contrast enhancement is developed to adjust the quality of an image for better human visual perception [1][2]. It is a very important pre-processing step for tasks in image processing, video processing, medical image processing, aerial image processing, and computer vision. Current contrast enhancement algorithms based on spatial domain techniques can be divided into three main types: global, local, and hybrid. Global enhancement methods enhance the image from the luminance information of an entire image. Duan and Qiu [3] divided the luminance range 1
This work was supported by the Ministry of Economic, R.O.C., under Grants MOEA-96-EC-17-A-02-S1-032 and National Science Council, R.O.C., under Grants NSC 96-2221-E-133-001-. Chun-Ming Tsai is with the Department of Computer Science, Taipei Municipal University of Education, No. 1, Ai-Kuo W. Road, Taipei 100, Taiwan. (E-mail:
[email protected], Phone: +886-2-23113040 ext. 8934; Fax: +886-2-23118508). Zong-Mu Yeh is with the Department of Mechatronic Technology, National Taiwan Normal University, Taipei 106, Taiwan. (E-mail:
[email protected] ) Contributed Paper Manuscript received February 4, 2008
[0, 255] into 256 intervals using a hierarchical division procedure and used a control parameter to control the mapping. Sun et al. [4] proposed a dynamic specific histogram algorithm to do contrast enhancement for a real-time system due to its simplicity. Local enhancement methods enhanced the image for each pixel according to the information (luminance, saturation, and Retinex) of its own and its neighbor. Chatterji and Murthy [5] proposed an adaptive contrast enhancement for color images. However, in their method, two parameters (e.g., enhancement function and region size) are needed to determine. Meylan and Süsstrunk [6] used a Retinex-based adaptive filter to enhance natural color images, and their results showed that the color image with halo area could be enhanced. However, it needed to choose the appropriate filter size to reduce halos images and to introduce global tone mapping for extremely high dynamic range images. Munteanu and Rosa [7] used GA algorithm to search the parameters of the Multi-Scale Retinex model and eleven parameters (e.g., seven for Retinex, four for GA) are needed to be set. Hybrid enhancement methods combined both global and local approaches. In these methods, an image is divided into non-overlay or overly regions and each region is conquered by global methods. Kim et al. [8] used partially overlapped sub-block HE (POSHE) technique to achieve contrast enhancement. However, the visual quality and computational speed-up is a trade-off problem. Furthermore, the sub-block divisor and the overlap step divisor are determined in advance. Pei et al. [9] used color contrast enhancement based on saturation and adaptive histogram equalization based on luminance for ancient Chinese paintings. However, their method needed to determine a positive factor for controlling the luminance level and the window size of the adaptive histogram equalization. Lamberti et al. [10] used cascaded multistep binomial filtering HE to speed the POSHE method. However, the computational complexity of their method strictly depends on the particular values of the sub-block divisor and the overlap step divisor being selected. Lim et al. [11] proposed a high dynamic range method to enhance color image. Their method improves image contrast without color change, loss of the lighting information, and false contours. However, their method need to determined five parameters (weighting factors w1=1/2, w2=1/3, w3=1/6 and α = 10 and β = 75 are used) for all testing images. Recently, Wang and Ward [12] proposed a weighted thresholded HE (WTHE) enhancement method to enhanced image and video. Their method is fast. However, their method need to adjust the power factor r and the normalized upper
0098 3063/08/$20.00 © 2008 IEEE
IEEE Transactions on Consumer Electronics, Vol. 54, No. 2, MAY 2008
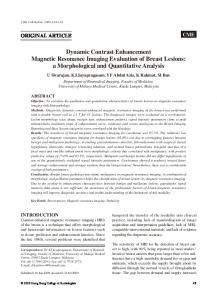
214 Color images Color transformation (RGB -> HSV) Image content analysis Automatic and parameter-free piecewise linear transformation (APFPLT) Color transformation (HSV -> RGB) Enhanced images
Fig. 1. Flow diagram of the proposed system.
threshold v. The normalized upper threshold is used to control the effect of enhancement. Abdullah-Al-Wadud et al. [13] proposed dynamic histogram equalization (DHE) which based on conventional histogram equalization to enhance image. The enhanced results of their method are without introducing washed out appearance, checkerboard effects, or undesirable artifacts. However, their method need to adjust one parameter x. It determines how much emphasis should be given on cumulative frequencies to decide the span of each subhistogram in the output. Menotti et al. [14] proposed a novel Multi-HE technique, which consists of decomposing the input image into several sub-images, and applying the classical HE process to each one. Their method can preserve more the brightness and produce more natural looking images than the other HE methods. However, their method need to set the weighting constant of the cost function in advance. It is worth noting that global methods are simple and fast, and can be applied by simple hardware and processed in a real time system. Local methods yield better experimental results, but are slower than global methods. Hybrid methods have better experimental results, but are slower than global methods. The proposed method is a kind of global method, which is based on image content analysis and piecewise linear transformation. The proposed method is simple, fast, no parameters, and enhanced automatically. Most of conventional contrast enhancement methods have three shortcomings: (1) most of them need transformation functions and parameters which are specified manually in advance. Second, most of them are application-oriented methods. Third, most of them are performed on gray level images. Histogram equalization (HE) and its variations are one of the most commonly used algorithms to perform contrast enhancement due to its simplicity and effectiveness. [1][9][10][12-19]. Histogram equalization can be extended to process color images [4][9][11][20-23]. However, it has many shortcomings: (1) it cannot preserve the brightness illumination [14]. (2) The result of histogram equalization produced annoying side effects, such as overhead brightness enhancement, white noise, and some unnatural results [4]. (3) It did not maintain color fidelity [24]. (4) HE and its variation methods produce unnatural looking images [14]. (5) It
changed the hue. (6) HE and its variation methods use nonlinear transform function. (7) HE and its variation methods adjust their parameters in advance. Therefore, in this paper an enhancement method via automatic and parameter-free piecewise linear transformation (APFPLT) is proposed to determine the transformation function automatically. In particular, the parameters of the transformation function are chosen automatically. In other words, it is parameter-free, and it doesn’t require the intervention by a human operator. Figure 1 illustrates the proposed system flow diagram. A color image is initially transformed into the HSV color space. Then, the value (luminance) component will be analyzed by the image content analysis algorithm to obtain the image illumination distributions. Next, the image distributions provide the parameters which are used by the automatic and parameter-free piecewise linear transformation function to enhance the images. Finally, the backward color transformation is applied to produce the enhancement result. The rest of this paper is organized as follows. Section II presents the image content analysis method. Section III presents the automatic and parameter-free piecewise linear transformation. Section IV provides results of experiments on the proposed system. Conclusions and future works are finally drawn in Section V. II. IMAGE CONTENT ANALYSIS Each color image can be represented by Gaussian mixtures – a more capable model to describe image content distributions. To reduce the computation time, the luminance domain of the image is analyzed to obtain the content distributions. Herein, each single Gaussian distribution is expressed as one peak and two valleys at luminance component. A. Color Transformation There are many color models [1][2][25-29]. In this paper, the input color image with RGB color model is adopted. Next, the RGB color model is transformed to HSV color model. The reasons of using HSV color model are summarized below. First, the value V (luminance) and color information (Hue and Saturation) are decoupled. Second, the HSV color model describes perceptual color relationships more accurately than RGB color model. Third, transforming RGB color model to HSV color model is easy. The transformation from RGB to HSV is described as follows [29]:
if max = 0 ⎧0, , S = ⎨ max −min ⎩ max × 255, otherwise V = max× 255.
(1) (2)
C.-M. Tsai and Z.-M. Yeh: Contrast Enhancement by Automatic and Parameter-Free Piecewise Linear Transformation for Color Images
if max = min ⎧undefined ⎪ g −b + 0°, if max = r & & g ≥ b ⎪60° × max − min ⎪ ⎪60° × g − b + 360° if max = r & & g < b , (3) H =⎨ max − min ⎪ b−r ⎪60° × max − min + 120° if max = g ⎪ r−g ⎪60° × + 240° if max = b max − min ⎩ Fourth, transforming HSV color model to RGB color model is easy too. The backward transformation equation from HSV to RGB is described as follows [29]: ⎢H ⎥ hi = ⎢ ⎥ mod 6 ⎣ 60 ⎦ H f = − hi , (4) 60 p = v × (1 − s )
q = v × (1 − f × s ) t = v × (1 − (1 − f ) × s ) For each color vector (r, g, b), ⎧(v, t , p), if (hi = 0) ⎪(q, v, p), if (h = 1) i ⎪ ⎪⎪( p, v, t ), if (hi = 2) (r , g , b ) = ⎨ ⎪( p, q, v), if (hi = 3) ⎪(t , p, v), if (hi = 4) ⎪ ⎪⎩(v, p, q) if (hi = 5) And the value of the R, G, and B are
R = r × 255, G = g × 255, and
(5)
B = b × 255 .
(6) To compute the luminance for an input color image, first, value V in the equation (2) is used. Then, the luminance histogram HV(xk) is computed. The histogram of an image with brightness levels in the range [0, 255] is a discrete function HV(xk) = nk, where xk is the kth brightness level and nk is the number of pixels in the image having brightness level xk. Finally, to obtain reliable peaks and valleys, a Gaussian smoothing filter is applied to smooth the original histogram, thus the unreliable peaks and valleys are removed. B. Gaussian Smoothing Filter The Gaussian convolution of a luminance histogram HV(x) depends upon both x and σg, namely, the Gaussian standard deviation. The convolution function SHV(x, σg) is provided by Eq. (7),
S HV ( x, σ g ) = H V ( x) ∗ g ( x, σ g ) =
∞
∫H
V
(u ) g ( x − u , σ g )du
−∞ ∞
= ∫ H V (u ) −∞
1 2π σ g
−
e
( x −u ) 2 2σ g 2
du ,
(7)
where “*” denotes the convolution operator and g(x-u, σg) is the Gaussian function. The degree of smoothing is controlled by the standard deviation of the Gaussian function. The larger
215
the standard deviation σg, the smoother the function SHV(x, σg) is. The standard deviation is decided automatically. This method is briefly as follows. Standard deviation σg is based upon the majority of the widths within the luminance histogram. In a histogram HV(x), if HV(x) < HV(x-1) and HV(x) < HV(x+1), then luminance x is a valley. The highest point between two successive valleys is a peak. This peak is the mode of a distribution, while this mode identifies the particular Gaussian distribution from the mixture. Therefore, the widths between two successive valleys are computed and thus, the maximum width, Wmax, among the widths is determined. Next, the width histogram for all peaks from 0 to Wmax is computed. After the highest point in the width histogram is located, which is regarded as the standard deviation σg of the width, Eq. (7) is employed to convolute the histogram HV(x) that provides smoothing histogram. The objective of choosing the standard deviation is to smooth the most frequent “ripples” of the histogram and to leave the significant modes. That is, the major peaks in the original histogram can be distinguished. The number of peaks in the smoothed histogram is considered as the number of peaks in the original histogram. C. Selection of Luminance Distributions Here one condition is assumed that image content distributions in luminance domain are multi-Gaussian. After the small peaks and valleys have been removed, the average differences are employed as the first derivation with which to determine the major peaks and valleys. The average difference in point x is defined by σ −1
' S HV ( x) =
g S HV ( x + i ) − S HV ( x − i ) . 1 ∑ σ g − 1 i =1 2×i
(8)
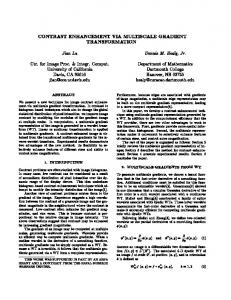
A peak is defined as a positive to negative crossover in the first derivation of the smoothed histogram. Furthermore, a valley is defined as a negative to positive crossover. All peaks and valleys from the first derivation of the smoothed histogram are discovered. In cases where the peaks and valleys are too close, they will be removed if the distance between a valley and a peak is less than the standard deviation σg. The remaining peaks are the candidates of the luminance distribution in the image. Figure 2 shows an example for image content analysis. The input image is processed by transforming RGB into HSV, getting the luminance histogram, smoothing the histogram, and selecting the color distributions. Each color distribution is selected by one peak and two valleys in luminance domain. The original histogram is shown in Fig. 2(a). Figure 2(b) is the smoothed histogram, which uses the Gaussian smoothing filter to smooth Fig. 2(a). The selection of the luminance distribution is depicted at Fig. 2(c). There are five luminance distributions. The range of each luminance distribution is represented by one peak and its two valleys.
IEEE Transactions on Consumer Electronics, Vol. 54, No. 2, MAY 2008
216
(a)
(b)
(c)
Fig. 2. An example for image content analysis to extract the luminance distributions. (a) Original histogram. (b) Smoothed histogram. (c) Selection of image luminance distribution.
III. AUTOMATIC AND PARAMETER-FREE PIECEWISE LINEAR TRANSFORMATION The proposed enhancement algorithm is based on piecewise linear transformation [1][2]. The axiom of piece-wise linear transformation and how to build transformation function and parameters automatically are described as follows. A. Piecewise Linear Transformation Function The piecewise linear transformation (PLT) is characterized by 2k parameters for k-1 line segments. When the parameters are given, the transformation line segments will be determined. That is, if given the starting position of input luminance {xk, k =0, 1... k} and the starting position of output luminance {yk, k=0, 1... k}, the k-1 transform functions Tk-1(x) will be: ( y − y k −1 ) (9) Tk −1 ( x) = k ⋅ ( x − xk −1 ) + y k −1 . ( xk − xk −1 ) For example, if k = 3, three transformation functions T0(x), T1(x), and T2(x) are shown in Fig. 3. Four input parameters and four output parameters will be specified first manually. To determine these parameters and line segments are critical for the satisfactory result of the contrast enhancement. In conventional applications, parameters and line segments are
Fig. 3. Piecewise linear transformation function (k = 3, k is the number of the input parameters).
manually chosen case by case. To solve this problem, an automatic and parameter-free based piecewise linear transformation algorithm is proposed in the following. B. Automatic and Parameter-Free Piecewise Linear Transformation Algorithm The conventional PLT-based image enhancement needs to set the number of the line segment and the values of the input and the output parameters in advance. In real time and general applications, the conventional PLT contrast enhancement method cannot work properly. If the conventional PLT image enhancement wants to produce satisfactory enhancement results in real time and general applications, the drawbacks of PLT image enhancement must be conquered. How is the number of line segments selected? The number of the image luminance distribution is used to represent the number of the line segments. If the number of the image luminance distribution is k, then the number of the line segment is k+1. How is the input luminance parameter decided? The location of the valley is used to represent the input luminance parameter. Different images have different distribution of valleys. For example, there are six line segments in the Fig. 2(c). The input luminance parameters are 0, 11, 51, 93, 126, 154, and 166. The location of these valleys and the parameters depend on the kind of image is employed. How are the output luminance parameters determined? These parameters depend on the kind of image is used. The determining method of input and output parameters are described in the following. C. Automatic Input and Output Parameter Setting After the luminance distributions have been analyzed, many peaks will be produced. If the color image has k luminance distributions {p1, p2…pk} (peak is represented by p,) then the number of the line segment is k+1. Each distribution is bounded by two valleys indicated as v. That is, the k luminance distributions have {v0, v1…vk} valleys. These valleys are used to be the input parameters {x0, x1…xk} of the piecewise linear transformation function. The output parameters {y0, y1…yk} of the piecewise linear transformation
C.-M. Tsai and Z.-M. Yeh: Contrast Enhancement by Automatic and Parameter-Free Piecewise Linear Transformation for Color Images
(a) Original
(b) Proposed method
(c) HE
(d) BBHE
(e) DSIHE
(f) RSMHE (r = 2)
(g) MWCMHE (k = 5)
(h) MMLSEMHE (k = 6)
217
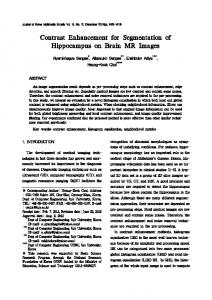
Fig. 4. Enhancement results using a children's choir image (indoor image). (a) Original, (b) Proposed image, (c) HEed image, (d) BBHEed image, (e) DSIHEed image, (f) RMSHEed image( r = 2 ), (g) MWCVMHEed image (k = 5), and (h) MMLSEMHEed image (k = 6).
function are defined as follows: vk
yk = ∑ Pr ( x ) ⋅ 255 ,
(10)
x=s
where Pr(x) is the probability of the luminance x. The parameter s is the start luminance of the input image IV. EXPERIMENTAL RESULTS AND DISCUSSION The enhancement algorithm proposed for color images was implemented as a Windows-based application on a Pentium (R) D 3.00GHZ and 504MB PC. Our experiments use color images. These images are obtained from internet and captured by us (Kodak EasyShare V550). The enhancement result of the proposed method is compared with the enhancement results by conventional histogram equalization (HE), mean preserving bi-histogram equalization (BBHE), equal area dualistic sub-image histogram equalization (DSIHE), recursive mean-separate histogram equalization (RMSHE), minimum within-class variance multi-histogram equalization (MWCVMHE), and minimum middle level squared error multi-histogram equalization (MMLSEMHE) methods. Some examples are presented as follows. A. Contrast Enhancement Performance Figure 4 shows the enhancement results using a children's choir image (indoor image). Figures 4(a)-(h) are original image, (b) Proposed image, (c) HEed image, (d) BBHEed image, (e) DSIHEed image, (f) RMSHEed image( r = 2 ), (g) MWCVMHEed image (k = 5), and (h) MMLSEMHEed image (k = 6) methods, respectively. The original image has the low contrast. The image size is 2048 × 1536. This image cannot see how many children sang the choral clearly. From this figure, the enhancement result of the conventional histogram
equalization has the highest brightness. However, the enhancement results of the chair are over-enhancement and not natural looking. Furthermore, many noises are produced on the wall. The children in the enhancement results of the BBHE, DSIHE, RSMHE, MWCMHE, and MMLSEMHE methods not appear clearly. The enhancement result of the proposed method has better enhanced contrast and more natural look than other comparison methods. Figure 5 shows the enhancement results using a scene image which is captured from Zion National Park (outdoor image). Figures 5(a)-(h) are original image, (b) Proposed image, (c) HEed image, (d) BBHEed image, (e) DSIHEed image, (f) RMSHEed image( r = 2 ), (g) MWCVMHEed image (k = 5), and (h) MMLSEMHEed image (k = 6) methods, respectively. The original image has the high contrast. The image size is 1536 × 2048. This image cannot see the detail scene clearly. From this figure, the enhancement result of the conventional histogram equalization has the highest brightness. However, the enhancement results of the sky are overenhancement and not natural looking. The sky in the enhancement results of the BBHE, DSIHE, RSMHE, MWCMHE, and MMLSEMHE methods are overenhancement, too. The enhancement result of the proposed method has better enhanced contrast and more natural look than other comparison methods. B. Speed Comparison In Table I, the execution time of the proposed method is similar to conventional histogram equalization and its variations. The execution time in average is about 0.373 second. The speed is very fast. That is, the proposed algorithm can be run on an embedded environment (such as mobile device, digital camera, or consumer products) and processed in real-time system due to its simplicity and efficiently.
IEEE Transactions on Consumer Electronics, Vol. 54, No. 2, MAY 2008
218
(a) Original
(b) Proposed method
(c) HE
(d) BBHE
(e) DSIHE
(f) RSMHE (r = 2)
(g) MWCMHE (k = 5)
(h) MMLSEMHE (k = 6)
Fig. 5. Enhancement results using a scene image which is captured from Zion National Park (outdoor image). (a) Original, (b) Proposed image, (c) HEed image, (d) BBHEed image, (e) DSIHEed image, (f) RMSHEed image( r = 2 ), (g) MWCVMHEed image (k = 5), and (h) MMLSEMHEed image (k = 6).
TABLE I SPEED COMPARISON FOR 2048 × 1356 AND 1356 × 2048 TEST IMAGES Methods
Execution Time in Average
Proposed HE BBHE DSIHE RSMHE (r = 2) MWCVM (k = 5) MMLSEMHE (k = 6)
0.372959 (second) 0.369703 (second) 0.369366 (second) 0.369317 (second) 0.369631 (second) 0.370348 (second) 0.371697 (second)
V. CONCLUSION AND FUTURE WORKS This study has presented a contrast enhancement method by automatic and parameter-free piecewise linear transformation. The input and output parameters of the piecewise linear transformation function are obtained from image content analysis. The proposed method is tested on large color images. The experiments showed that our method is better on enhanced contrast and yields images with natural clearly revealed in low and high contrast images. The performance
analysis (by execution time and visual measurements) indicated that our method is very efficient and effective by comparing with histogram equalization (HE), mean preserving bi-histogram equalization (BBHE), equal area dualistic subimage histogram equalization (DSIHE), recursive meanseparate histogram equalization (RMSHE), minimum withinclass variance multi-histogram equalization (MWCVMHE), and minimum middle level squared error multi-histogram equalization (MMLSEMHE) methods. To obtain satisfactory enhancement results and processing speed, future works should focus on the following: (1) Optimize our program; (2) Apply our proposal method to particular consumer applications. REFERENCES [1] [2] [3]
R. C. Gonzalez and R. E., Digital Image Processing, 2nd Edition, Prentice Hall, 2002. http://www.imageprocessingplace.com R. C. Gonzalez, R. E. Woods, and S. L. Eddins, Digital Image Processing Using MATLAB, Prentice Hall, 2004. http://www.imageprocessingplace.com J. Duan and G. Qiu, “Novel histogram processing for colour image enhancement,” In Proc. Third International Conference on Image and Graphics, pp. 55-58, 2004.
C.-M. Tsai and Z.-M. Yeh: Contrast Enhancement by Automatic and Parameter-Free Piecewise Linear Transformation for Color Images [4] [5]
[6]
[7]
[8]
[9]
[10]
[11] [12] [13]
[14]
[15] [16] [17] [18]
[19]
C. C. Sun, S. J. Ruan, M. C. Shie, and T. W. Pai, “Dynamic contrast enhancement based on histogram specification,” IEEE Transactions on Consumer Electronics, vol. 51, no. 4, pp. 1300-1305, 2005. B. N. Chatterji and N. R Murthy, “Adaptive contrast enhancement for color images,” In Proc. of 1997 International Conference on Information, Communications and Signal Processing, 3, pp. 1537-1541, 1997. L. Meylan and S. Süsstrunk, “Color image enhancement using a retinexbased adaptive filter,” In Proc. IS&T Second European Conference on Color in Graphics, Image, and Vision (CGIV 2004), 2, pp. 359-363, 2004. C. Munteanu and A. Rosa, “Color image enhancement using evolutionary principles and the retinex theory of color constancy,” In Neural Networks for Signal Processing XI, 2001. Proceedings of the 2001 IEEE Signal Processing Society Workshop, pp. 393-402, 2001. J. Y. Kim, L. S. Kim, and S. H. Hwang, “An advanced contrast enhancement using partially over-lapped sub-block histogram equalization,” IEEE Transactions on Circuits and Systems for Video Technology, vol. 11, no. 4, pp. 475-484, 2001. S. C. Pei, Y. C. Zeng and C. H. Chang, “Virtual restoration of ancient Chinese paintings using color contrast enhancement and Lacuna texture synthesis,” IEEE Trans. Image Processing, vol. 13, no. 3, pp. 416-429, 2004. F. Lamberti, B. Montrucchio, and A. Sanna, “CMBFHE: a novel contrast enhancement technique based on cascaded multistep binomial filtering histogram equalization,” IEEE Trans. Consumer Electronics, vol.52, no. 3, pp. 966–974, Aug. 2006. B. R. Lim, R. H. Park, and S. H. Kim, “High Dynamic Range for Contrast Enhancement,” IEEE Trans. Consumer Electronics, vol.52, no. 4, pp. 1454–1462, Nov. 2006. Q. Wang and R. K. Ward, “Fast Image/Video Contrast Enhancement Based on Weighted Thresholded Histogram Equalization,” IEEE Trans. Consumer Electronics, vol. 53, no. 2, pp. 757 – 764, May 2007. M. Abdullah-Al-Wadud, Md. H. Kabir, M. A. Akber dewan, O. Chae, “A Dynamic Histogram Equalization for Image Contrast Enhancement,” IEEE Trans. Consumer Electronics, vol. 53, no. 2, pp. 593 – 600, May 2007. D. Menotti, L. Najman, J. Facon, and A. de A. Araujo, “Multi-histogram equalization methods for contrast enhancement and brightness preserving,” IEEE Trans. Consumer Electronics, vol. 53, no.3, pp. 1186– 1194, August 2007. Y.-T. Kim, “Contrast enhancement using brightness preserving bihistogram equalization,” IEEE Trans. on Consumer Electronics, vol. 43, no. 1, pp. 1-8, Feb. 1997. Y. Wang, Q. Chen, and B. Zhang, “Image enhancement based on equal area dualistic sub-image histogram equalization method,” IEEE Trans. on Consumer Electronics, vol. 45, no. 1, pp. 68-75, Feb. 1999. S.-D. Chen and A. Ramli, “Minimum mean brightness error bi-histogram equalization in contrast enhancement,” IEEE Trans. on Consumer Electronics, vol. 49, no. 4, pp. 1310-1319, Nov. 2003. S.-D. Chen and A. Ramli, “Contrast enhancement using recursive mean separate histogram equalization for scalable brightness preservation,” IEEE Trans. on Consumer Electronics, vol. 49, no. 4, pp. 1301-1309, Nov. 2003. C. Wang and Z. Ye, “Brightness preserving histogram equalization with maximum entropy: A variational perspective,” IEEE Trans. On Consumer Electronics, vol. 51, no. 4, pp. 1326-1334, Nov. 2005.
219
[20] I. M. Bockstein, “Color equalization method and its application to color image processing,” J. Opt. Soc. Am., vol. 3, no. 5, pp. 735–737, 1986. [21] A. N. Venetsanopoulos and P. E. Trahanias, “Color image enhancement through 3-D histogram equalization,” In Proceedings, 11th International Conference on Image, Speech and Signal Analysis, 3, pp. 545–548, 1992. [22] A. R. Weeks, E. G Hague, and H. R. Myler, “Histogram equalization of 24-bit color images in the color difference (C-Y) color space,” Journal of Electronic Imaging, vol. 4, no. 1, pp. 15-22, 1995. [23] E. Pichon, M. Niethammer, and G. Sapiro, “Color histogram equalization through mesh deformation,” ICIP 2003, 2, pp. 117-120, 2003. [24] K. K. Tan and J. P. Oakley, “Physics-based approach to color image enhancement in poor visibility conditions,” Journal of the Optical Society of America A, vol. 18, no. 10, pp. 2460-2467, 2001. [25] C. M. Tsai and H. J. Lee, “Binarization of color document images via luminance and saturation color features,” IEEE Trans. Image Processing, vol. 11, no. 4, pp. 434-451, 2002. [26] C. C. Yang and S. H. Kwork, “Efficient gamut clipping for color image processing using LHS and YIQ,” Optical Engineering, vol. 42, no. 3, pp. 701-711, 2003. [27] H. Levkowitz and G. Herman, “GLHS: A generalized lightness, hue, and saturation color model,” CVGIP: Graph. Models Image Process, vol. 55, no. 4, pp. 271–285, 1993. [28] Foley, Van Dam, Feiner, and Hughes. Computer Graphics, Principles and Practice, Second Edition in C. Addison-Wesley, 1996. [29] Wikipedia, the free encyclopedia, http://en.wikipedia.org/wiki/HSV_color_space
Chun-Ming Tsai was born in Taipei, Taiwan, in 1963. He received the B.E. degree in Industrial Education from National Taiwan Normal University, Taipei, Taiwan, in 1988. He received the M.S. and the Ph.D. degree in Computer Science and Information Engineering from National Chiao Tung University, Hsinchu, Taiwan, in 1996 and 2002, respectively. Since August 1987, he has been a Teacher with the Information Department, National Tamshui Commercial Industrial Vocational Senior High School, Taipei, Taiwan. Since August 2003, he has been an assistant professor of Department of Mathematics and Computer Science Education at Taipei Municipal University of Education. His research interests include image processing, video processing, computer vision, and document analysis. Zong-Mu Yeh received the M.S. degree in electronics engineering from the National Taiwan University of Science and Technology, Taipei, Taiwan in 1982 and Ph.D. degree in industrial technology from Iowa State University, Iowa, in 1992. He is currently a professor in the department of mechatronic technology and department of industrial education of National Taiwan Normal University (NTNU). His research interests include brain computer interface, fuzzy logic, digital signal processing and E-learning.