www.impactjournals.com/oncotarget/
Oncotarget, 2017, Vol. 8, (No. 59), pp: 99601-99611 Research Paper
A bioinformatics-to-clinic sequential approach to analysis of prostate cancer biomarkers using TCGA datasets and clinical samples: a new method for precision oncology? Hidekazu Yoshie1,2,*, Anna S. Sedukhina1,*, Kimino Minagawa1, Keiko Oda1, Shigeko Ohnuma3, Nobuyuki Yanagisawa3, Ichiro Maeda3, Masayuki Takagi3, Hiroya Kudo2, Ryuto Nakazawa2, Hideo Sasaki2, Toshio Kumai1, Tatsuya Chikaraishi2 and Ko Sato1 1
Department of Pharmacogenomics, St. Marianna University, Kawasaki, Japan
2
Department of Urology, St. Marianna University, Kawasaki, Japan
3
Department of Pathology, St. Marianna University, Kawasaki, Japan
*
These authors have contributed equally to this work
Correspondence to: Ko Sato, email:
[email protected] Keywords: bioinformatics, precision oncology, prostate cancer, PEG10, neuroendocrine prostate cancer Received: May 10, 2017 Accepted: July 19, 2017 Published: August 24, 2017 Copyright: Yoshie et al. This is an open-access article distributed under the terms of the Creative Commons Attribution License 3.0 (CC BY 3.0), which permits unrestricted use, distribution, and reproduction in any medium, provided the original author and source are credited.
ABSTRACT Biomarker-driven cancer therapy has met with significant clinical success. Identification of a biomarker implicated in a malignant phenotype and linked to poor clinical outcome is required if we are to develop these types of therapies. A subset of prostate adenocarcinoma (PACa) cases are treatment-resistant, making them an attractive target for such an approach. To identify target molecules implicated in shorter survival of patients with PACa, we established a bioinformatics-to-clinic sequential analysis approach, beginning with 2-step in silico analysis of a TCGA dataset for localized PACa. The effect of candidate genes identified by in silico analysis on survival was then assessed using biopsy specimens taken at the time of initial diagnosis of localized and metastatic PACa. We identified PEG10 as a candidate biomarker. Data from clinical samples suggested that increased expression of PEG10 at the time of initial diagnosis was linked to shorter survival time. Interestingly, PEG10 overexpression also correlated with expression of chromogranin A and synaptophysin, markers for neuroendocrine prostate cancer, a type of treatment-resistant prostate cancer. These results indicate that PEG10 is a novel biomarker for shorter survival of patients with PACa. Also, PEG10 expression at the time of initial diagnosis may predict focal neuroendocrine differentiation of PACa. Thus, PEG10 may be an attractive target for biomarker-driven cancer therapy. Thus, bioinformatics-to-clinic sequential analysis is a valid tool for identifying targets for precision oncology.
the importance of identifying those biomarkers involved in poor clinical outcomes for malignancies. Prostate adenocarcinoma (PACa) is one of the most common cancers in men. In the U.S., the 5 year relative survival rate of early stage PACa is >99% [3]; yet PACa is the second leading cause of cancer-related death in the U.S. This suggests that a subset of PACa is treatment-resistant [3]. To determine the prognosis of a
INTRODUCTION Precision oncology, also called biomarker-driven therapy, has greatly improved clinical outcomes in recent years. Biomarker-driven therapies such as trastuzumab for HER2-positive breast cancer and imatinib for chronic myeloid leukemia [1, 2] highlight the efficacy of targeting biomarkers associated with a poor prognosis and illustrate www.impactjournals.com/oncotarget
99601
Oncotarget
PACa patient, physicians measure levels of prostatespecific antigen (PSA), and use clinical staging and the Gleason score, which is a grading system based on the architectural pattern of tissue from a PACa biopsy [4-6]. In addition to these factors, castration-resistant prostate cancer (CRPC), a transformed prostate cancer mainly caused by continuous androgen deprivation, is linked to a poor prognosis due to limited therapeutic options [7]. Neuroendocrine prostate cancer is a class of CRPC showing neuroendocrine differentiation [8]. Because of its poor prognosis and treatment resistance, there is significant unmet need for new neuroendocrine prostate cancer treatments. However, the best molecular targets for neuroendocrine prostate cancer therapies have not yet been identified [8]. To identify biomarkers of poor prognosis in PACa, we developed a bioinformatics-to-clinic sequential analysis approach and used it to identify a candidate biomarker linked to shorter survival. To evaluate the predictive power of our analytical approach, we examined biopsy samples to see if expression of our identified gene, PEG10, at the time of initial diagnosis affected clinical outcome. PEG10 was also of interest because a recent report implicates it in neuroendocrine differentiation of PACa [9]. Therefore, we also investigated the link between PEG10 expression and neuroendocrine differentiation in clinical samples.
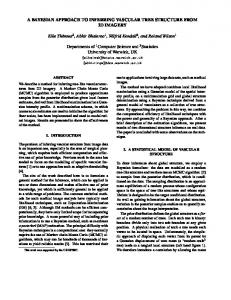
Table 1). We then identified DEGs (false discovery rate (FDR) 1) among genes with a significant p-value for RFS HR (Figure 1 and Table 3). The number of genes responsible for shorter RFS was 630.
Final candidate molecules identified by screening PEG10 was identified by both analyses (HR = 3.0844, 95% CI: 1.397–6.812; p-value = 0.0053). Thus, increased PEG10 expression was chosen as the candidate marker for shorter RFS in those with localized PACa with a Gleason score ≥8. The definition of overexpression in bioinformatics analysis is complex. It is not known whether z-score ≥1 is the most appropriate definition of overexpression. Additionally, we excluded genes overexpressed in less than 5% of the population. However, this exclusion may also result in inaccurate estimations. Therefore, we investigated whether increased expression of PEG10 is linked to RFS using a different definition of increased expression: a z-score ≥1, ≥1.5, or ≥2, without the exclusion of genes overexpressed in less than 5% of the population. Again, increased expression of PEG10 was identified as a biomarker for shorter RFS when using the dataset based on localized PACa (HR = 3.0844; 95% CI, 1.397–6.812; p = 0.0053, for z-score ≥1; HR = 8.6811; 95% CI, 2.557– 29.47; p = 0.0005, for z-score ≥1.5; and HR = 8.812; 95% CI, 2.01–38.63; p = 0.0039, for z-score ≥2).
RESULTS Overview of the bioinformatics-to-clinic sequential analysis method To identify biomarkers that predict shorter survival of patients with PACa, we used two analytical procedures based on the TCGA dataset for localized PACa, followed by validation in clinical samples (Table 1). First, we extracted PACa cases with a Gleason score ≥8; this is because higher Gleason scores are linked to poor clinical outcomes [4]. Next, differentially expressed genes (DEGs) were identified based on relapse-free survival (RFS). DEGs that were highly expressed in the cohort with shorter survival were extracted. Second, the RFS hazard ratio (HR) for all overexpressed genes was calculated to identify genes linked to shorter RFS. Genes identified in both analyses were designated final candidate genes. Finally, the effect of the candidate gene expression on survival was validated using clinical samples (Figure 1).
Validation of the effect of PEG10 expression on survival We investigated the impact of PEG10 overexpression (z-score ≥1) on RFS using the TCGA dataset, different statistical models, Kaplan-Meier analysis, and the log-rank test. Overexpression of PEG10 was linked to shorter RFS (HR = 3.036; 95% CI, 1.893–23.91; p = 0.0033 [log-rank test]) (Figure 3A). The effect of PEG10 overexpression on survival was also validated in a different dataset that included both localized and metastatic cases with a
Identification of DEGs The TCGA dataset was divided into groups based on RFS at 1, 3, or 5 years (Figure 1, Table 1, and Supplementary Table 1). The number of cases in the shorter/longer survival cohorts was 24/102 (1 year), 48/45 (3 year), and 57/15 (5 year) (Table 1 and Supplementary www.impactjournals.com/oncotarget
99602
Oncotarget
Table 1: Baseline characteristics of TCGA database (Gleason score > 8) Total cases
Total
1y
3y
5y